For citation: Betti, G., Karadag, M. A., Sarica, O. & Ucar, B. (2017). Regional Differences in Equivalence Scales in Turkey. Ekonomika regiona [Economy of Region], 13(1), pp. 63–69 doi 10.17059/2017–1–6
UDC: 332
JEL Classification: D12, I32, C51
G. Betti a), M. A. Karadag b), O. Sarica b), B. Ucar b) a) University of Siena (Siena, Italy; e-mail: [email protected]) b) Turkish Statistical Institute (Ankara, Turkey)
REGIONAL DIFFERENCES IN EQUIVALENCE SCALES IN TURKEY
1Equivalence scales have a crucial role in poverty measurement. For Turkey, there are no available up-to-date equivalence scales, representing Turkish data. There were no efforts for calculation of equivalence scales at the regional level. The aim of the paper is to calculate and propose an equivalence scale for Turkey and estimate regional differences. Besides the models with Engel method, different equivalence scales were esti-mated by Almost Ideal Demand System. The results of the first model of AIDS approach composed of 5 age groups, is proposed for Turkey, but for simplicity the results of the second AIDS model could be used as well. In this model, the equivalence scale for Turkey is calculated as 0.65 for each additional adult after the first one and 0.35 for each child. For regional equivalence scales, we use two methods and comare the results. In the first one, regressions were run for each region separately and in the second one, dummy variables intro-duced. The highest difference in the results of the two methods was observed in Istanbul region. The findings for the regional scales are less reliable as the household size is bigger. This limitation is due to the relatively small size of the data sets. Having surveys with higher sample sizes would enable better results. After get-ting the results some conclusions could be drawn especially with regard to child cost differences among re-gions. It was expected to have higher costs for children in poorer regions and the regional results have con-firmed this hypothesis.
Keywords: equivalence scales, child costs, regional equivalence scales, Engel curve, regional differences, almost ideal demand system, poverty measurement, poverty indicators, Turkey, HBS, NUTS
1. Introduction
Equivalence scales used in the calculation of poverty indicators have a remarkable significance. In Turkey, an equivalence scale suggested by World Bank and OECD scales are used for the calculation of different types of poverty indicators. There is a need for an equivalence scale, which is particu-lar to Turkish data. This paper aims to calculate an equivalence scale from Turkish data and propose to be used in the calculation of poverty indicators in Turkey. A second objective of the paper is to calculate equivalence scales at the regional level. This is realized for NUTS1 regions for Turkey.
Equivalence scales are used to enable compari-sons of monetary indicators (i. e. income and con-sumption expenditure among different household types. There is no common determination on how to calculate equivalence scales. In the literature, there are many studies on the classification and construction of equivalence scales. Among oth-ers, Buhmann et al. [1] and Hagenaars et al. [2], Engel [3], Barten [4], Gorman [5], Pollak and Wales [6], Lewbel [7], Deaton and Muellbauer [8] Ray [9], Charlier [10] Pendakur [11], Kot [12], Betti and
1 © Betti G., Karadag M. A., Sarica O., Ucar B. Text. 2017.
Lundgren [13], Dudek [14], Muellbauer and Van de Ven [15], Balli and Tiezzi [16], Majumder and Chakrabarty [17], Rojas [18] are some of the prom-inent studies in literature.
In Turkey, so far, there are two efforts for the calculation of equivalence scales. The first is by Sengul [19], using 1994 Household Consumption Expenditure Survey data. Besides this out-of-date study, there is another study Sengul and Cafri [20], which was performed by local data which is not representative for Turkey. A recent article by Betti et. al. [21] also deals with equivalence scales with regard to poverty measurement in Turkey, but the calculation of equivalence scales is not in the scope of this paper.
The paper is composed of 6 sections. After the present introduction, Section 2 describes the data set. In Section 3, several equivalence scales are es-timated. In section 4, poverty headcount ratios are compared according to different national equiv-alence scales. Section 5 presents the results of equivalence scales estimated at the regional level. Finally, Section 6 concludes the paper.
2. The data set
Household budget survey is one of the impor-tant sources which provides information on
so-cio-economic structures, standards of living, and consumption patterns of the households, and which is used to test the viability of the socio-eco-nomic policies being implemented.
In Turkey, for the measurement of absolute poverty, Household Budget Survey is used. The national poverty line is computed using data from this survey.
This survey aims to reveal consumption pat-terns of households. With this survey, it is possi-ble to produce information on consumption hab-its, types of consumption expenditures and diver-sity of spending for goods and services according to socio-economic characteristics of households, employment status of household members, the total income of households, and source of income. The sample size is around 13 000 households for 2012 Household Budget Survey. The non-response rate was 24.6 %.
For calculation of equivalence scales with Engel method which take into the regions consideration, data for three years, 2010, 2011 and 2012 respec-tively, are pooled and reweighted. With this new dataset, calculations at the NUTS1 level are made possible. For estimations with other Engel models, for consistency, also the three years pooled data-set was used.
The pooled data set only serves for increas-ing the sample size, and for havincreas-ing estimates sig-nificant at the regional level. Pooling more years (i.e. 5 years) comes up with drawbacks because the data is less homogenous (the gap is too large from the first and last period). The years 2010–2012 are specifically chosen because these years are more homogenous in terms of consumption pattern in Turkey.
3. Empirical analysis: equivalence scales The first model estimated by using HBS, is based on the food ratio method, which refers to Van Ginneken [22]:
lnF a bi = + ln X c N ei+ ln i+ ,i (1) where F is the expenditure for food (COICOP cat-egory 1), X is the total consumption expenditure and N stands for family size. Engel’s [3] law states that the household’s standard of living varies in-versely with the food ratio. By making use of this law, the economies of scale ε (for d(F/X) = 0) can be derived: ln . ln 1 X c N b ∂ ε = = ∂ - (2) The model estimated by making use of HBS data, points out a rather high elasticity value, which is equal to 0.6486. This confirms that both
OECD-modified scales and the 'official scales' are too flat for Turkey.
Moreover, in order to observe the effect of adults and children separately, Engel curves are also estimated applying the model given in Deaton and Muellbauer [23] which is an extension of Working-Leser equation: 1 1 2 2 ln , f x w n n n = a + β + γ + γ + ε (3) where wf is food share of households, x is total
ex-penditure, n is household size, n1 is the number of children (age ≤ 13) and n2 is the number of adults (age > 13). In order to get regression parameter es-timates, we use pooled Household Budget Survey data for years of 2010–2012, total sample size is 29 987. For Turkey as a whole, summary results of regression model (3) are given below,
(0.00099) 1 2 (0.00067) (0.00056) 0.90934 0.09860ln 0.01936 ˆ 0.00948 , f x w n n n = - -- - (4) 2 0.2184. R =
In addition, the model above that contains ex-tra-regional dummies (12 regions) is re-estimated, where dummies are introduced in the model, in a way that changes the only level of the regression line. Results for model (3) with regional dummies is given below, (0.00101) 1 2 (0.00066) (0.00055) 0.81470 0.08842ln 0.01872 ˆ 0.00919 , f x w n n n = - -- - (5) 2 0.2516. R =
In order to convert Engel curves to equivalence scales, the procedure in Deaton and Muellbauer [23] is followed. A household that contains one adult is chosen as a reference and average cost of extra adult and child to one-adult-households are estimated as in Table 1. If extra cost of adult/child is estimated less than 0.20, they are accepted as 0.20.
As seen in Table 1, estimated equivalence scales from both models are so close to each other. Therefore, for further analysis, we chose the esti-mates from the model with regional dummies as proposed equivalence scales for Turkey based on Engel method since it takes into account regional differences.
The third estimated model is the AIDS intro-duced in Section 2, where socio-demographic var-iables have been introduced using the Ray [9] Price Scaling method: ln
( )
, x m p z where m(p, z) is de-fined in two different methods:1)
( )
5( )
5 1 1 , i i , i i, i i m p z z m p z z = = =∑
t =∑
t where zi are the number of persons in each one of the follow-ing five age groups: children aged 0–5; children aged 6–13; children aged 14–17; adults aged 18– 64; elderly aged 65+. 2)( )
2( )
2 1 1 , i i , i i, i i m p z z m p z z = = =∑
t =∑
t where zi are the number of persons in each one of the follow-ing two age groups: children aged 0–13; adults aged 14+.For estimating the AIDS model, the 12 con-sumption expenditure classes, of the COICOP classification, are collapsed into nine groups. This has been necessary since some components show a very small share of total consumption (below 4–5 %), so that the corresponding parameters in the AIDS model may have a too large sampling variance. The first five groups and the last group
are not aggregated. On the other hand, group 6, 10 and culture section of group 9 are aggregated and new group 6 is created; group 7 and 8 are ag-gregated and new group 7 is created and recrea-tion secrecrea-tion of group 9 and group 11 are aggre-gated and new group 8 is created 1.
The findings from the AIDS models are as fol-lows Table 2 and 3.
On the basis of the results from the estimated models by Engel method and by AIDS models, here we propose a new equivalence scale for Turkey (Table 4) as well as its alternative (5), based on the findings as reported in detail in Table 2 and Table 3. 1 1. food and non-alcoholic beverages; 2. alcoholic beverages, tobacco; 3. clothing and footwear; 4. housing, water, electric-ity, gas and other fuels; 5. furnishings, household equipment and routine maintenance of the house; 6. health; 7. transport; 8. communication; 9. recreation and culture; 10. education; 11. restaurants and hotels; 12. miscellaneous
Table 1
Average cost of extra adult/ child to the household that contains one adult
Extra National: 1. Without regional dummiesAdult Child National: 2. With regional dummiesAdult Child
1. Person 0.82 0.64 0.8 0.62
2. Person 0.66 0.39 0.64 0.34
Table 2
AIDS_PS1 estimates (p-values are reported in parentheses)
Group 1 Group 2 Group 3 Group 4 Group 5 Group 6 Group 7 Group 8
ai 0.683647 0.184612 -0.10025 1.076195 -0.05145 -0.14386 -0.49385 -0.04196 (<.0001)*** (0.0005)*** (0.0266)* (<.0001)*** (-0.3777) (0.0088)** (<.0001)*** (-0.3746) βi -0.08222 -0.0062 0.018153 -0.1028 0.017655 0.027693 0.092197 0.019151 (<.0001) *** (<.0001)*** (<.0001)*** (<.0001)*** (<.0001)*** (<.0001)*** (<.0001)*** (<.0001)*** γ1, i 0.061685 0.158941 -0.16394 0.162041 0.027813 -0.05531 0.124862 -0.19236 (-0.5698) (-0.145) (-0.1277) (-0.1283) (-0.7954) (-0.6077) (-0.2429) (-0.0708) γ2, i -0.04451 -0.01736 0.063819 -0.10603 0.020423 -0.0556 0.042222 -0.03041 (-0.4716) (-0.7812) (-0.2993) (-0.0821) (-0.7389) (-0.366) (-0.4888) (-0.6177) γ3, i -0.06038 0.03992 -0.05221 0.041478 0.018752 -0.01544 0.076056 0.059883 (-0.2541) (-0.4549) (-0.3224) (-0.4272) (-0.7206) (-0.7693) (-0.1451) (-0.2508) γ4, i 0.056561 0.079578 -0.05467 -0.31606 -0.04284 0.115286 -0.10978 0.116032 (-0.6077) (-0.4731) (-0.6182) (0.004)*** (-0.6949) (-0.293) (-0.3134) (-0.2852) γ5, i 0.02711 -0.006 0.022179 -0.00429 0.091453 -0.0359 0.032722 -0.05311 (-0.6914) (-0.9306) (-0.7439) (-0.9493) (-0.1772) (-0.597) (-0.627) (-0.4299) γ6, i -0.01017 -0.03253 0.083027 0.038321 -0.03472 0.017581 -0.11832 0.059088 (-0.8744) (-0.6163) (-0.1939) (-0.5457) (-0.5857) (-0.7839) (-0.062) (-0.3509) γ7, i -0.03402 -0.07584 0.048035 0.104342 -0.08305 0.023131 0.072286 -0.00182 (-0.779) (-0.535) (-0.6895) (-0.3833) (-0.4882) (-0.8475) (-0.5464) (-0.9878) γ8, i -0.02755 -0.05584 0.028784 0.009447 0.032004 0.022539 -0.07416 0.035576 (-0.6183) (-0.3162) (-0.6003) (-0.8625) (-0.5587) (-0.6817) (-0.1736) (-0.5122) ˆt1 = 0.287662 ˆt2 = 0.420127 ˆt3 = 0.49914 ˆt4 = 0.586792 ˆt5 = 0.712319 (<.0001)*** (<.0001)*** (0.0009)*** (<.0001)*** (<.0001)*** *** Parameter significant at 99 % level.
** Parameter significant at 95 % level. * Parameter significant at 90 % level.
4. Estimation of headcount ratio
In this section, poverty headcount ratios are calculated with three different equivalence scales to detect the effect of using different scales and highlight its policy implication. The three equiv-alence scales that are compared are, the modified OECD scales, where each additional adult has a weight of 0.5 and every child has a weight of 0.3; the equivalence scale suggested to Turkstat by World Bank, where all adults have a weight of 1 and children have a weight of 0.9 and economies of scale is also used with a power of 0.6; and the new equivalence scales calculated and proposed in this paper, in which each additional adult has a weight of 0.65 and every child has a weight of 0.35. For estimating, the headcount ratio, official abso-lute poverty lines published by Turkish Statistical Institute (TURKSTAT) are used. Poverty lines are derived by inflating the latest published poverty lines with consumer price index.
The results demonstrated in Table 6 indicate that the use of new equivalence scales has an in-creasing effect on poverty headcount ratio espe-cially for more populated households. The mag-nitude of the economies of scale suggested by World Bank has a decreasing effect on poverty
headcount ratio as the household size increases, as expected because of the exponential function it comprises. On the other hand, headcount ratios calculated according to modified OECD scale and new scale indicate similar values. At this point, we argue that the new equivalence scale is preferable to the one suggested by the World Bank because it brings about similar results with the modified
Table 3
AIDS_PS2 estimates (p-values are reported in parentheses)
Group 1 Group 2 Group 3 Group 4 Group 5 Group 6 Group 7 Group 8
ai 0.677908 0.199144 -0.10202 1.116985 -0.06209 -0.15706 -0.52387 -0.03391 (<.0001)*** (0.0002)*** (0.0243)** (<.0001)*** (-0.287) (0.0042)*** (<.0001)*** (-0.4756) βi -0.08155 -0.00816 0.018412 -0.1084 0.019105 0.029498 0.096344 0.018095 (<.0001)*** (<.0001)*** (<.0001)*** (<.0001)*** (<.0001)*** (<.0001)*** (<.0001)*** (<.0001)*** γ1, i 0.07302 0.16978 -0.15692 0.160824 0.0297 -0.0598 0.11327 -0.19609 (-0.5068) (-0.1245) (-0.1503) (-0.1365) (-0.7847) (-0.5839) (-0.2959) (-0.0692) γ2, i -0.04404 -0.0172 0.064033 -0.10585 0.021859 -0.05752 0.044348 -0.03135 (-0.4756) (-0.7828) (-0.2968) (-0.082) (-0.7208) (-0.3489) (-0.4664) (-0.6062) γ3, i -0.06281 -0.04217 -0.05372 0.041698 0.018078 -0.01413 0.078016 0.060834 (-0.2362) (-0.4306) (-0.3094) (-0.4255) (-0.7307) (-0.7887) (-0.1356) (-0.2441) γ4, i 0.069537 0.090999 -0.04689 -0.31673 -0.03634 0.104608 -0.11464 0.109309 (-0.5274) (-0.4111) (-0.6686) (0.0039)*** (-0.739) (-0.3394) (-0.2918) (-0.3133) γ5, i 0.024976 -0.0078 0.020922 -0.00424 0.090034 -0.03369 0.032824 -0.0518 (-0.7143) (-0.9098) (-0.7577) (-0.9497) (-0.1836) (-0.6195) (-0.6256) (-0.4409) γ6, i -0.0136 -0.0355 0.08098 0.038456 -0.03666 0.020677 -0.11744 0.060993 (-0.8322) (-0.5837) (-0.2043) (-0.5435) (-0.5642) (-0.7466) (-0.0635) (-0.3347) γ7, i -0.0458 -0.08642 0.040948 0.105039 -0.08833 0.032045 0.077932 0.00397 (-0.706) (-0.4802) (-0.7338) (-0.3809) (-0.4616) (-0.7903) (-0.5163) (-0.9735) γ8, i -0.03037 -0.05866 0.027002 0.009865 0.032146 0.02287 -0.0701 0.036134 (-0.5846) (-0.2949) (-0.6248) (-0.8572) (-0.5589) (-0.6788) (-0.2006) (-0.5079) ˆt1 = 0.638122 ˆt2 = 0.353734 (<.0004)*** (<.0001)*** *** Parameter significant at 99 % level. ** Parameter significant at 95 % level. * Parameter significant at 90 % level.
Table 4
Proposed equivalence scales for Turkey
Category Scale
First adult of age 18–64 1.00 Any additional adult of age 18–64 0.60 First adult of age 65 or more 0.70 Any additional adult of age 65 or more 0.50 Children of age 14–17 0.50 Children of age 6–13 0.40 Children of age 0–5 0.30
Table 5
Alternative proposed equivalence scales for Turkey
Category Scale
First adult of age 14 or more 1.00 Any additional adult of age 14 or more 0.65 Any additional child of age 0–13 0.35
OECD scale which has common use within the European Union countries and thus enables inter-national comparisons at European level. We also argue that use of new equivalence scale is prefera-ble to modified OECD scale because it’s calculated from Turkish data and thus it’s peculiar to the sit-uation in Turkey.
5. Regional differences in equivalence scales Equivalence scales for each NUTS1 region of Turkey are estimated in order to examine regional differences. To do so, two different approaches are utilised. Firstly, we run regression model (3) for each region separately. Secondly, we add regional dummy variables to all slope parameters in the model (3) and estimate scales for each region. In order to avoid dummy variable trap, eleven dummy variables are created. Dummy variables are intro-duced to slope parameters in a way given below:
1 1 2 2 1 1 2 2 12 11 11 1 1 12 2 1 112 11 1 21 1 2 22 2 2 212 ln ( ln ) ( ln ) ( ln ) ( ) ( ) ( ) ( ) ( ) 2) . f x w n n n x x x D D D n n n D n D n D n D n D n = a + β + γ + γ + +β +β +…+ β + + γ +γ + γ + + γ +γ + γ + ε (6)
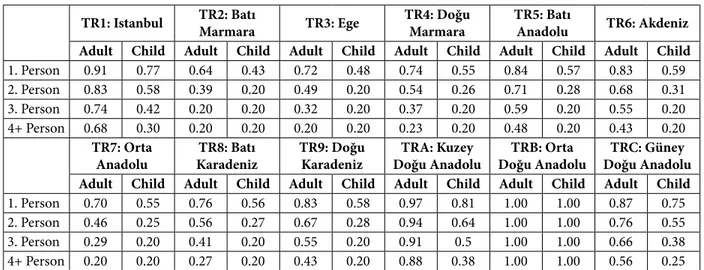
Table 7 gives estimated Engel scales of the first method in which parameters of Model 1 are esti-mated separately for each region. It is observed that there are noticeable differences among re-gions regarding the cost of extra adults and chil-dren. At this point, it should be noted that values higher than 1 are valued as 1 and values less than 0.20 are valued as 0.20 in order to have more plau-sible values instead of figures that are extraordi-narily high or low due to the scarcity of observa-tions at hand. As the number of adults and chil-dren increase the number of observations in the model decrease to very small amounts especially at the regional level and particularly for regions with a smaller number of observations. Therefore, the equivalence scales at the regional level should be approached and evaluated carefully, know-ing that the reliability of the calculated figures is lower as the number of adults and children in-crease in the household.
Table 8 gives estimated Engel scales of the sec-ond approach where parameters of the model that contain regional dummies in all slope parame-ters are used. According to results, the cost of ex-tra adults and children are much higher in regions TRA, TRB and TRC which are relatively less devel-oped regions. It can be concluded that more de-veloped regions indicate less cost of extra adults and children.
When regional equivalence scales derived in both approaches are compared, the biggest dif-ference belongs to Istanbul (TR1) where the cost of extra children and adults are estimated lower in the second approach. On the contrary, the cost of adults in Batı Karadeniz (TR8), Doğu Karadeniz (TR9) and Güney Doğu Anadolu (TRC) are esti-mated higher in the second approach. For the rest of the regions, there aren’t significant differences regarding the method in use.
Table 6
Poverty headcount ratios by equivalence scale and house-hold size
Household
Size OECD(modified) World BankEquivalence Scale New
1 17.1 15.9 14.9 2 11.9 11.1 11.7 3 9.4 7.9 9.7 4 11.4 10.0 12.1 5+ 35.2 26.6 38.2 Total Population 20.8 16.5 22.2 Table 7
Estimated Engel equivalence scale for each region (data separation method)
TR1: Istanbul TR2: Batı Marmara TR3: Ege TR4: Doğu Marmara TR5: Batı Anadolu TR6: Akdeniz
Adult Child Adult Child Adult Child Adult Child Adult Child Adult Child
1. Person 0.91 0.77 0.64 0.43 0.72 0.48 0.74 0.55 0.84 0.57 0.83 0.59 2. Person 0.83 0.58 0.39 0.20 0.49 0.20 0.54 0.26 0.71 0.28 0.68 0.31 3. Person 0.74 0.42 0.20 0.20 0.32 0.20 0.37 0.20 0.59 0.20 0.55 0.20 4+ Person 0.68 0.30 0.20 0.20 0.20 0.20 0.23 0.20 0.48 0.20 0.43 0.20
TR7: Orta
Anadolu KaradenizTR8: Batı TR9: Doğu Karadeniz Doğu AnadoluTRA: Kuzey Doğu Anadolu TRB: Orta Doğu AnadoluTRC: Güney
Adult Child Adult Child Adult Child Adult Child Adult Child Adult Child
1. Person 0.70 0.55 0.76 0.56 0.83 0.58 0.97 0.81 1.00 1.00 0.87 0.75 2. Person 0.46 0.25 0.56 0.27 0.67 0.28 0.94 0.64 1.00 1.00 0.76 0.55 3. Person 0.29 0.20 0.41 0.20 0.55 0.20 0.91 0.5 1.00 1.00 0.66 0.38 4+ Person 0.20 0.20 0.27 0.20 0.43 0.20 0.88 0.38 1.00 1.00 0.56 0.25
6. Conclusions
This paper was constructed to propose a suit-able equivalence scale for Turkey. For this pur-pose, four different equivalence scales were com-puted. Three were calculated by Engel method, the first disregarding child-adult difference, one taking the effect of regions into consideration and the other one not taking this into consider-ation. The result for the first was too flat while the other two gave similar values. For this rea-son, only one of these equivalence scales, the one which takes into consideration child-adult difference and the effect of regions, was used in the forthcoming analysis. Two other equivalence scales were computed by AIDS model. The first was composed of five different age groups where the second one was composed of only two groups as child and adult where the definitions for child and adult were in line with OECD and EUROSTAT definitions. In this respect, the result of the first AIDS model is proposed for Turkey as it encom-passes more detailed information. On the other hand, the result of the second AIDS model could be used as well for simplicity and if deemed nec-essary to have two age groups in line with OECD scales. According to this equivalence scale, first adult has the value of 1, any subsequent adult has
the value of 0.65 and any children have the value of 0.35.
Comparing poverty headcount ratios showed that use of economies of scale suggested by World Bank created a significant difference. Use of this scale causes underestimation of poverty, espe-cially for bigger households. Although the results indicate similar values for modified OECD scale and the new scale, we propose the use of new scales, which represents Turkish data better be-cause it's calculated from it.
The second objective of the paper was to look at the regional differences in equivalence scales. For this, two different methods were used and the results were presented. At the regional level, the reliability of figures is lower due to the smaller number of observations as the household size gets bigger with additional adults or children. All the same, the study produced equivalence scales at the regional level which can be used in studies for analyses of poverty figures at the regional level.
The results at regional level also confirmed the expectations about regional differences in child costs. The expectation was to observe higher costs for children in poorer regions. The regional equiv-alence scales gave the opportunity to confirm this hypothesis.
Table 8
Estimated Engel equivalence scale for each region (using dummies)
TR1: Istanbul TR2: Batı Marmara TR3: Ege TR4: Doğu Marmara TR5: Batı Anadolu TR6: Akdeniz
Adult Child Adult Child Adult Child Adult Child Adult Child Adult Child
1. Person 0.78 0.64 0.65 0.42 0.70 0.48 0.72 0.55 0.79 0.54 0.86 0.60 2. Person 0.60 0.37 0.40 0.20 0.48 0.20 0.50 0.24 0.60 0.24 0.73 0.33 3. Person 0.44 0.20 0.21 0.20 0.29 0.20 0.33 0.20 0.46 0.20 0.62 0.20 4+ Person 0.31 0.20 0.20 0.20 0.20 0.20 0.20 0.20 0.33 0.20 0.51 0.20
TR7: Orta
Anadolu KaradenizTR8: Batı TR9: Doğu Karadeniz Doğu AnadoluTRA: Kuzey Doğu Anadolu TRB: Orta Doğu AnadoluTRC: Güney
Adult Child Adult Child Adult Child Adult Child Adult Child Adult Child
1. Person 0.71 0.56 0.85 0.57 0.96 0.59 0.98 0.82 1.00 0.98 0.98 0.86 2. Person 0.48 0.26 0.71 0.28 0.93 0.30 0.96 0.66 0.99 0.95 0.97 0.72 3. Person 0.31 0.20 0.59 0.20 0.89 0.20 0.95 0.52 0.98 0.93 0.94 0.61 4+ Person 0.20 0.20 0.49 0.20 0.85 0.20 0.92 0.41 0.98 0.91 0.93 0.51
References
1. Buhmann, B., Rainwater, L., Schmauss, G., &. Smeeding, T. (1988). Equivalence Scales, Well-being, Inequality, and Poverty: Sensitivity Estimates Across Ten Countries Using the Luxembourg Income Study (LIS) Database. Review of Income and Wealth, 34, 115–142.
2. Hagenaars, A. J. M., de Vos, K. & Zaidi, M. A. (1994). Poverty Statistics in the late 1980s: Research in micro-data. Office for Official Publications of the European Community, Luxembourg, 415.
3. Engel, E., (1895). Die Lebenskosten Belgischer Arbeiter-Familien Früher and Jetzt. International Statistical Institute Bulletin, 9, 1–74.
4. Barten, A. P. (1964). Family Composition, Prices and Expenditure Patterns. Econometric Analysis for National Economic Planning. Ed. by Peter E. Hart, Gordon Mills, and John K. Whitaker. London: Butterworths (for Colston Res. Soc.), 320.
5. Gorman, T. (1976). Tricks With Utility Functions. Essays in Economic Analysis: Proceedings of the 1975 AUTE Conference, Sheffield. Ed. by M. J. Artis and A. R. Nobay. Cambridge: Cambridge University Press, 292.
6. Pollak, R. A. & Wales, T. J. (1981). Demographic Variables in Demand Analysis. Econometrica, 49, 1533–1551.
7. Lewbel, A. (1985). A Unified Approach to Incorporating Demographic or Other Effects into Demand Systems. Review of Economic Studies, 52, 1–18.
8. Deaton, A. & Muellbauer, J. (1980). An almost ideal demand system. The American Economic Review, 70, 312–326.
9. Ray R. (1983) “Measuring the cost of children: an alternative approach” Journal of Public Economics, vol. 22, pp. 89–102.
10. Charlier, E. (2002). Equivalence scales in an intertemporal setting with an application to the former West Germany. Review of Income and Wealth, 48, 99–126.
11. Pendakur, K. (2005). Semiparametric estimation of lifetime equivalence scales. Journal of Applied Econometrics, 20, 487–507.
12. Kot, S. (2014). Inter-temporal equivalence scales based on stochastic indifference criterion: the case of Poland. Paper presented to the IARIW 33rd General Conference, Rotterdam, August 2014. Retrieved from: http://www.iariw.org/pa-pers/2014/KotPaper.pdf (date of access: 11.03.2016).
13. Betti, G. & Lundgren, L. (2012). The impact of remittances and equivalence scales on poverty in Tajikistan. Central Asian Survey, 31(4), 395–408.
14. Dudek, H. (2014). Do shares of food expenditure in the European Union converge? A country-level panel data anal-ysis. Economic Computation and Economic Cybernetics Studies and Research, 48(4), 245–260.
15. Muellbauer, J. & Van de Ven, J. (2004). Equivalence Scales and Taxation: A Simulation Analysis. In Dagum C., Ferrari G. (Eds). Household Behaviour, Equivalence Scales, Welfare and Poverty. New York: Springer, 85–106.
16. Balli, F. & Tiezzi, S. (2010). Equivalence scales, the cost of children and household consumption patterns in Italy. Review of Economics of the Household, 8(4), 527–549.
17. Majumder, A. & Chakrabarty, M. (2010). Estimating Equivalence Scales Through Engel Curve Analysis. In: Basu B., Chakravarty S.R., Chakrabarti B.K., Gangopadhyay K. (Eds). Econophysics and Economics of Games, Social Choices and Quantitative Techniques. Springer: New York, 241–251.
18. Rojas, M. (2014). Household Equivalence Scale. Encyclopaedia of Quality of Life and Well-Being Research, 2947–2950.
19. Sengul, H. (2006). Equivalent Scale on Food Consumption in Turkey. Journal of Applied Sciences, 6, 1172–1175.
20. Sengul, S., & Cafri, R. (2010). Yoksulluk Ölçümünde Engel Ve Rothbarth Eşdeğerlik Ölçekleri. Ç.Ü. Sosyal Bilimler Enstitüsü Dergisi. Cilt 19, Sayı 2, Sayfa 47–61.
21. Betti, G., Karadag, M. A., Sarica, O. & Ucar, B. (2016). How to Reduce the Impact of Equivalence Scales on Poverty Measurerement: Evidence from Turkey. Social Indicators Research. DOI: 10.1007/s11205–016–1335–0.
22. Van Ginneken, W. (1982). Generating Internationally Comparable Income Distribution Data: Evidence from the Federal Republic of Germany (1974), Mexico (1968) and the United Kingdom (1979). The Review of Income and Wealth, 28, 365–379.
23. Deaton, A., & Muellbauer, J. (1986). On Measuring Child Costs: With Applications to Poor Countries. Journal of Political Economy, 94, 720–744.
Authors
Gianni Betti — PhD in Applied Statistics, Professor, Department of Economics and Statistics, University of Siena (Piazza
San Francesco, Siena, Tuscany, 531007, Italy; e-mail: [email protected]).
Mehmet Ali Karadag — PhD, Expert, Turkish Statistical Institute (114, Necatibey, Ankara, Cankaya, 06420, Turkey;
e-mail: [email protected]).
Ozlem Sarica — Expert, Turkish Statistical Institute (114, Necatibey, Ankara, Cankaya, 06420, Turkey; e-mail:
Baris Ucar — PhD Candidate, Expert, Turkish Statistical Institute (114, Necatibey, Ankara, Cankaya, 06420, Turkey;