Geosciences 2018, 8, 296; doi:10.3390/geosciences8080296 www.mdpi.com/journal/geosciences Article
How Can Climate Change Affect the UNESCO
Cultural Heritage Sites in Panama?
Chiara Ciantelli 1, Elisa Palazzi 2, Jost von Hardenberg 2, Carmela Vaccaro 3, Francesca Tittarelli 4 and Alessandra Bonazza 1,*
1 Institute of Atmospheric Sciences and Climate, Italian National Research Council, via Gobetti 101,
40129 Bologna, Italy; [email protected]
2 Institute of Atmospheric Sciences and Climate, Italian National Research Council, Corso Fiume 4,
10133 Turin, Italy; [email protected] (E.P.); [email protected] (J.v.H.)
3 Department of Physics and Earth Sciences, University of Ferrara, Via Giuseppe Saragat, 1,
44124 Ferrara, Italy; [email protected]
4 Department of Materials, Environmental Sciences and Urban Planning—SIMAU, Università Politecnica delle
Marche, Via Brecce Bianche 12, 60131 Ancona, Italy; [email protected] * Correspondence: [email protected]; Tel.: +39-051-6399571
Received: 13 July 2018; Accepted: 3 August 2018; Published: 7 August 2018
Abstract: This work investigates the impact of long-term climate change on heritage sites in Latin
America, focusing on two important sites in the Panamanian isthmus included in the World Heritage List: the monumental site of Panamá Viejo (16th century) and the Fortresses of Portobelo and San Lorenzo (17th to 18th centuries). First of all, in order to support the conservation and valorisation of these sites, a characterisation of the main construction materials utilized in the building masonries was performed together with an analysis of the meteoclimatic conditions in their vicinity as provided by monitoring stations recording near-surface air temperature, relative humidity, and rainfall amounts. Secondly, the same climate variables were analysed in the historical and future simulations of a state-of-the-art global climate model, EC-Earth, run at high horizontal resolution, and then used with damage functions to make projections of deterioration phenomena on the Panamanian heritage sites. In particular, we performed an evaluation of the possible surface recession, biomass accumulation, and deterioration due to salt crystallisation cycles on these sites in the future (by midcentury, 2039–2068) compared to the recent past (1979–2008), considering a future scenario of high greenhouse gas emissions.
Keywords: built heritage; environmental impact; damage functions; Central America; surface recession;
biomass accumulation; salt crystallisation
1. Introduction
Awareness of the possible risks connected with climate change and its impacts on the environment and society is increasingly growing. In recent years, particularly in Europe, the Cultural Heritage sector has become conscious of the potential problems related to climate change impacts on the materials which constitute our “tangible culture”. Indeed, the Intergovernmental Panel on Climate Change (IPCC) mentioned for the first time the “Cultural Heritage” issue in its Fifth Assessment Report (AR5, 2014) [1]. In particular, Section 3.4.3 of the WG3 highlighted the need to promote people’s wellbeing, including the loss of cultural heritage sites, as a metric of quality of life [1,2].
The importance of identifying the multiple effects of climate change on cultural heritage has started to be recognized even in the political sector. In fact, a recent publication commissioned by the European Commission (EC) addressed the safeguarding of cultural heritage from natural and
anthropic disasters [3]. In particular, that work was developed with the aim of providing guidelines and recommendations for possible measures to improve the risk management of cultural heritage at the European level and in support of the implementation of the Sendai Framework Action Plan Priority 4 [4].
Nevertheless, further steps are necessary in order to ensure a sustainable culture, for assuring the best preservation of monumental complexes, archaeological sites, historical urban centres, artefacts, etc., and for guaranteeing their fruition by the future generations.
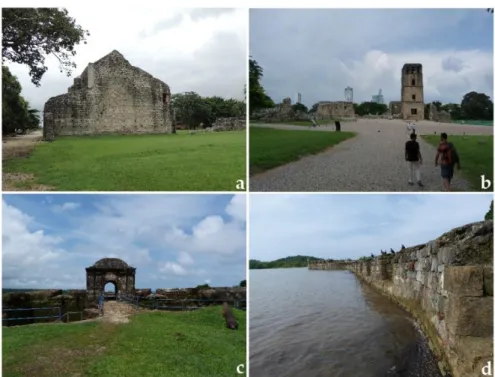
With the aim of enhancing knowledge in this field, in particular in Central America, an area not yet largely investigated, an international research effort was initiated in 2014 [5]. In this context, the present study considers two sites of global importance: the monumental site of Panamá Viejo, the first Spanish settlement on the Pacific Coast, and the Spanish military fortifications arising on the northern littoral of the isthmus (Figure 1). Both are included in the List of World Heritage Sites; the fortifications on the Caribbean Side of Panama, in particular, are on the List of World Heritage in Danger since 2012. Furthermore, the Portobelo and San Lorenzo Fortifications are in rural areas, while Panamá Viejo is in the urban site of Panama City; nevertheless, both sites are exposed to the same climatic conditions.
Figure 1. Pictures of different monuments present at the sites: (a,b) at Panamá Viejo, respectively, Convento de las Monjas de la Concepción and Torre de la Catedral; (c) Fort San Lorenzo; (d) Fort San Jeronimo, at Portobelo.
Recognising the potential contribution of climate change in increasing the vulnerability of natural, economic, and social systems, the Panamanian Government in 2007 approved the National Policy on Climate Change (Executive Decree No. 35, 26 February 2007). Seven years later, at the United Nations Climate Summit, the Panamanian President Varela Rodríguez presented the Estrategia Nacional de Cambio Climático de Panamá—ENCCP (Panama’s strategy for challenging Climate Change), which developed the commitments of environmental protection measures established in the Plan Estratégico de Gobierno 2015–2019 (PEG) [6,7].
The PEG addresses the issue of adaptation to climate change impacts, considering several sectors, such as agriculture, water, energy, and logistics, marine-coastal areas, and resilient districts but neglecting cultural heritage. Thus, the present study aims to contribute to increasing the resilience of UNESCO cultural heritage sites in Panama to the environmental impacts of climate change.
1.1. Overview of Environmental Impact on Cultural Heritage
In the last decades, several works have dealt with the issue of the weathering of building materials, as described by a recent publication of Camuffo [8], which presents a comprehensive picture based on the literature of the damage occurring to heritage construction materials due to the impact of weather and air pollution, acting separately or in synergism.
Considering the stone masonry, the first step for evaluating the damages is the characterisation of the material, which includes the analysis of its composition, mineralogy, petrography, and physical features (e.g., porosity), all being necessary to understand its current state of conservation. Furthermore, we have to consider that the deterioration phenomena can be modified (accelerated/slowed, increased/decreased, etc.) by climate change [9,10].
Several damage or dose-response functions have been developed in the literature to reproduce the processes of change that a material can undergo if exposed to particular conditions. As Strlič et al. [11] note, “Damage functions can be defined as functions of unacceptable change to heritage dependent on agents of changes”, thus, mathematical expressions can be considered instruments for modelling materials modifications, allowing us to evaluate past and future damages.
Regarding future damages, it is possible to implement “predictive maintenance” based on future climate projections performed with numerical models of the climate system [11], which are mathematical formulations “constructed from studies of the current climate system, including atmosphere, ocean, land surface, cryosphere and biosphere, and the factors that influence it such as greenhouse gas emissions and future socio-economic patterns of land use” [12].
Indeed, extracting from the models the parameters that act as drivers of changes on cultural heritage, such as rainfall, relative humidity, and surface air temperature, it is possible to apply them in dose-response functions, representing different kinds of material damages. In order to validate climate models before their variables are used in damage functions and equations, the simulated data should be compared with measured ones.
Several studies have been performed in the last decades based on the application of dose-response functions for estimating the damages on stone materials belonging to monuments in Europe. Dividing the equations in typologies of the measured deterioration process, we can consider damages that cause loss of material, as thermoclastism (thermal stress) affecting marbles [13], surface recession due to rainfall action on carbonate buildings [14–16], salt transitions [17], and cryoclastism (freeze–thaw effect) [18]. While, referring to accumulation of material, functions have been created for soiling and blackening phenomena [19] and biodeterioration [20]. Existing damage functions that describe climate change impacts on cultural heritage materials mainly account for the effects of slow changes, since the effect of extreme events have a higher degree of uncertainty associated.
In 2012, Sabbioni at al. [21] compiled a vulnerability atlas and guidelines for the protection of European cultural heritage (in particular, for the outdoor heritage) against climate change effects, collecting all of the results produced by the FP6 Noah’s Ark Project (2004–2007). The climate parameters, utilized for mapping future scenarios, were extracted from two climate models developed at the Hadley Center (UK), i.e., the global Coupled Climate Model (HadCM3) and the Regional Climate Model (HadRM3) with spatial resolutions of, respectively, 295 km × 298 km and 50 km × 50 km. This allowed the authors to produce maps describing climate conditions, damage, and risk for cultural heritage at the European level. The FP6 Noah’s Ark Project was then the basis for another project, namely, the FP7 Climate for Culture Project—CfC (2009–2014), which addressed forecast hazard and damage projections to assess the impact of slow, ongoing climate change on historic buildings. In that case, a regional hydrostatic climate model was used, called REMO, which has a spatial resolution of approximately 10 km × 10 km for the European and Mediterranean areas. The CfC FP7 project produced more than 55,000 maps to assess the vulnerability of built heritage as well as of artworks preserved indoors [22–27].
Within this research, we analysed a set of simulations performed with the EC-Earth global climate model run at a particularly high spatial resolution (25 km × 25 km, more details in Section 2.1), to map deterioration phenomena due to slow climate change for both past and future conditions over the Panamanian isthmus area encompassing the different locations studied in this work.
1.2. Panamanian Climate Classification
According to the Köppen–Geiger climate classification on the “thermal zones of the Earth” [28,29], then validated for the second half of the 20th century by Kottek et al. [30], the area of Panama has been classified as an equatorial climate, within the types listed below:
● Af: “Equatorial rainforest, fully humid”;
● Am: “Equatorial monsoon”;
● Partially, Aw: “Equatorial savannah with dry winter”;
In this classification, the first letter indicates the main climate typology, in our case A, which refers to the equatorial zone showing a minimum temperature greater than or equal to +18 °C. The second letter indicates precipitation conditions; in our case, “f” refers to the criterion of the precipitation of the driest month (Pmin) ≥ 60 mm/month, while “m” refers to the criterion of the accumulated annual precipitation (Pann) ≥ 25 (100−Pmin) mm/year. Finally, “w” refers to the criterion of Pmin < 60 mm/month in winter [30].
In 2000, a Panamanian geographer and historian, Dr Alberto McKay [31], developed a specific classification of the isthmic environment and climate which takes into account the influence of the oceanic masses and has led to the identification of seven different climate typologies for Panama. Two of them can be associated with the sites that are studied in the present work. The Tropical Oceanic Climate with a short dry season characterises Portobelo and San Lorenzo, where average temperature values are around 25.5 °C on the coastal area and 26.5 °C in the continental part. Precipitations are abundant, reaching annual amounts of 4760 mm. The dry season has a brief duration of 4–10 weeks, with 40–90 mm of precipitations between February and March. While Panamá Viejo has a Tropical Climate with a prolonged dry season, featuring the warmest climate with average temperature values of 27–28 °C and recording the lowest amount of precipitation, lower than 2500 and 1122 mm in a few areas. The long-lasting dry season (approximately from December to March) is characterised by strong winds, with mid-high clouds, low humidity, and, consequently, high evaporation.
The proximity of our study sites to the sea made sea level and tidal variations important factors for the progressive coastal erosion in the last five centuries [32–34]. This carried the ruins of Panamá Viejo to be only 100 m from the sea [35], causing also the erosion of some monuments at the site of Panamá Viejo erected in the part closest to the coast. Furthermore, tidal variations expose the fortresses located in Portobelo to seawater action, in addition to the rainfall effects. Indeed, several of these structures are exposed to sea intrusion, especially during storms, while the daily tidal variations cause the erosion of the external walls and water infiltration. Even if the short-term tidal effects and coastal erosion are not the subject of this study, their long-term consequences can contribute to the presence of salts within the masonries and thus to their weathering action [36]. In fact, by the end of the 21st century, it is very likely that a large fraction of the coastal areas around the globe will be affected by sea level rise induced by global warming [37], with specific impacts strongly varying from coast to coast as a result of a combination of different factors.
2. Materials and Methods
2.1. Selection of Monitoring Stations and Climate Model
With the purpose of obtaining measured climate parameters in the surroundings of the monumental site of Panamá Viejo as well as the Portobelo and San Lorenzo areas in the recent past, several monitoring stations were selected. Specifically, they belong to the networks of the Panama Canal Authority (ACP) and of the Empresa de Trasmision Electrica S.A. (ETESA), and their data were downloaded from the Smithsonian Tropical Research Institute (STRI) and ETESA websites, respectively [38,39]. It has to be underlined that the data presented here, elaborated by authors, are a modified version of the original. The name, elevation, and measured parameters (rainfall, R; relative humidity, RH; surface air temperature, T) of the various stations considered in this study are listed in Table 1 and their geographical locations are shown in Figure 2. As suggested by STRI, the Cristobal,
Cocosolo, and Limon Bay stations (CCL in the legend of Figure 2) are grouped together and considered as a single station.
Table 1. Monitoring stations selected as the closest to the sites of interest, respectively: in white, Panamá Viejo; in blue, Portobelo; and in green, San Lorenzo.
Name Label Elevation (m) Date
Available Climate Parameters
R RH T
Hato Pintado HP 45 1 July 1987– ×
Tocumen T 18 1 January 1970–1 January 2013 × × ×
Balboa FAA B-FAA 10 1 January 1908– × × ×
Portobelo Pb 2 1 May 1908–1 January 2004 × ×
Gatun Rain Z.C. G 31 1 January 1905– × × ×
Cristobal
CCL
8.5 1 October 1862–30 September 1979
Coco Solo 4.6 1 September 1980–30 June 1996 × × ×
Limon Bay 3 1 November 1996– × × ×
Fort Sherman FS 9 24 April 1997–14 October 2014 × × ×
Pina P 3 1 December 1970–1 November 1998 ×
In this study, specific simulations with the state-of-the-art global climate model EC-Earth [40,41] performed in the framework of the “Climate SPHINX” (Stochastic Physics HIgh resolutioN eXperi-ments) experiment were also considered [42,43]. EC-Earth is a Earth system model developed by a consortium of European research institutions and universities, based on state-of-the-art models for the atmosphere, ocean, sea ice, and the biosphere [42]. The simulations performed with EC-Earth in Climate SPHINX were atmosphere-only experiments extending 30 years into the past (from 1979 to 2008) and 30 years into the future (from 2039 to 2068) using forcing conditions from the Representative Concentration Pathway emission scenario RCP 8.5 [44]. EC-Earth was run exploring five different horizontal resolutions, i.e., ~125, ~80, ~40, ~25, and ~16 km. For the present study, only the simulations performed at 25 km were analysed.
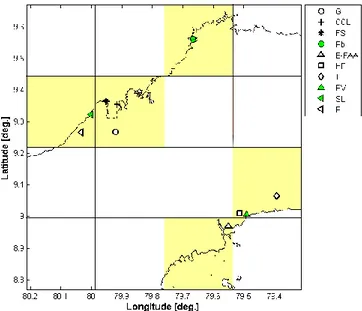
The area of the central part of the isthmus covered by the EC-Earth pixels is shown in Figure 2. The following model variables—daily rainfall (mm), daily surface air temperature (°C), and daily relative humidity (RH)—were analysed only in the model pixels where the monitoring stations are located.
Figure 2. Grid areas of EC-Earth model. Highlighted in yellow are the zones that overlap or are near the sites of interest. On the right, for the legend of the markers, the white symbols indicate the monitoring stations, the green markers the sites, respectively: G = Gatun Rain Z.C., CCL = Cristobal– Cocosolo–Limonbay, FS = Fort Sherman, Pb = Portobelo (both monitoring station and site), B-FAA = Balboa-FAA, HP = Hato Pintado, T = Tocumen, PV = Panamá Viejo, SL = San Lorenzo, P = Pina.
2.2. Analysis of Construction Materials
Specimens collected from the masonries and possible quarries during a sampling campaign underwent the following mineralogical–petrographic, physical, and chemical analyses:
• Stereomicroscope observations using an Optika SZ6745TR equipped with a webcam, MOTICAM
2005 5.0 Mp, and Moticam Image Plus 2.0 software, were utilized for performing preliminary analyses of the bulk samples.
• Polarized light microscopy (PLM) investigations were performed for the analysis of uncovered thin
sections, partially polished in order to observe in both transmitted and reflected light, using an Olympus BX 51 microscope equipped with scanner-camera and the MICROMAX software “Primoplus_32” vers. 8.11.02. Furthermore, for evaluating the state of conservation, the thin sections were realized through transversal cuts from the external to the inner part of the samples. • X-ray powder diffraction (XRPD) analysis was performed for determining the mineralogical phases
present using a Philips PW 1730 diffractometer equipped with a copper anticathode and a nickel filter. The measurement conditions have a diffraction interval of 2θ, between 5° and 50°, and a 2°/min step at 40 kV voltage and 30 mA current intensity. In addition, further analyses were performed in order to verify the clay minerals present in several samples, utilizing a Bruker AXS D8, in Bragg-Brentano geometry, equipped with an X-ray tube and a SolX solid state detector, working in low-temperature through Peltier cooling system. The samples for these techniques underwent a powdering process, utilizing two mills, firstly a jaw crusher and secondly a mortar grinder with agate jar and pestle. For materials showing high hardness, the process was finished by manual grinding with an agate mortar.
• Environmental scanning electron microscopy and microchemical investigations (ESEM-EDS); analyses
were carried out to determine the elemental composition of specific areas of interest, already observed by stereomicroscope and PLM investigations on both bulk and thin sections. The instrument utilized a ZEISS EVO LS 10 with LaB6 source.
• X-ray fluorescence (XRF) was performed on powder pellets (see XRPD section for powdering
process) pressed with boric acid powder as a binder using a wavelength-dispersive automated ARL Advant’X spectrometer. Accuracy and precision for major elements were estimated 2%– 5%; trace elements (above 10 ppm) were estimated at greater than 10%.
• Mercury intrusion porosimetry (MIP) was performed to understand the porosimetry features of
the materials and to index of their state of conservation. Specimens that showed enough material (~1 cm × 1 cm × 1 cm to 2 cm × 2 cm × 2 cm) were selected and analysed by a porosimeter, PASCAL 240, THERMO SCIENTIFIC.
• Ion chromatography (IC) analyses were performed on samples showing particular patina or
superficial alteration phenomena in order to evaluate the possible presence of soluble salts present in the masonry. The selected specimens, powdered (see XRPD section for powdering process) and then solubilized (sample/water ratio 25 mg/~50 g), were investigated by a DIONEX ICS 900. Anions analysis: Column S23 column G23; cations analysis: Column CS12 Pre-column CG12.
3. Results and Discussion 3.1. Materials Characterisation
Optical microscopy integrated with X-ray diffraction and X-ray fluorescence showed that construction materials at Panamá Viejo masonries are mainly composed of polygenic breccias, tuffites, basaltic andesites, rhyolites, and sporadic rhyodacites. For the Portobelo Fortifications, coral limestones and sandstones were identified as the principal construction materials, while basaltic andesite was observed only at Fort San Fernando [45]. Finally, at Fort San Lorenzo, tuffites and grainstones were detected in the masonries (Figure 3).
Figure 3. Lithotypes detected in the sites of Panamá Viejo (on the left) and of Portobelo and San Lorenzo (on the right). The pie charts indicate the percentage of materials detected with respect to the entire number of samples analysed at each site. Each section of the pie charts shows a picture obtained by polarized light microscopy (PLM) observations of thin sections of the different lithotypes. The percentage is obtained considering as 100% the total number of samples per site.
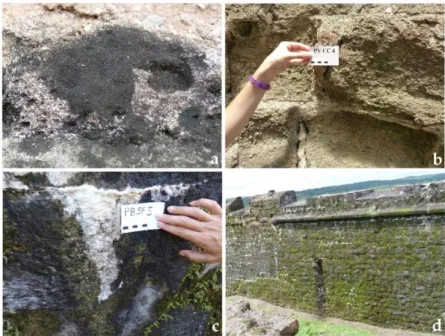
Concerning the state of conservation, the most diffused deterioration phenomena are due to biological growth, material loss, disintegration (sanding and pulverization), salt encrustations (especially at the Portobelo Fortifications, presenting a process of calcite crystallisation developed in several steps), the presence of soluble salts, and chromatic alteration (in particular, affecting rhyolites) (Figure 4).
Figure 4. Pictures representing several deterioration processes observed at the sites. (a,b) at Panamá Viejo, (a) biological growth; (b) surface recession/material loss; (c) encrustation at Fort San Fernando (Portobelo); (d) biological growth at Fort San Lorenzo.
Through the petrographic characterisation performed by PLM, porosity was also investigated. In particular, coral boundstones and grainstones/packstones show a very high intergranular and intragranular porosity. While, considering the sandstones and tuffites, they are more compact but affected by cracks. MIP analysis revealed, in general, that the majority of samples analysed present an average pore diameter lower than the 0.2 μm, the threshold of micropores. Furthermore, almost all samples show a range of pore distribution between 0.01 and 10 μm, except for rhyodacites and rhyolites, which tend to have the majority of pore diameters between 0.01 and 1 μm and coral limestones, showing a predominance towards to 10 μm. Regarding in particular carbonate-based
stones, the percentage of accessible porosity percentage under 25% was detected in several samples of polygenic breccia, tuffite, sandstone, grainstone, and boundstone.
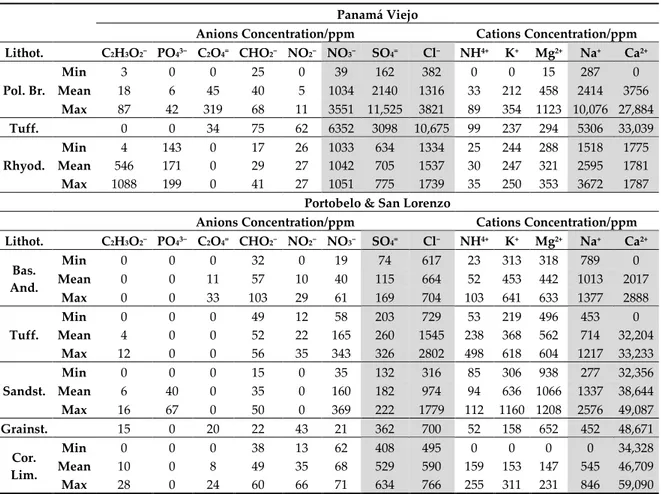
Regarding the presence of soluble salts, through the IC investigations, it was possible to define calcium as the most abundant cation in all specimens analysed and at every site (Table 2). Moreover, high presence of sulphates and nitrates has been detected, particularly at Panamá Viejo, since it is within an urban area in proximity to a high-traffic road and thus affected by heavy anthropogenic pollution. At Portobelo and San Lorenzo, the most abundant anion is chloride, and, considering the cations detected, it can form sodium, potassium, ammonium, and magnesium chloride. Nevertheless, the presence of halite is assumed at every site since chloride is largely present also in Panamá Viejo specimens. Furthermore, in presence of water, Cl− can create hydrochloric acid, as sulphates and nitrates can form, respectively, sulphuric and nitric acid, causing the dissolution of carbonates, which can recrystallise inside the stone porosity and cause internal tensions or on the surface, forming superficial encrustations of calcite (Figure 4c).
Table 2. Ions detected by ion chromatography (IC) in representative lithotypes belonging to Panamá Viejo, Portobelo, and San Lorenzo, (Pol. Br. = polygenic breccia; Tuff. = tuffite; Rhyod = rhyodacite; Bas. And. = basaltic andesite; Sandst. = sandstone; Grainst. = grainstone; Cor. Lim. = coral limestone). In the columns, we highlighted in grey the most abundant anions and cations.
Panamá Viejo
Anions Concentration/ppm Cations Concentration/ppm Lithot. C2H3O2− PO43− C2O4= CHO2− NO2− NO3− SO4= Cl− NH4+ K+ Mg2+ Na+ Ca2+ Pol. Br. Min 3 0 0 25 0 39 162 382 0 0 15 287 0 Mean 18 6 45 40 5 1034 2140 1316 33 212 458 2414 3756 Max 87 42 319 68 11 3551 11,525 3821 89 354 1123 10,076 27,884 Tuff. 0 0 34 75 62 6352 3098 10,675 99 237 294 5306 33,039 Rhyod. Min 4 143 0 17 26 1033 634 1334 25 244 288 1518 1775 Mean 546 171 0 29 27 1042 705 1537 30 247 321 2595 1781 Max 1088 199 0 41 27 1051 775 1739 35 250 353 3672 1787
Portobelo & San Lorenzo
Anions Concentration/ppm Cations Concentration/ppm Lithot. C2H3O2− PO43− C2O4= CHO2− NO2− NO3− SO4= Cl− NH4+ K+ Mg2+ Na+ Ca2+ Bas. And. Min 0 0 0 32 0 19 74 617 23 313 318 789 0 Mean 0 0 11 57 10 40 115 664 52 453 442 1013 2017 Max 0 0 33 103 29 61 169 704 103 641 633 1377 2888 Tuff. Min 0 0 0 49 12 58 203 729 53 219 496 453 0 Mean 4 0 0 52 22 165 260 1545 238 368 562 714 32,204 Max 12 0 0 56 35 343 326 2802 498 618 604 1217 33,233 Sandst. Min 0 0 0 15 0 35 132 316 85 306 938 277 32,356 Mean 6 40 0 35 0 160 182 974 94 636 1066 1337 38,644 Max 16 67 0 50 0 369 222 1779 112 1160 1208 2576 49,087 Grainst. 15 0 20 22 43 21 362 700 52 158 652 452 48,671 Cor. Lim. Min 0 0 0 38 13 62 408 495 0 0 0 0 34,328 Mean 10 0 8 49 35 68 529 590 159 153 147 545 46,709 Max 28 0 24 60 66 71 634 766 255 311 231 846 59,090
For detailed information regarding the previous listed analyses (Section 2.2) and related results, see Ciantelli, 2017 [5].
3.2. Comparison between Climate Simulations and Monitoring Stations
Data obtained from the monitoring stations and from the EC-Earth model simulations have been compared over a common period of time, either the model “historical period”—30 years extending from 1979 to 2008—or shorter time periods, depending on the temporal availability of the measured data.
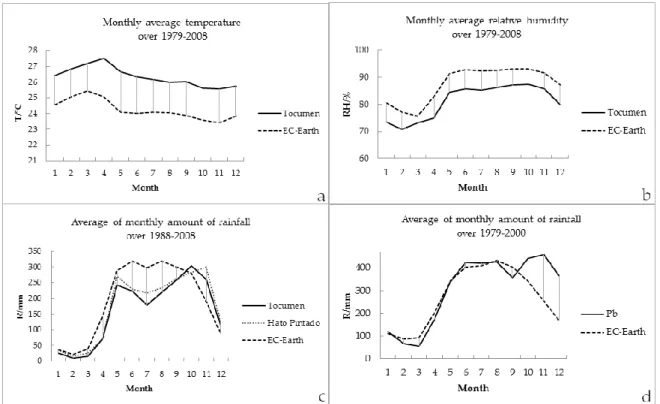
Figure 5a,b show, respectively, the comparison between the annual cycle climatology (averaged over the 1979–2008 time period) of surface air temperature and relative humidity measured at the
Tocumen site and simulated by EC-Earth. The seasonality of both variables is well captured by the model in spite of its underestimation of surface air temperature and overestimation of relative humidity with respect to the measurement data. Figure 5c,d show a comparison between the model and observations of the rainfall climatology. At Tocumen and Hato Pintado, the model exhibits an overestimation of rainfall amounts during the wet season, in particular between May/June to September/October (Figure 5c), while on the on the North Coast, in the areas of San Lorenzo and Portobelo, it significantly underestimates rainfall amounts compared to the observations between October and December (Figure 5d).
Figure 5. (a,b) Comparison between the monthly average values of, respectively, T and RH, over the period 1979–2008, in the area of Panamá Viejo between the data collected from the Tocumen monitoring station and those simulated by EC-Earth; (c,d) comparison of the average of monthly amount of rainfall: (c) in the period 1988–2008, between data of the Hato Pintado and Tocumen stations and of the EC-Earth model; (d) in the period 1979–2000, between data of the Portobelo (Pb) station and of EC-Earth model.
Based on the comparison between the model outputs and the observations over the study sites, bias-correction methods have been applied to the EC-Earth outputs before using them in the damage functions. Basic bias-correction methods include an adjustment of the mean value by adding a temporally constant offset or by applying a correction factor to the simulated data. This additive or multiplicative constant quantifies the average deviation of the simulated data from the observed one over the historical period over which data was compared. In this case, additive adjustments have been adopted for bias correcting the modelled temperature, while multiplicative adjustments were used for relative humidity and rainfall, as better explained below.
• Rainfall: Being Po and Pm the observed and modelled daily precipitation and being their long term average over the period 1979–2008 indicated by an overbar, the multiplicative correction factor, fP, is calculated as Equation (1):
𝑓𝑃 = 𝑃𝑜̅̅̅̅ 𝑃𝑚
̅̅̅̅̅ (1)
Therefore, the factor fP is multiplied by the daily precipitation simulated by the model to obtain the model bias-corrected rainfall.
• Relative Humidity: The same procedure as for rainfall was applied to relative humidity data, using a multiplicative correction factor to bias correct the model data based on observations. In this case, the correction factor multiplied to the daily model data is fRH (Equation (2)):
𝑓𝑅𝐻 = 𝑅𝐻𝑜̅̅̅̅̅̅ 𝑅𝐻𝑚
̅̅̅̅̅̅̅ (2)
where 𝑅𝐻𝑜̅̅̅̅̅̅ is the average over the period 1979–2008 of the daily RH for observations and 𝑅𝐻𝑚̅̅̅̅̅̅̅ is the average of the RH for the model.
• Temperature: In this case, an additive correction factor fT is calculated as the difference between the climatological average of the observed daily temperature over the period 1979–2008 and the climatological average of the modelled daily temperature over the same time period, as follows (Equation (3)):
𝑓𝑇 = 𝑇𝑚 − 𝑇𝑜 (3)
The bias-corrected temperature is calculated by adding the correction factor to the daily time series simulated by the model.
Correction factors for all three variables have been applied to both historical data (1979–2008) and to the future data available for the period 2039–2068.
3.3. Selection of Damage Functions
Taking into account the Panamanian climate conditions, the composition of the materials belonging to the buildings under study, their potential deterioration phenomena, and the damage functions developed in the field of stone materials conservation, the following three equations have been applied, considering slow change effects and no extreme events.
(1) Surface recession, according to Lipfert [46], is due to the effect of rain washout. In particular, for the present study, the Lipfert modified equation has been chosen, according to [15], as follows (4):
L = K1,2
×
R (4)where:
L: surface recession per year (μm year−1)
K1: 18.8 intercept term based on the solubility of CaCO3 in equilibrium with 330 ppm CO2 (μm m−1) K2: 21.8 intercept term based on the solubility of CaCO3 in equilibrium with 750 ppm CO2 (μm m−1) R: precipitation (m year−1)
Bonazza et al. [15] demonstrated that the clean rain effect (karst effect) was the dominant term, accounting for 50%–90% of stone loss. It has to be underlined that the K1 constant was utilized both for the past and future situation, while the K2 constant was applied only for the future projections, since the concentration of carbon dioxide is expected to be higher than the past of 330 ppm.
Finally, it has to be underlined that this function has been demonstrated to be valid for carbonate rocks having a porosity lower than 25%.
(2) Salt transitions cycles have been considered for halite. Indeed, considering the proximity to the sea of all the sites under study and the equilibrium RH (%) and T (°C) of NaCl corresponding to 75.3% at 25 °C and 75.1% at 30 °C, dissolution–crystallisation transformations can occur. Specifically, assuming T as a constant and according to Grossi et al. [17], the frequency of cycles has been calculated counting the number of times the average daily RH crossed the DRH/CRH of 75.3% or 75.1% on consecutive days. Only the transitions that occurred when the humidity was decreasing, therefore passing from liquid to solid state, were counted. Thus, it can be affirmed that the number of transitions is virtually the number of dissolution–crystallisation cycles.
(3) Biomass accumulation, considered as organic carbon accretion on the surfaces, it has been obtained utilizing the Gomez-Bolea et al. function (5) [20]:
where the quantity of biomass B (mg) on surface unity (cm−2) is obtained by applying the annual amount of precipitation P (mm) and the annual mean of temperature T (°C).
Nevertheless, it has to be mentioned that this function has been validated for horizontal surfaces of hard acid stones in nonurban European environments.
3.4. Damage Evaluation and Future Predictions
Generally, rainfall events in Panama are very intense, with quite short duration, and are prolonged during the rainy season, which covers the majority of the year (8–10 months). Recent studies demonstrated that in the last years, precipitation around Panama City has increased, exceeding long-term averages. Nevertheless, the beginning and the duration of the rainy, and, consequently, of the dry season have been changing [47]. The concentration of precipitations in specific periods (as mid-August), always according to Paton [47], causes an increment in rain intensity, triggering effects on the monuments exposed to it, such as a higher mechanical erosion and chemical deterioration due to water permeation in the structures [48].
In addition, this phenomenon, in conjunction with the growth of urbanization, which is not adequately planned, caused an increase of surface runoff. Actually, the fast proliferation of urban areas, especially overbuilding and roads paving, creates waterproof surfaces that prevent rainfall water from being drained by the ground, triggering extreme effects such as erosion, sediments, and floods. Finally, runoff can carry contaminants dissolved in it, thus representing a source of danger both for the human beings and for the cultural heritage, which can be exposed to salts and/or pollutants dissolved in water and, consequently, to salt-cycle weathering [31,49–51].
Strictly connected with these phenomena, the most diffused deterioration morphologies observed in the investigated sites are loss of materials, salts crystallisation, and biological growth. Therefore, damage functions have been selected and applied in order to evaluate and predict these alteration patterns.
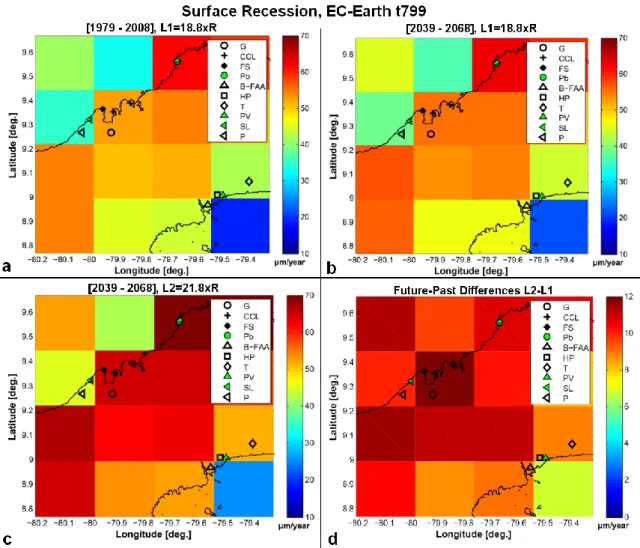
Considering the surface recession, the modified Lipfert function (related to the karst effect) was utilized, as described above. In order to understand the future trend, the function has been applied both in the most optimistic (using K1) and in the most pessimistic (using K2) form. The EC-Earth projections by mid-21st century show an increase with respect to the past from 6–7 μm year−1 (calculated at Panamá Viejo) to 10–12 μm year−1 (at San Lorenzo and Portobelo). It can be assumed that, in the future, the sites situated at the northern Panamanian coast might be more affected by surface recession than those located at the southern coast (Figure 6).
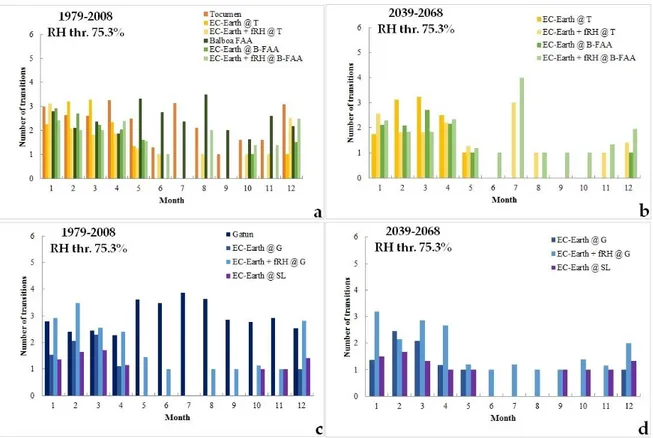
In consideration of the salt cycles of dissolution and crystallisation, halite has been selected as a priority phase of investigation, since sodium and chloride were the most abundant ions in the stone samples at all sites because of their proximity to the sea. In addition, the thermohygrometric conditions at the sites are favourable to dissolution and crystallization cycles of halite. Therefore, the past and future monthly transitions of NaCl have been calculated, considering as an event the passage from RH values higher than 75.3% to values smaller than this threshold, counted only if it happened on consecutive days. Nevertheless, we also have to bear in mind the dependence of this process on temperature. Indeed, even if it can be considered a constant, the temperature of existence of NaCl transition at 75.3% is 25 °C. As stated by Satterthwaite [52], most of the Latin American and Caribbean cities can be affected by an increase of heat waves in the future and, in general, higher temperatures are expected. Thus, NaCl transition at 30 °C was also considered, corresponding to a 75.1% RH threshold.
Past cycles of dissolution and crystallisation of halite highlight that the higher frequency of this phenomenon is recorded during the dry season (end of November/December to April/beginning of May). However, since we noticed an underestimation of EC-Earth simulation during the rainy season in comparison with the monitoring station data, sporadic events cannot be excluded during this period. Nevertheless, we have to bear in mind that the monitoring station represents a punctual situation, while the model grid point can be interpreted as being representative for an area.
In general, making a comparison between the past and future conditions, the period of cycles tends to maintain the seasonality trend presented in the past situation, having a slight decrease of the
maximum values of cycles during the dry months and a slight increase during the rainy ones (±1). Evaluating the difference among the sites, the area near San Lorenzo seems to be the most affected one and especially during the rainy season, reaching 3–4 cycles per month, in contrast with the other sites (e.g., Figure 7).
Figure 6. Estimated surface recession under EC-Earth scenario utilizing data without the bias correction. (a,b) (L1 = 18.8 × R): (a) For the past period 1979–2008 (baseline); (b) For the middle future period (2039–2068); (c,d) Middle future period (2039–2068): (c) Estimated surface recession (L2 = 21.8 × R) under EC-Earth scenario, (d) Differences between the estimated future surface recessions under EC-Earth scenario K2 constant and past recession applying the K1 constant: (L2future = 21.8 × R)–(L1past = 18.8 × R).
In order to estimate the biomass accumulation on hard acid stones, calculated considering the organic carbon accretion on the surfaces, the function developed by Gomez-Bolea et al. [20] has been applied. Regarding the past trend of biomass accumulation calculated with model data and compared with the biomass estimated with monitoring station records, EC-Earth represents better the range of values of the Panamá Viejo zone and the area near San Lorenzo.
In the future situation, the estimation of biomass shows at the Portobelo area the highest values (reaching 21 g cm−2), followed by the area near San Lorenzo (up to 10–20 g cm−2 by EC-Earth simulation data), then the area near Panamá Viejo (up to ~12 g cm−2), and finally the Panamá Viejo and San Lorenzo zones (1–5 g cm−2). Therefore, the highest differences between future and past are recorded at the areas on the north shore, especially Portobelo (Figure 8).
Figure 7. (a,b) Areas surrounding Panamá Viejo; (c,d) areas surrounding San Lorenzo. Comparison of mean of past (a,c) and future (b,d) NaCl monthly transitions considering 75.3% as RH threshold.
Figure 8. Difference between the estimated biomass accumulation between the future and the past period under the EC-Earth scenario, utilizing data without the bias correction.
4. Conclusions and Future Perspectives
Considering the construction materials present in the built heritage which has been investigated in the present study and the climate parameters involved in the deterioration processes, the results discussed in the previous sections allowed us to predict the possible impacts of future climate change on the studied heritage sites in Panama.
We focused on the analysis of rainfall, relative humidity, and surface air temperature, the changes of which are key drivers of the deterioration of cultural heritage. We applied future model predictions of these variables in functions to study the different kinds of material damages which might occur in the future. In particular, all functions that we considered indicate an increase of surface
recession, biomass accumulation, and cycles of dissolution and crystallisation of halite in the future (2039–2068) with respect the past (1979–2008), especially in the North Coast, as shown by the analysis performed at the San Lorenzo and Portobelo areas. Nevertheless, the Panamá Viejo zone also shows an increment of surface recession and biomass accumulation, while, considering the salt cycles, growth is projected to be reduced.
This work represents an important contribution to better understand the possible future impact of climate change on the heritage sites of Central America and to support their management, restoration, and preservation. Nevertheless, in order to carry out a deeper study of the environmental impact, it will also be necessary to integrate the monitoring with pollution data, organizing in situ measurements of both climate and pollution parameters. This is fundamental also for planning field-exposure tests to strengthen the validity of the damage functions in situ. Moreover, these kinds of experiments are necessary as well for the possible evaluation of the efficiency of maintenance and restoration materials applied on specimens of the different rocks present at the sites exposed to the same conditions as the monuments.
Furthermore, since biological growth was one of the most diffused damage phenomena, a study focusing on the identification of the different kinds of species colonising the material surfaces should be implemented, with the additional purpose of improving the effectiveness of the biomass accumulation equation.
Finally, it would also be important to analyse future projections of regional sea level in the Panamanian area to understand the extent to which this could combine with other drivers and contribute to the damage of the coastal built heritage in this area.
Author Contributions: Conceptualization, A.B.; Formal analysis, C.C.; Funding acquisition, C.V. and A.B.; Investigation, C.C.; Project administration, A.B.; Resources, E.P., J.v.H., C.V., F.T. and A.B.; Supervision, A.B.; Writing—original draft, C.C.; Writing—review & editing, E.P., J.v.H. and A.B.
Funding: This research received no external funding.
Acknowledgments: This study was carried out thanks to a fruitful PhD collaborative project that involved the Institute of Atmospheric Sciences and Climate, ISAC-CNR (Bologna, Italy), the Department of Physics and Earth Sciences of the University of Ferrara (Italy) and two Panamanian Patronages: the Patronato Panamá Viejo and the Patronato de Portobelo y San Lorenzo. In particular, authors are very grateful to all the personnel of the Patronages, with a special mention to Julieta de Arango and Silvia Arroyo, belonging to the Patronato Panamá Viejo. While at the Patronato de Portobelo y San Lorenzo we want to acknowledge principally Rodolfo A. Suñé and Wilhelm Franqueza. Finally, a particular acknowledgment to the Smithsonian Tropical Research Institute (STRI’s) Physical Monitoring Program, and specifically to Steven Paton, and to the Empresa de Transmisión Eléctrica, S.A.—ETESA, for allowing authors the access to the historical climate Panamanian data.
Conflicts of Interest: The authors declare no conflict of interest.
References
1. Intergovernmental Panel on Climate Change (IPCC). Climate Change 2014: Mitigation of Climate Change; Contribution of Working Group III to the Fifth Assessment. Report of the Intergovernmental Panel on Climate Change; Edenhofer, O., Pichs-Madruga, R., Sokona, Y., Farahani, E., Kadner, S., Seyboth, K., Adler, A., Baum, I., Brunner, S., Eickemeier, P., et al., Eds. Cambridge University Press: Cambridge, UK; New York, NY, USA, 2014; p. 1454, ISBN 978-1-107-05821-7.
2. Schneider, S.H.; Kuntz-Duriseti, K.; Azar, C. Costing non-linearities, surprises, and irreversible events. Pac.
Asian J. Energy 2000, 10, 81–106.
3. Bonazza, A.; Maxwell, I.; Drdácky, M.; Vintzileou, E.; Hanus, C.; Ciantelli, C.; De Nuntiis, P.; Oikonomopoulou, E.; Nikolopoulou, V.; Pospíšil, S.; et al. Safeguarding Cultural Heritage from Natural and
Man-Made Disasters A comparative Analysis of Risk Management in the EU; European Union: Brussels,
Belgium, 2018; ISBN 978-92-79-73945-3.
4. European Commission. Commission Staff Working Document—Action Plan on the Sendai Framework for Disaster
Risk Reduction 2015–2030, A Disaster Risk-Informed Approach for All EU Policies; European Commission:
5. Ciantelli, C. Environmental Impact on UNESCO Heritage Sites in Panama; University of Ferrara: Ferrara, Italy, 2017.
6. Consejo de la Concertación Nacional para el Desarrollo. Plan Estratégico Nacional con Visión de Estado Panamá
2030; Consejo de la Concertación Nacional para el Desarrollo: Panama, Panama, 2017; ISBN
978-9962-663-33-1.
7. Ministerio de Ambiente; Gobierno de la Republica de Panamá Estrategia Nacional de Cambio Climático
de Panamá. Available online:
http://www.miambiente.gob.pa/images/stories/documentos_CC/Esp_Info_V.1_ENCCP_15.12.2015.pdf (accessed on 25 June 2018).
8. Camuffo, D. Weathering of Building Materials. In Urban Pollution and Changes to Materials and Building
Surface; Brimblecombe, P., Ed.; Imperial College Press: London, UK, 2016; pp. 19–64.
9. Abd El-Aal, A.K. Climate Change and its Impact on Monumental and Historical Buildings towards Conservation and Documentation Ammon temple, Siwa Oasis, Egypt. J. Earth Sci. Clim. Chang. 2016, 7, 339, doi:10.4172/2157-7617.1000339.
10. Brimblecombe, P. Refining climate change threats to heritage. J. Inst. Conserv. 2014, 37, 85–93.
11. Strlič, M.; Thickett, D.; Taylor, J.; Cassar, M. Damage functions in heritage science. Stud. Conserv. 2013, 58, 80–87.
12. Cassar, M.; Pender, R. The impact of climate change on cultural heritage: Evidence and response. In ICOM
Committee for Conservation: 14th Triennial Meeting; Verger, I., Ed.; James & James: The Hague, The
Netherlands, 2005; pp. 610–616.
13. Bonazza, A.; Sabbioni, C.; Messina, P.; Guaraldi, C.; De Nuntiis, P. Climate change impact: Mapping thermal stress on Carrara marble in Europe. Sci. Total Environ. 2009, 407, 4506–4512.
14. Kucera, V.; Tidblad, J.; Kreislova, K.; Knotkova, D.; Faller, M.; Reiss, D.; Snethlage, R.; Yates, T.; Henriksen, J.; Schreiner, M.; et al. UN/ECE ICP Materials Dose-response Functions for the Multi-pollutant Situation.
Water, Air, Soil Pollut. Focus 2007, 7, 249–258, doi:10.1007/s11267-006-9080-z.
15. Bonazza, A.; Messina, P.; Sabbioni, C.; Grossi, C.M.; Brimblecombe, P. Mapping the impact of climate change on surface recession of carbonate buildings in Europe. Sci. Total Environ. 2009, 407, 2039–2050. 16. Inkpen, R.; Viles, H.; Moses, C.; Baily, B. Modelling the impact of changing atmospheric pollution levels on
limestone erosion rates in central London, 1980–2010. Atmos. Environ. 2012, 61, 476–481.
17. Grossi, C.M.; Brimblecombe, P.; Menéndez, B.; Benavente, D.; Harris, I.; Déqué, M. Climatology of salt transitions and implications for stone weathering. Sci. Total Environ. 2011, 409, 2577–2585.
18. Brimblecombe, P.; Grossi, C.M.; Harris, I. Climate change critical to cultural heritage. In Heritage, Weathering
and Conservation; Fort, R., Álvarez de Buergo, M., Gómez-Heras, C., Vázquez-Calvo, C., Eds.; Taylor &
Francis: London, UK, 2006; pp. 387–393.
19. Brimblecombe, P.; Grossi, C.M. Millennium-long damage to building materials in London. Sci. Total
Environ. 2009, 407, 1354–1361.
20. Gómez-Bolea, A.; Llop, E.; Ariño, X.; Saiz-Jimenez, C.; Bonazza, A.; Messina, P.; Sabbioni, C. Mapping the impact of climate change on biomass accumulation on stone. J. Cult. Herit. 2012, 13, 254–258.
21. Sabbioni, C.; Brimblecombe, P.; Cassar, M. The Atlas of Climate Change Impact on European Cultural Heritage
Scientific Analysis and Management Strategies; Anthem Press: London, UK; New York, NY, USA, 2012; ISBN
9780857282835.
22. Huijbregts, Z.; Kramer, R.P.; Martens, M.H.J.; van Schijndel, A.W.M.; Schellen, H.L. A proposed method to assess the damage risk of future climate change to museum objects in historic buildings. Build. Environ. 2012, 55, 43–56.
23. Martens, M.H.J. Climate Risk Assessment in Museums: Degradation Risks Determined from Temperature and
Relative Humidity Data; Technische Universiteit Eindhoven: Eindhoven, The Netherlands, 2012.
24. Antretter, F.; Kosmann, S.; Kilian, R.; Holm, A.; Ritter, F.; Wehle, B. Controlled Ventilation of Historic Buildings: Assessment of Impact on the Indoor Environment via Hygrothermal Building Simulation. In
Hygrothermal Behavior, Building Pathology and Durability; de Freitas, V.P., Delgado, J.M.P.Q., Eds.; Springer
Berlin Heidelberg: Berlin/Heidelberg, Germany, 2013; pp. 93–111, ISBN 978-3-642-31158-1.
25. Kramer, R.; van Schijndel, J.; Schellen, H. Inverse modeling of simplified hygrothermal building models to predict and characterize indoor climates. Build. Environ. 2013, 68, 87–99.
26. Leissner, J.; Kaiser, U. Climate for Culture—Built Cultural Heritage in Times of Climate Change; Fraunhofer MOEZ: Leipzig, Germany, 2014; ISBN 978-3-00-048328-8.
27. Leissner, J.; Kilian, R.; Kotova, L.; Jacob, D.; Mikolajewicz, U.; Broström, T.; Ashley-Smith, J.; Schellen, H.L.; Martens, M.; Van Schijndel, J.; et al. Climate for culture: Assessing the impact of climate change on the future indoor climate in historic buildings using simulations. Herit. Sci. 2015, 3, 38, doi:10.1186/s40494-015-0067-9.
28. Kӧppen, W. Versuch einer Klassifikation der Klimate, vorzugsweise nach ihren Beziehungen zur Pflanzenwelt (Examination of a climate classification preferably according to its relation to the flora). Geogr.
Z. 1900, 6, 593–611, 657–679.
29. Geiger, R. Klassifikation der Klimate nach W. Kӧppen (Classification of climates after W. Kӧppen). In
Landolt-Bӧrnstein—Zahlenwerte und Funktionen aus Physik, Chemie, Astronomie, Geophysik und Technik, alte Serie; Springer: Berlin, Germany, 1954; Volume 3, pp. 603–607.
30. Kottek, M.; Grieser, J.; Beck, C.; Rudolf, B.; Rubel, F. World Map of the Köppen-Geiger climate classification updated. Meteorol. Z. 2006, 15, 259–263.
31. Autoridad Nacional del Ambiente. Atlas Ambiental de la República De Panamá, 1st ed.; Autoridad Nacional del Ambiente: Panama, Panama, 2010; ISBN 978-9962-651-49-9.
32. Roden, G.I. Sea level variations at Panama. J. Geophys. Res. 1963, 68, 5701–5710.
33. Alba Carranza, M.M. Geografía Descriptiva de la República de Panamá, 2nd ed.; El Panamá América: Panama, Panama, 1946.
34. Jay, D.A. Evolution of tidal amplitudes in the eastern Pacific Ocean. Geophys. Res. Lett. 2009, 36, L04603, doi:10.1029/2008GL036185.
35. Strong, N. Rates and patterns of coastal erosion for the Panama Viejo historical and archeological site. In
Portland Geological Society of America Annual Meeting; University of Panama: Panama, Panama, 2009; p. 156.
36. Ezcurra, P.; Rivera-Collazo, I.C. An assessment of the impacts of climate change on Puerto Rico’s Cultural Heritage with a case study on sea-level rise. J. Cult. Herit. 2018, 32, 198–209.
37. Church, J.A.; Clark, P.U.; Cazenave, A.; Gregory, J.M.; Jevrejeva, S.; Levermann, A.; Merrifield, M.A.; Milne, G.A.; Nerem, R.S.; Nunn, P.D.; et al. Sea level change. In Climate Change 2013: The Physical Science Basis; Contribution of Working Group I to the Fifth Assessment Report of the Intergovernmental Panel on Climate Change; Stocker, T.F., Qin, D., Plattner, G.-K., Al, E., Eds.; Cambridge University Press: Cambridge, UK; New York, NY, USA, 2013; pp. 1137–1216.
38. Empresa de Transmisión Eléctrica, S.A—ETESA. Available online:
http://www.hidromet.com.pa/clima_historicos.php?sensor=2 (accessed on 25 June 2018).
39. Smithsonian Tropical Research Institute—Meteorology and Hydrology Branch, Panama Canal Authority,
Republic of Panama. Available online:
http://biogeodb.stri.si.edu/physical_monitoring/research/panamacanalauthority (accessed on 25 June 2018).
40. Hazeleger, W.; Severijns, C.; Semmler, T.; Ştefănescu, S.; Yang, S.; Wang, X.; Wyser, K.; Dutra, E.; Baldasano, J.M.; Bintanja, R.; et al. EC-Earth. Bull. Am. Meteorol. Soc. 2010, 91, 1357–1364.
41. Hazeleger, W.; Wang, X.; Severijns, C.; Ştefănescu, S.; Bintanja, R.; Sterl, A.; Wyser, K.; Semmler, T.; Yang, S.; van den Hurk, B.; et al. EC-Earth V2.2: Description and validation of a new seamless earth system prediction model. Clim. Dyn. 2012, 39, 2611–2629.
42. Davini, P.; von Hardenberg, J.; Corti, S.; Christensen, H.M.; Juricke, S.; Subramanian, A.; Watson, P.A.G.; Weisheimer, A.; Palmer, T.N. Climate SPHINX: Evaluating the impact of resolution and stochastic physics parameterisations in the EC-Earth global climate model. Geosci. Model Dev. 2017, 10, 1383–1402.
43. Watson, P.A.G.; Berner, J.; Corti, S.; Davini, P.; von Hardenberg, J.; Sanchez, C.; Weisheimer, A.; Palmer, T.N. The impact of stochastic physics on tropical rainfall variability in global climate models on daily to weekly time scales. J. Geophys. Res. Atmos. 2017, 122, 5738–5762.
44. Riahi, K.; Rao, S.; Krey, V.; Cho, C.; Chirkov, V.; Fischer, G.; Kindermann, G.; Nakicenovic, N.; Rafaj, P. RCP 8.5—A scenario of comparatively high greenhouse gas emissions. Clim. Chang. 2011, 109, 33–57. 45. Ciantelli, C.; Bonazza, A.; Sabbioni, C.; Suñé Martínez, R.A.; Vaccaro, C. San Fernando Batteries in
Portobelo- Panama: Building materials characterization and the environmental impact evaluation. In
Modern Age Fortifications of the Mediterranean Coast—Defensive Architecture of the Mediterranean (Fortmed 2015); Editorial Universitat Politècnica de València: Valencia, Spain, 2015.
46. Lipfert, F.W. Atmospheric damage to calcareous stones: Comparison and reconciliation of recent experimental findings. Atmos. Environ. 1989, 23, 415–429.
47. Paton, S. Science of El Niño, The Driest Year Ever?; Trópicos, Magazine of the Smithsonian Tropical Research Institute: Panama, Panama, 2015; pp. 30–33.
48. Camuffo, D. Physical weathering of stones. Sci. Total Environ. 1995, 167, 1–14.
49. Gázquez, F.; Rull, F.; Medina, J.; Sanz-Arranz, A.; Sanz, C. Linking groundwater pollution to the decay of 15th-century sculptures in Burgos Cathedral (northern Spain). Environ. Sci. Pollut. Res. 2015, 22, 15677– 15689.
50. Brimblecombe, P. Urban Pollution and Changes to Materials and Building Surface; Air Pollute Imperial College Press: London, UK, 2016; ISBN 978-1-78326-885-6.
51. Ordóñez, S.; La Iglesia, Á.; Louis, M.; García-del-Cura, M.Á. Mineralogical evolution of salt over nine years, after removal of efflorescence and saline crusts from Elche’s Old Bridge (Spain). Constr. Build. Mater. 2016,
112, 343–354.
52. Satterthwaite, D. Climate Change and Urbanization: Effects and Implications for Urban Governance; United Nations Secretariat: New York, NY, USA, 2007.
© 2018 by the authors. Licensee MDPI, Basel, Switzerland. This article is an open access article distributed under the terms and conditions of the Creative Commons Attribution (CC BY) license (http://creativecommons.org/licenses/by/4.0/).