Ph.D. in Molecular Bio-Pathology
(Disciplinary Field BIO18-Genetics)
Heteroplasmy of the mitochondrial DNA control
region in families of centenarians
Candidate
Vittorio Scornaienchi
Co-ordinator
Prof. Giovanna De Benedictis
Supervisor
Prof. Giuseppina Rose
Sommario... I Summary... III List of abbreviations ... IV
1. Intoduction
1.1 Mitochondria: a dynamic network... 1
1.2 Mitochondria and aging... 5
1.3 The mitochondrial genome and its variability ... 9
1.4 DHPLC for quantifying mtDNA heteroplasmy ... 16
2. Aim of the work and experimental design ... 17
3. Results and discussions 3.1 Quantification by DHPLC of CR-mtDNA heteroplasmy ... 19
3.2 CR-mtDNA heteroplasmy in centenarians, their relatives and unrelated controls... 22
3.3 Contribution of mtDNA inherited variability to the genetic control on CR-mtDNA heteroplasmy ... 25
3.4 The role of C150T mutation in longevity ... 32
4. Concluding remarks ... 36
5. Materials and methods 5.1 Population samples ... 38
5.2 DNA extraction and PCR amplification ... 39
5.3 Molecular cloning ... 42
5.4 DNA sequencing ... 44
5.5 Quantitative DHPLC ... 44
5.6 Haplogroup and haplotype genotyping... 46
5.7 Statistical analyses ... 47
Sommario
Una serie di evidenze sperimentali hanno dimostrato che la variabilità intra-individuale del genoma mitocondriale è fortemente correlata a caratteri complessi quali l’invecchiamento e le malattie neurodegenerative. Questo fenomeno è in linea con la teoria mitocondriale
dell’invecchiamento la quale ipotizza che l’accumulo stocastico età-dipendente di
mutazioni somatiche a carico del DNA mitocondriale, dovuto alla produzione di ROS, potrebbe essere considerato una delle principali cause sia del processo di invecchiamento che dell’insorgenza di patologie età-correlate.
Tuttavia, un recente studio condotto da Zhang e collaboratori (2003) su molecole di mtDNA di leucociti appartenenti ad individui centenari e soggetti più giovani ha rilevato che la mutazione eteroplasmica C150T, localizzata vicino all’origine secondaria della sintesi della catena pesante del mtDNA (OH2), era significativamente più frequente nei centenari rispetto ai controlli. E’ stato inoltre ipotizzato dagli stessi autori che l’accumulo di tale mutazione nei centenari sia geneticamente controllato e che la presenza della forma mutata (150T) in forma omoplasmica causi un rimodellamento dell’origine di replicazione della catena pesante del mtDNA: tale rimodellamento potrebbe fornire un vantaggio verso la sopravvivenza e la longevità. Tuttavia, non è chiaro se l’accumulo della mutazione C150T nei centenari sia effettivamente correlato alla probabilità di raggiungere la longevità o se la sua elevata frequenza nei centenari è dovuta all’accumulo stocastico età-dipendente. Per chiarire questo punto abbiamo realizzato un protocollo sperimentale che prevede l’utilizzo della DHPLC per quantificare i livelli di eteroplasmia. Quindi abbiamo utilizzato tale protocollo per analizzare un campione costituito da centenari, parenti di centenari (figli e nipoti) ed individui di controllo della stessa età dei parenti di centenari. I risultati ottenuti hanno dimostrato che la presenza di eteroplasmia nella regione in esame è
significativamente più elevata rispetto al gruppo di controllo nel gruppo dei centenari (p=0.001), dei figli di centenari (p=0.006) e dei nipoti di centenari (p=0.003). Al contrario, non ci sono differenze significative nei livelli di eteroplasmia tra figli di centenari, nipoti di centenari ed i centenari stessi. Inoltre, suddividendo il gruppo dei figli di centenari in base al sesso del centenario ed analizzando la variabilità ereditaria del genoma mitocondriale (aplogruppi/aplotipi), abbiamo osservato che l’eteroplasmia è indipendente dall’ereditarietà materna, suggerendo che il suo accumulo nella regione del mtDNA analizzata sia regolato principalmente dal genoma nucleare.
In conclusione, i dati presentati aprono una nuova visione sul significato dell’eteroplasmia mitocondriale (almeno quella relativa alla regione esaminata) suggerendo che tale fenomeno potrebbe, in alcune situazioni, favorire la longevità.
Summary
Studies on heteroplasmy occurring in the mitochondrial DNA (mtDNA) control region (CR) in leukocytes from centenarians and younger subjects have shown that the C150T somatic transition is over-represented in centenarians. However, if the accumulation of CR heteroplasmy is a phenotypic consequence of extreme aging or a genetically controlled event that may favor longevity is an open question. To clarify this issue, we applied DHPLC to compare mtDNA CR heteroplasmy occurring in leukocytes of children of centenarians (45-92 age-range; 70 yrs median age; 100 subjects), nieces/nephews of centenarians (33-83 age-range; 70 years median age; 100 subjects), and sex and age matched controls not related with centenarians (38-86 age-range; 71 years median age; 114 subjects). The centenarian probands (97-108 age-range; 100 years median age; 100 subjects) were also analyzed. We confirmed that leukocytes were more often heteroplasmic among centenarians than younger controls (p=0.001). However, heteroplasmy did not differ between parent/offspring generations, and was significantly greater in both children and nephews/nieces of centenarians than in controls (p=0.006 and p=0.003 respectively). Therefore, mtDNA CR heteroplasmy runs in families where longevity runs. By carefully screening DHPLC profiles and comparing them with sequence data, we found that most of CR heteroplasmy was accounted for by the C150T mutation. Finally, by partitioning the group of centenarians’ children according to the sex of the centenarian parent, we found that the genetic control on the occurrence of the C150T transition is not related to maternal inheritance and that CR heteroplasmy is independent of inherited mtDNA variability (haplotypic sequence analyses).
List of abbreviation
AIF Apoptosis Inducing Factor
ATP Adenosine TriPhosphate
bp base pair
cyt b cytochrome b
COX Cytochrome c OXidase
CR-mtDNA Control Region of mitochondrial DNA
CRS Cambridge Reference Sequence
CSB1, CSB2 and CSB3 Conserved Sequence Blocks 1, 2 and 3
DHPLC Denaturing High Performance Liquid Chromatography
D-loop Displacement-loop
DNA DeoxyriboNucleic Acid
Drp1 Dynamin-related protein 1
DZ DiZygotic
FADH reduced Flavin Adenine Dinucleotide
Fis1 Fission protein 1
FMN Flavin MonoNucleotide
GPx Glutatione Peroxidase
GTP Guanosine TriPhosphate
GTPase Guanosine TriPhosphatase
H1 and H2 Heavy strand transcription sites
HSP Heavy Strand Promoter
HVSI and HVSII HyperVariable Segment I and II
LSP L-Strand transcription Promoter
Mfn1 and Mfn2 Mitofusins 1 and 2
MnSOD Manganese SuperOxide Dismutase
mRNA messenger RNA
mtDNA mitochondrial DNA
mtTFA mitochondrial Transcription Factor A
MZ MonoZygotic
NADH reduced Nicotine Adenine Dinucleotide
OAA OxalAcetic Acid
OH1 and OH2 primary and secondary Origin of replication of the Heavy strand of mtDNA
OL Origin of replication of the Light strand of mtDNA
OPA1 Optic Atrophy Protein 1
OXPHOS OXidative PHOSphorylation
PCR Polymerase Chain Reaction
RFLP Restriction Fragment Length Polymorphism
ROS Reactive Oxygen Species
RNA RiboNucleic Acid
RNAi RNA interference
rRNA ribosomal RNA
TCA TriCarbossilic Acid cycle
1.1 Mitochondria: a dynamic network
For a long time mitochondria have been considered static organelles independent each other. However, in the last decade a new picture is emerging where mitochondria form a complex dynamic network continuously reshaped in response to intra- and extra-cell signals. One of the first paper reviewing the behavior of mitochondria in living cells has been published by Bereiter-Hahn in 1990. Thereafter, by applying a number of sophisticated biophysical techniques, previous results have been confirmed showing that the cell mitochondrial fraction can exist as a single interconnected tubular network (Bereiter-Hahn and Voth, 1994). The tube-like filaments (less than ½ micrometer about) constantly change their shape, and the dynamics of such a system has been investigated also by Fourier imaging spectroscopy and digital video fluorescent microscopy (Margineantu et al., 2000). What is the biological significance of this mitochondrial arrangement is still debated, but a current view is that mitochondrial filaments represent electrically united systems which facilitate the delivery of energy to remote parts of the cell (Skulachev, 2001). In any case, a consequence of the dynamic mitochondrial network is the occurrence of two important phenomena, mitochondrial fusion and fission (Yaffe et al., 1999).
Mitochondrial fusion consists in the coordinate fusion of two mitochondria and, consequently, in molecular exchanges between them. Studies in yeast have identified genes involved in mitochondrial fusion (Bleazard et al., 1999; Okamoto and Shaw, 2005) and orthologues of such genes were found to play similar functions in mammalian cells. Mammals have two mitofusin genes, Mfn1 and Mfn2 that encode for GTPases localized at the outer mitochondrial membrane (Chen et al., 2003). These are the only outer membrane proteins known to be
essential for mitochondrial fusion, and therefore principal candidates for mediating directly the fusion process (Koshiba et al., 2004). During membrane fusion, the interaction between Mfn1 and Mfn2 proteins form trans-complexes between adjacent mitochondria (Chen et al. 2003; Eura et al. 2003). In addition to Mfn1 and Mfn2, essential for mitochondrial fusion is the GTPase optic atrophy protein 1 (OPA1) which plays a pivotal role in the fusion of the inner membrane with the outer membrane of each mitochondrion (Chen et al. 2005, Cipolat et al. 2004). Fig. 1 shows a schematic representation of mitochondrial fusion.
Fig. 1 Schematic representation of mitochondrial fusion mechanism. Mfn is a mitochondrial outer
membrane protein with a cytosolic GTPase domain (orange oval) and two coiled coil regions (coils). The C-terminal coiled coil mediates oligomerization between Mfn molecules on adjacent mitochondria. OPA1 (white oval) is a GTPase in the intermembrane space. Mfns and OPA1 coordinate mitochondrial fusion, as shown by mixing of green and red matrix markers to produce yellow (Chen H, Chan DC, 2005).
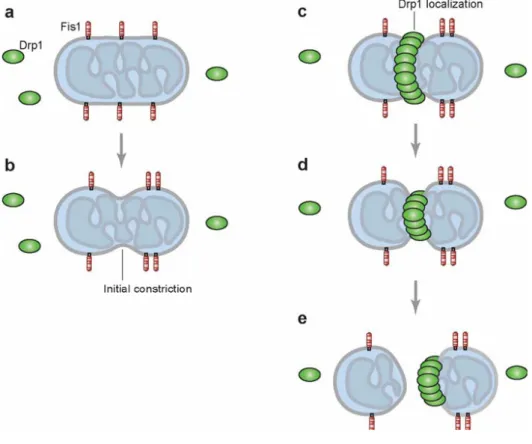
Mitochondrial fission, instead, consists in a mitochondrial division. Generally, the proteins involved in cell membrane dynamism, including mitochondrial fission, are named dynamins. A recent review on the dynamin gene superfamily has been published by Praefcke and McMahon (2004). The main proteins involved in mitochondrial fission are Fis1 and Drp1. Fis1 is a small protein which is uniformly localized at the outer membrane of mitochondria through a single C-terminal transmembrane domain. Drp1 (dynamin-related protein 1) is a large GTPase present in the cytosolic pool, but with a fraction localized at punctuate spots on
mitochondria. Although the proteins involved in fission are known, this process is still unclear. An unresolved question of the fission machinery is how Drp1 is recruited within mitochondria. Likely, Drp1 localization to mitochondria is dependent on Fis1, which is activated before Drp1 and can recruit Drp1 thus driving membrane scission (Chan, 2006). Fig.2 shows a schematic representation of mitochondrial fission.
Fig. 2 Schematic representation of mitochondrial fission. Mitochondrial fission by Fis1 and Drp1. (a) Fis1
resides uniformly on the mitochondrial outer membrane; most of the protein faces the cytosol. Drp1 (green
ovals) exists both in the cytosol and on mitochondria in punctate spots (not shown). (b) Initial constriction of
mitochondrial tubules occurs in a Drp1/Dnm1-independent manner. (c) In some cases, this constriction coincides with Drp1 localization, and (d ) Drp1 probably further constricts the mitochondrial tubule to mediate membrane fission. (e) After fission is completed, the Drp1 complex is localized to the end of one of the daughter mitochondria prior to disassembly. Initial constriction of mitochondria and Drp1 localization are independent events; the diagrams are not meant to imply that they occur sequentially. Only a subset of Drp1 punctae on mitochondria proceeds to actual fission (Chan DC., 2006).
Recent evidences have suggested that the dynamics of mitochondrial fusion and fission may play a role in aging and in particular in the age-associated accumulation of mtDNA heteroplasmy (Jendrach et al., 2005). In fact, several data show that two key functions of mitochondria, electron transport and intrinsic apoptosis, are affected by disruption of molecules involved in mitochondrial fusion and fission. For example, as it regards fission, both mitochondrial fission factors, Fis1 and Drp1, are implicated in apoptosis (Perfettini et al., 2005). As for mitochondrial fusion, the over-expression of Mfn1 and Mfn2 genes reduces apoptotic rate (Sugioka et al., 2004) while the silencing of the OPA1 gene by RNAi induces apoptosis (Olichon et al., 2003). If we consider that age-related mutations could randomly deregulate every part of the genome, including dynamin genes, it is evident that aging by itself may impair fusion and fission, that is two processes crucial for the mitochondrial function.
However, another perspective could be also proposed: fusion may be a resource able to cope with intrinsic age-related damage. In fact, human cells use complementation of fused mitochondria as a defense against the accumulation of oxidative damage during cellular aging (Westermann, 2002). Let us consider the electron transport chain: endogenous respiration rates are reduced in Mfn-null cells and in cells depleted of OPA1 gene activity by RNAi (Chen et al., 2005); therefore, mitochondrial fusion is important for OXPHOS efficiency. Furthermore, in principle, the fusion between OXPHOS-impaired mitochondria may restore an efficient endogenous respiration. Indeed, since the fusion process implies a mixing of mtDNA between two mitochondria, we could hypothesize that the detrimental effects of age-related stochastic mtDNA mutations is nullified by fusion and complementation between the mutant molecules. The mitochondrial complementation could avoid the expression of damaged mtDNA molecules, in such a way providing an effective defense system against deficiencies caused by mutant mtDNAs. The first evidence of mitochondrial complementation
was obtained by Ono and colleagues (2001) who isolated two types of respiration-deficient cell lines characterized by homoplasmic A4269G and A3243G pathogenic mutations in tRNA-Ile and tRNA-Leu genes, respectively. By fusion of these cell lines, the authors observed that the coexistence of both mitochondrial DNAs within hybrid cells restored OXPHOS activity.
On the whole, the stochastic balance between age-related mutation load and complementation in the mitochondrial network could contribute to the individual specific variability which characterizes the phenotypic decline in aging. In any case, the existence of a mitochondrial dynamics and, in particular, the occurrence of mtDNA complementation may induce to revisit the role played by mitochondria in aging. Indeed random somatic mtDNA mutations, that are at the root of age-associated mitochondrial dysfunction, could be complemented by exchange of mtDNA and become not only less harmful but also favorable for living cells. The study of mtDNA somatic mutations in centenarians, who represent the segment of population best adapted to cope with age-related stochastic damage (De Benedictis and Franceschi, 2006), may give insights into this hypothesis.
1.2 Mitochondria and aging
A good way for introducing the conceptual link between mitochondria and aging is to present Fig. 3, that shows the relationship between energy production, ROS generation, and regulation of apoptosis.
Fig. 3 Diagram of the mammalian mitochondrion showing the relationship between energy production, ROS generation and regulation of apoptosis. The figure shows the relationships among OXPHOS, ATP
production, generation of ROS and initiation of apoptosis through the mitochondrial permeability transition pore (mtPTP). The OXPHOS complexes, designated I-V, are: complex I (NADH dehydrogenase) encompassing six Fe-S centers (represented by a small white cube); complex II (succinate dehydrogenase); complex III (cytochrome c reductase) which includes the Rieske Fe-S center; complex IV (cytochrome c oxydase) and complex V (ATP syntase complex) with subunit F0. The mitochondrial respiratory chain also includes
ubiquinone (CoQ) and cytochrome c (cyt c), that act as freely-diffusible electron carriers. The energy released along the OXPHOS pathway is used to pump protons (H+) across the mitochondrial inner membrane, creating a
transmembrane electrochemical potential. A part of the molecular oxygen (O2) consumed by the mitochondria
is reduced to superoxide anion (O2·). The mitochondrial O2· is converted into hydrogen peroxide (H2O2) by the
mitochondrial manganese superoxide dismutase (MnSOD). Finally, the glutatione peroxidase (GPx) converts H2O2 into H2O. In some cases, H2O2 may be transformed in to hydroxil radical (OH·), an extremely toxic
molecule. Each pyruvate molecule produced by glycolysis is actively transported across the inner mitochondrial membrane, and into the matrix where it is oxidized by pyruvate dehydrogenase (PDH) and combined with coenzyme A to form CO2, acetyl CoA and NADH. AcetylCoA enters the tricarbossilic acid (TCA) cycle by
combining with oxalacetic acid (OAA) making citrate that aconitase converts to isocitrate. Aconitase contains a 4Fe-4S center. Small molecules diffuses through the outer membrane via the voltage-dependent anion channel
(VDAC) or porin. The VDAC together with ANT (adenine nucleotide translocator), Bax, and the cyclophilin D (CD) protein form a multi-proteinic complex that brings into contact inner and outer mitochondrial membranes by contact points (mtPTP). The mtPTP can interact with the pro-apoptotic Bax, anti-apoptotic Bcl2 and the benzodiazepine receptor (BD). Increases in cytosolic Ca2+ levels due to activation of ion channel-linked
receptors, can induce permeability transition of the mitochondrial membrane. This phenomenon constitutes the first rate-limiting event of the common pathway of apoptosis. The opening of mtPTP is associated with the release of several pro-apoptotic proteins. Upon permeability transition, apoptogenic factors leak into the cytoplasm from the mitochondrial intermembrane space. Two factors, cytochrome c (cyt c) and apoptosis inducing factor (AIF), activate a cascade of proteolytic activity that ultimately leads to nuclear damage (DNA fragmentation, DNA mutations) and cell death. Cytochrome c, a key protein in electron transport, acts by forming a multimeric complex with Apaf-1, a protease which in turn activates procaspase 9, and begins a cascade of activation downstream caspases.
It is clear from this figure the correlation between OXPHOS and ROS generation, from which the following three assertions arise: i) ROS are produced at a rate proportional to cell metabolism; ii) ROS cause progressive damage to mitochondrial macromolecules, including mtDNA; iii) damage caused by ROS contributes to the phenotypic effects of aging. Harman (1956) was the first to propose a free radical theory of aging suggesting that ROS, which are constantly generated through normal metabolism, cause aging by introducing irreversible damage to membranes, proteins and DNA. The identification of mitochondria as the major source (~90%) of ROS (Boveris et al., 1972) in a cell suggested that mitochondria are also prime targets for oxidative damage, and that the accumulation of defective mitochondria is a major contributor to aging (Harman, 1972). Indeed, dysfunctional mitochondria increase with increasing age both in animal models and human tissues (Cortopassi et al. 1999). Moreover, mitochondria are the only organelles in the animal cell that possess their own DNA with a limited apparatus for DNA repair, further supporting the idea that mtDNA is particularly susceptible to accumulation of damage. In fact, according to the mitochondrial theory of
aging (Harman, 1972, Miquel et al., 1980; Miquel, 1991) the accumulation of ROS-related
mtDNA mutations is the main cause of the aging process. Since mtDNA encodes OXPHOS polypeptides, mtDNA damage leads to a decrease in mitochondrial RNA and protein synthesis. Such a decrease leads to OXPHOS impairment, further generation of ROS, further mtDNA damage. When this vicious circle overcomes a threshold level incompatible with normal cell function, the cell will die (Wei and Lee, 2002).
Although available data indicate that mutations accumulate with age in mtDNA derived from several tissues (Melov et al., 1995; Wallace et al., 1995; Gerhard et al., 2002), the significance of the mitochondrial decline for the aging process is far from being established. The key point is the following: is the age-related mitochondrial decline causative of aging, or, rather, is it a
consequence of the aging process? Several researchers tackled with this question, but the role
of mitochondrial decay in aging is still controversial. Useful insights could be provided by comparative experimental studies in model organisms. Recently, the MiMage Integrated Project has been launched within the 6th Framework Program of the European Commission (http://www.mimage.uni-frankfurt.de/). The overall aim of MiMage is to elaborate the role of the mitochondrial function in aging and lifespan in several biological systems, with special attention to evolutionarily conserved mechanisms shared between invertebrate and mammalian model systems.
The discrepancy among literature data concerning distribution and frequency of age-related mtDNA mutations could be explained by assuming that different mtDNA regions have different susceptibility to mutations. In this case the choice of the region where mutations are analyzed and the experimental approach may be crucial. The ideal target for studying the role of mtDNA epigenetic variability in aging is a region prone to mutation and having functions whose disruption could be easily recognized. From this perspective, the D-loop region is a good choice because: (a) it contains functional elements crucial for both replication (OH1 and
OH2, primary and secondary initiation sites, respectively, of H-strand synthesis) and transcription (H1 and H2 sites); (b) it is also the most variable portion of the human mitochondrial genome (Hasegawa and Horai, 1991). If the same mechanisms that operate to create variation in evolution do operate also during aging, the D-loop region could be a model for getting insights into the mitochondrial theory of aging (Attardi 2002). Accordingly, the study presented here is focused just on this mtDNA region. Before examining aims and results of the study, it may be useful to discuss shortly the variability of the mitochondrial genome.
1.3 The mitochondrial genome and its variability
The mitochondrial genome is a 16,569 bp double-stranded DNA molecule which encodes for 13 peptides, 22 tRNAs and 2 rRNAs. An mtDNA genetic map is shown in Fig. 4. As shown in Fig. 4, the mitochondrial genome contributes polypeptide sub-units to the five enzyme complexes involved in the OXPHOS system by which ATP is synthesized; therefore a good efficiency of the mitochondrial genome is crucial for a good efficiency of the mitochondrial function. What is more, as the assembling of functional enzymes requires interaction among different peptide subunits, variations along the mtDNA molecule may cause the formation of polypeptide complexes with a different functional efficiency.
Fig. 4 Human mitochondrial genome. Human mitochondrial genome has two strands, a guanine-rich heavy
(H) strand and a cytosine-rich light (L) strand. MtDNA contains thirty-seven genes. Twenty-four encode for the translational machinery of the mtDNA (22 tRNAs, in violet and 2 rRNAs in blue). The remaining 13 genes encode subunits of the OXPHOS system: ND1–6 and NDL4 for complex I (NADH dehydrogenase); cyt c for complex III (bc1 complex); COI-III for complex IV(cytochrome c oxidase); ATPase 6 and 8 for complex V (ATP synthetase). MtDNA is replicated from two origins: the origin of replication of the H-strand (ori H) and the origin of replication of the L-strand (ori L).
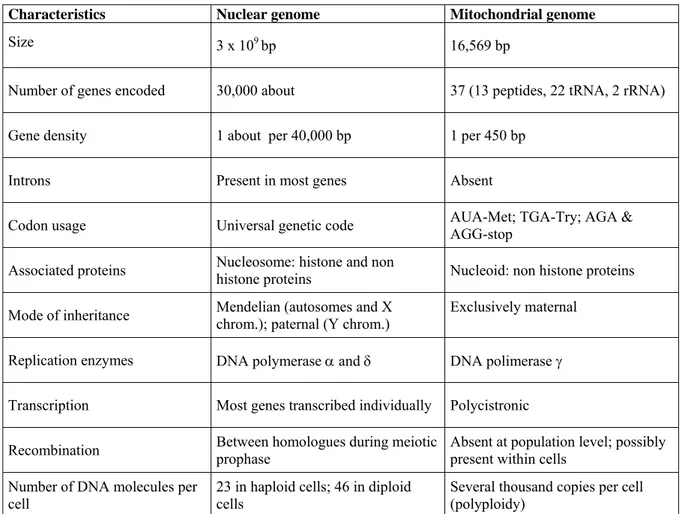
The mitochondrial genome has characteristic features with respect to the nuclear genome as summarized in Table 1.
Characteristics Nuclear genome Mitochondrial genome
Size 3 x 10⁹ bp 16,569 bp
Number of genes encoded 30,000 about 37 (13 peptides, 22 tRNA, 2 rRNA) Gene density 1 about per 40,000 bp 1 per 450 bp
Introns Present in most genes Absent
Codon usage Universal genetic code AUA-Met; TGA-Try; AGA & AGG-stop Associated proteins Nucleosome: histone and non histone proteins Nucleoid: non histone proteins Mode of inheritance Mendelian (autosomes and X chrom.); paternal (Y chrom.) Exclusively maternal
Replication enzymes DNA polymerase α and δ DNA polimerase γ Transcription Most genes transcribed individually Polycistronic
Recombination Between homologues during meiotic prophase Absent at population level; possibly present within cells Number of DNA molecules per
cell
23 in haploid cells; 46 in diploid cells
Several thousand copies per cell (polyploidy)
Table 1. Human nuclear and mitochondrial genomes (modified from Taylor and Turnbull, 2005)
High mutation rate (chiefly caused by the paucity of repairing systems), maternal inheritance (with consequent lack of recombination), and intracellular polyploid arrangement concur to generate an extreme mtDNA variability both at germinal (inherited variability) and somatic level (epigenetic variability). The literature on mtDNA variability is impressive, and a review on this topic would be out of the aims of the present PhD thesis. In any case, information can be found in many web sites the major ones are listed at the end of the “References” section. Shortly, mtDNA inherited variability implies both mutations (rare variants) and polymorphisms (common variants). Mutations cause mitochondrial diseases, which are
characterized by a large variability of pathological phenotypes and their severity (Taylor and Turnbull, 2005). As for the common variability, most of the studies have been developed in the frame of population genetics. Therefore, they have been focused on evolutionary conserved mtDNA positions, occurring both in the coding region and in the D-loop HVS-I and HVS-II regions. Due to the absence of recombination at population level (Table 1), specific polymorphisms tend to be associated along the mtDNA molecule, thus defining mtDNA haplotypes. By analyzing mtDNA polymorphisms in a number of populations, clusters of haplotypes have been recognized (haplogroups) that display a continent specific distribution (Torroni et al., 1996; Finnila et al., 2001; Herrnstad et al., 2002; Silva et al., 2002; Kong et al., 2003). More recently, an increasing number of studies have begun to use complete mtDNA sequences for phylogenetic analyses (Ingman et al., 2000; Finnila et al., 2001; Maca-Meyer et al., 2001; Herrnstad et al., 2002; Tanaka et al., 2004; Coble et al., 2004; Kivisild et al., 2006), thus allowing a better resolution of the mtDNA haplogroups structure. For instance, a detailed phylogenetic analysis of haplogroup H showed that this haplogroup can be divided into 20 subhaplogroups whose distribution is very different in the different European regions (Achilli et al., 2004; Roostalu et al., 2006).
Historically, mtDNA common variability has been investigated for reconstructing genetic relationships among human populations, as well as their routes of expansion across the continents. Such studies were founded on the assumption that mtDNA inherited polymorphisms are neutral (or almost neutral), that is they do not affect significantly the mitochondrial machinery, and therefore the individual fitness. More recently, evidences have been provided suggesting that mitochondrial mutations are not always neutral and that genes in mtDNA evolve at different rates due to different functional constrains (Mishmar et al., 2003; Moilanen et al., 2003; Moilanen and Majamaa, 2003; Kivisild et al., 2006). The evidence of non neutrality of mtDNA variability has led to the idea of a mitochondrial
paradigm for metabolic and degenerative diseases where mtDNA common variability would
play a role (Wallace 2005). This view is in agreement with the observation that mtDNA polymorphisms correlate with longevity (Tanaka et al., 1998; De Benedictis et al., 1999; Ross et al., 2001; Niemi et al., 2003) although such a correlation is population specific (Dato et al., 2004).
The studies on the influence of mtDNA on degenerative and age-associated diseases have highlighted the importance of heteroplasmy, that is the intra and inter-cell mtDNA variability. This condition can be inherited or acquired through somatic mutation that can occur due to epigenetic phenomena. The inheritance of heteroplasmy is limited by replicative segregation, the random drift of mtDNA molecules during oogenesis. In addition, an important process called “atresia” , the death of most female germ cells before fertilization, has been proposed to be responsible for elimination of germ cells carrying deleterious mitochondrial genomes (Krakauer and Mira, 1999). Since somatic mutations are stochastic events, acquired heteroplasmy tends to increase with age, and becomes particularly important in stable tissues characterized by high metabolic rates, such as neurons, muscle cells and so on. Usually, a low level of heteroplasmy does not impair the mitochondrial function, but once the level of mutant mtDNA exceeds a certain threshold, OXPHOS dysfunction may arise. This threshold is lower in post-mitotic tissues characterized by high metabolic rate and strong OXPHOS requirement (DiMauro and Schon, 2003; DiMauro and Davidzon, 2005).
Most of the literature on mtDNA heteroplasmy reports data on the role played by such a phenomenon on age-related diseases, but recent findings open a new perspective. Zhang et al. (2003) carried out a large-scale screening of the mtDNA main control region in leukocytes from centenarians and younger controls (Fig. 5).
Fig. 5. Positions of the tissue-specific aging-dependent somatic mutations identified in human mtDNA main control region. OH1 and OH2, primary and secondary origins of H-strand synthesis; LSP, promoter for
transcription of L-strand and synthesis of primer for H-strand synthesis; CSB1, CSB2, and CSB3, conserved sequence blocks 1, 2, and 3. The positions of binding of mitochondrial transcription factor A (mtTFA; the densely hatched rectangle indicates a position of high-affinity binding) are shown. Blue arrows and numbers indicate fibroblast-specific mutations, red arrows and numbers indicate skeletal muscle-specific mutations, and the green arrow and number indicate the C150T transition (Zhang et al., 2003).
They found that the C150T mutation is significantly more represented in centenarians than in younger controls, and provided evidence that somatic events, probably under nuclear genome control, contribute to the striking selective accumulation of this mutation in centenarians. In the same study, by using fibroblast longitudinal studies, the authors showed an age-related somatic expansion of the mutation up to homoplasmy. Finally, 5’ end analysis of nascent heavy mtDNA strands revealed a new replication origin at position 149, substituting for that at 151, only in fibroblasts or immortalized lymphocytes carrying the C150T mutation. On the whole, the data showed that a high level of heteroplasmy, possibly up to a new homoplasmy
arrangement, may be favorable for longevity, if the mutation gives rise to a new replication origin, thus restoring the efficiency of the mitochondrial machinery.
The study by Zhang et al. (2003) has opened a new road in exploring the role of mtDNA heteroplasmy in human aging. For this reason, it seemed very interesting to check this unexpected finding in a larger study properly designed to answer the following question: does C150T heteroplasmy contributes to longevity? A direct answer to the question would require a longitudinal study where a cohort of individuals is followed up to the extinction, and mtDNA heteroplasmy examined across the time. Of course, such an approach is very expensive and difficult to realize. We tried to overcome this problem by comparing heteroplasmy between age-matched groups of individuals characterized by different degrees of relationship with centenarians. As longevity shows familial aggregation (Cournil and Kirkwood, 2001; Hjelmborg et al., 2006), the idea was to compare mtDNA heteroplasmy of the control region encompassing the C150T mutation (CR-mtDNA) in a group of descendants of unrelated centenarians (offspring and nieces/nephews) with mtDNA heteroplasmy in age-matched unrelated controls. If the level of heteroplasmy in the first group was found to be higher than in the latter group, we may infer that CR-mtDNA heteroplasmy concurs to longevity. However, to realize the study we needed a fast, sensitive and reliable method for quantifying heteroplasmy in large population samples. Indeed, although several methods are reported in literature, these are chiefly focused on the study of pathologies where the levels of heteroplasmy are quite high, and the number of cases quite small. We tried to overcome these problems by setting up an original protocol of DHPLC.
1.4 DHPLC for quantifying CR-mtDNA heteroplasmy
Denaturing-high-performance liquid chromatography (DHPLC) is a powerful tool for analyzing DNA variability (reviewed by Xiao and Oefner, 2001). DHPLC analysis is based on the following principle: if a PCR product contains a mixture of wild-type and mutant DNA, heat denaturation followed by renaturation of the amplified fragment will allow not only reannealing of the perfectly matched fully complementary strands (homoduplex), but also the formation of a heteroduplex, which has a pair of non-matching bases (mismatch) at the mutant position. Since the nucleotide mismatch reduces the thermodynamic stability of double stranded DNA, heteroduplexes have a lower melting temperature than homoduplexes. At a certain temperature, homoduplexes are still double-stranded, while heteroduplexes are already partially denatured. At that temperature, the two DNA species can be separated because of their different binding to the DHPLC column. The difference in melting temperature between homo- and heteroduplexes is strongly dependent on the nucleotide sequence of the respective DNA fragment. Therefore, DHPLC conditions (including length of the DNA fragment) must be chosen carefully in order to favor large differences in melting temperatures, so that all possible point mutations are detected. In the absence of heteroplasmic mutations, the chromatogram will show the single homoduplex peak, whereas heteroplasmy will produce two peaks at least, the first containing heteroduplex the latter homoduplex molecules. In the case of a low percentage of a heteroplasmy, heteroduplexes are represented as a “shoulder” in the peak.
Recently DHPLC has been successfully applied to the study of mtDNA heteroplasmy, and methods have been proposed for a rapid screening of the entire mtDNA molecule (Meierhofer et al., 2005; Biggin et al., 2005; Wulfert et al., 2006). However till now this technique has never been applied to genetic population studies aimed at comparing the levels of heteroplasmy between large population samples. In this case a precise and reliable method of
quantification is required. To realize this goal, we set up a DHPLC reference curve that used mtDNA cloned fragments in which the proportion of wild/mutant clones varied from 0% to 50%. Each of the 414 biological samples under study was then submitted to DHPLC and the level of heteroplasmy was quantified on the reference curve (see Materials and Methods).
2. Aim of the work and experimental design
The D-loop region, although non coding for RNAs or proteins, has a pivotal role in mitochondrial biology because it contains functional elements crucial for mtDNA replication and transcription (see Introduction, Fig. 4). Starting from the observation that heteroplasmy relevant to the C150T mutation is consistently higher in centenarians than in younger controls, and that this mutation accumulates in aged cultures of fibroblasts (Zhang et al., 2003), we wished to verify if this phenomenon is a consequence of extreme aging or rather a factor predisposing to longevity, as suggested by the same authors.
We reasoned that the study of such a mutation in relatives of centenarians could help to answer the question. In fact, if the accumulation of C150T mutation was a consequence of aging, offspring (and nieces/nephews) of centenarians were expected to have levels of heteroplasmy not different from those of unrelated age-matched controls. On the contrary, if heteroplasmy contributes to the familial longevity, offspring (and nieces/nephews) of centenarians were expected to have levels of heteroplasmy more similar to those of their oldest relatives than those of age-matched controls.
We took advantage of a large population sample collected in the frame of a European research project (ECHA project, http://biologia.unical.it/ECHA/) aimed at investigating genetic and environmental factors affecting aging across Europe. According to the project, trios composed
by one centenarian (the proband), his/her child, his/her niece/nephew have been collected in Calabria (southern Italy). Unrelated subjects, who were sex- and age-matched with the relatives of the probands, were also collected in the same geographic area. We used these population samples for verifying if the high levels of C150T heteroplasmy were a debris consequent to extreme aging or, alternatively, a factor predisposing to longevity.
3. Results and Discussion
3.1 Quantification by DHPLC of CR-mtDNA heteroplasmy levels
As anticipated in the Introduction, the problem was to set up a fast and reliable method for quantifying by DHPLC the levels of CR-mtDNA heteroplasmy in a large population sample. We tackled this problem by assembling a DHPLC reference curve that used different proportions of wild/mutant clones of CR-mtDNA fragments. In particular, first we mixed wild (150C) and mutant (150T) clones to produce a series of mutant loads between 5% and 95% (0% C with 100% T; 5% C with 95% T; 10% C with 90% T; 20% C with 80% T; 30% C with 70% T; 40% C with 60% T; 50% C with 50% T). Then we submitted each mix to PCR amplification (and subsequent control-sequencing) thus creating artificial samples that had controlled conditions of C150T heteroplasmy. Lastly, we submitted to DHPLC each artificial sample and measured the ratio between heteroplasmic (Het) and total (Tot) molecules according to the formula
[Het / Tot]n = Het / (Het + Hom)
An example of such measures is shown in Fig. 6 (5% C with 95% T artificial sample).
Fig. 6 Example of heteroplasmy quantitation by measuring [Het / Hom + Het]n in the 5% C with 95% T
artificial sample. The x-axis shows DHPLC elution time in minutes and the y-axis shows DNA concentration as
measured in milliVolts (mV) by optical density at 260 nm in arbitrary units. Both height of the heteroduplex peak (Het) and height of the homoduplex peak (Hom) were determined by using WAVEMAKER 4.0 software (Transgenomic San Jose).
mV
Het =7,08
Hom =65,10
The reference curve was then assembled by reporting the ratio [Het / Tot]n as a function of
the level of heteroplasmy, which varied according to the proportion between the two categories of cloned plasmids. The reference curve is shown in Fig. 7, where each point represents the mean value, with standard deviation, of three independent DHPLC assays.
Fig. 7 DHPLC reference curve assembled by mixing variable proportions of wild (C150) and mutant (T150) clones of CR-mtDNA (nt16531–nt261). The two clones were mixed to generate samples having
heteroplasmy levels of 0%, 5%, 10%, 20%, 30%, 40%, 50 %. Het/Tot is the ratio between the height of the Heteroplasmic peak and the Total height of homoplasmic plus heteroplasmic peaks. Bars indicate the standard deviation in triplicate independent experiments. A 2nd degree polynomial function y = β0 + β1x + β2x2 was used
to fit DHPLC data of the 7 generated artificial heteroplasmic samples.
Before analyzing the population sample, we wished to have information on the sensitivity of our DHPLC method. To this purpose, we submitted to sequence analysis the artificial samples used to assemble the curve shown in Fig. 7, and compared DHPLC profiles with sequence data. The results are shown in Fig. 8.
Fig. 8 Sensitivity of DHPLC and sequencing in revealing heteroplasmy. DHPLC analysis of heteroplasmy
due to C150T mutation (on the left) is compared with the sequence profile of each sample (on the right). The arrow indicate the 150 position on the sequencing profile.
It can be seen that in absence of heteroplasmy, the DHPLC chromatogram shows only a single homoduplex peak, whereas the presence of heteroplasmy produces two peaks at least, the first one representing the heteroduplex and the second one the homoduplex (Fig. 8 on the left). Moreover, as expected, the height of the heteroduplex peak increased proportionally to the increase of the percentage of heteroplasmy. By comparing DHPLC profiles and sequence data, we observed that DHPLC was able to reveal up to 5% of heteroplasmy (the DHPLC profile of the 5% mutant load is clearly distinguishable from the wild-type, Fig. 8 on the left) while the minimum level of heteroplasmy detectable by sequence analysis was 20% about (Fig. 8 on the right).
On the whole, our DHPLC methodology resulted reliable (see standard deviations in Fig. 7) and quite sensitive (see Fig. 8). Therefore, it was appropriate for screening a large population sample.
3.2 CR-mtDNA heteroplasmy in centenarians, their relatives, and unrelated controls.
The next step in our work was to apply DHPLC analysis to 4 population samples: (a) Calabrian centenarians, (b) offspring of the centenarians, (c) nieces/nephews of the centenarians, (d) subjects unrelated with the centenarians, but with Calabrian ancestry and age/sex matched to samples (b) and (c).
The mtDNA region under study (nt 16531 – nt 261) was PCR amplified from each of the 414 DNA samples, checked by electrophoresis and submitted to DHPLC. Then the reference curve shown in Fig. 7 was used to quantify heteroplasmy in each sample. The results obtained in the four sample groups are summarized in Fig. 9 that shows the distribution of the levels of heteroplasmy in centenarians (a), offspring and nephews/nieces of centenarians (b and c, respectively), and controls (d).
Fig. 9 Histograms showing CR-mtDNA heteroplasmy in the four sample groups. Heteroplasmy percentages
are estimated on the DHPLC reference curve of Fig.7.
By looking at the percentage of subjects having levels of heteroplasmy lower than 2.5% in the four sample groups (Fig. 9) we found that such percentages were 15% in centenarians, 13% in their children, 19% in nephews/nieces of centenarians and 36% in controls. Therefore, by this approach, not only we confirmed that centenarians having low levels of heteroplasmy are
quite rare, in agreement with Zhang et al.. (2003), but also discovered that the same occurs in relatives of centenarians in comparison with age-matched controls.
We checked the statistical significance of the difference observed in Fig. 9
Results showed that centenarians differed from younger controls (p=0.001) but not from their relatives (p=0.70 vs children; p=0.94 vs nephews/nieces). Likewise, no difference was observed between children and nephews/nieces of centenarians (p=0.67). Finally, the comparison between age-matched groups revealed that heteroplasmy differed either between offspring of centenarians and controls (p=0.006) and between nephews/nieces of centenarians and controls (p=0.003).
On the whole, the results reported in Fig. 9 show that CR-mtDNA heteroplasmy runs in families where longevity runs. Thus, the high levels of heteroplasmy observed in centenarians by Zhang et al. (2003) are not a consequence of their oldest age; instead, the presence of heteroplasmic mutations in this mtDNA region likely concurs to the longevity phenotype. The above findings strongly suggested that the levels of CR-mtDNA heteroplasmy are under genetic control. The question was: which genome is involved in such a genetic control ?
3.3 Contribution of mtDNA inherited variability to the genetic control of CR-mtDNA heteroplasmy
To answer the above question we adopted two strategies. First, we verified if the patterns of heteroplasmy were different between the offsprings of male and female centenarians; second, we carried out a complete haplogroup/haplotype screening in both centenarians and younger controls searching for a possible correlation between inherited and epigenetic mtDNA variability.
As for the first approach, we partitioned the group of centenarians’ children according to the sex of the centenarian parent, and evaluated if the levels of CR-mtDNA heteroplasmy did differ between the groups. Fig. 10 shows the distribution of the levels of heteroplasmy in offspring of male (a) and female (b) centenarians. Such distribution is clearly not normal. To verify if the distributions in panels (a) and (b) were different, we applied a non parametric two sided Mann-Withney-U test. We obtained p= 0.029, thus rejecting the null hypothesis of homogeneity between (a) and (b) samples. This result could be explained by two alternative hypotheses:
1. the nuclear genome affects the occurrence/accumulation of CR-mtDNA heteroplasmy according to the sex of the centenarian parent.
2. the variability of the mitochondrial genome affects the occurrence/accumulation of CR-mtDNA heteroplasmy through a maternal inheritance.
Offspring of male centenarians
Offspring of female centenarians
Fig.10 Histograms showing CR-mtDNA heteroplasmy in the Offspring of male centenarians (a) and offspring of female centenarians (b). Heteroplasmy percentages are estimated on the DHPLC reference curve
By looking at Fig.10, we observed that subjects having heteroplasmy higher than 5% were more frequent in offspring of male centenarians than in offspring of female centenarians (69.8% versus 46.8%, respectively). Therefore, the different distributions shown in Fig.10 suggested that the nuclear genome of male centenarians predisposes the offspring to high mtDNA heteroplasmy more than the nuclear genome of female centenarians. This result was in line with hypothesis (1) suggesting a sex specific phenomenon. This might be explained by genomic imprinting or by the phenotypic selection, considering that male centenarians are more selected than female centenarians.
To further explore this question we analyzed mtDNA inherited variability in centenarians and controls both by haplogroup analysis and by sequencing the mtDNA region under study. In fact, if a correlation did exist between mtDNA inherited and epigenetic variability, heteroplasmic mutations were expected to be differently distributed in the haplogroup/haplotype pools of centenarians and controls.
Table 2 reports the results of the analysis we carried out in centenarians and controls to cheek the correlation between haplogroups and epigenetic variability.
Centenarians Controls MtDNA Haplogroup N° of subjects N° of heteroplasmic subjects N° of subjects N° of heteroplasmic subjects H 35 15 34 10 I 2 2 0 0 J 11 8 17 7 K 10 6 16 6 T 6 3 10 3 U 13 7 11 4 V 1 1 1 0 W 2 1 4 3 X 9 8 5 3 Others 11 4 16 11 Total 100 55 114 47
Table 2. Inherited and epigenetic mtDNA variability. The number of subjects classified within a specific
haplogroups is reported togheter with the number of heteroplasmic subjects within each haplogroup category. MtDNA that were non-classifiable within a haplogroup were grouped as “Others” (Torroni et al., 1996).
We found by permutation tests (Weir, 1996) that the distribution of heteroplasmic subjects within haplogroup categories was not significantly different both in centenarians and controls (p>0.2).
Furthermore, by sequencing the region under study (nt 16531 – nt 261) in centenarians and controls, we confirmed the independence between inherited and epigenetic variability at
haplotypic level. Table 3 reports sequence data and number of heteroplasmic subjects screened in the two groups.
In addition, by assuming as inherited the variant whose sequence peak was higher than 80%, we compared the pools of haplotypes between centenarians and controls. By applying permutation tests we did not find significant difference between the groups (p>0.2).This ruled out the possibility that the high heteroplasmy in centenarians were due to one or a few haplotypes particularly prone to somatic mutations.
On the whole, the analysis of heteroplasmy in offspring of centenarians (Fig. 10), as well as the analysis of haplogroups (Table 2) and haplotypes (Table 3) consistently showed that CR-mtDNA heteroplasmy was under the control of the nuclear genome. This finding was perfectly in line with results showing that the levels of CR-mtDNA heteroplasmy are significantly more concordant in MZ than DZ twins (Zhang et al., 2003).
In summary, the CR-mtDNA heteroplasmy, as revealed by a quantitative DHPLC protocol set up on the C150T mutation, is higher in centenarians and their descendants than in controls who are sex- and age-matched with the latter. According with these findings, the C150T mutation is not a debris accumulating with aging, but a mutation which favors longevity. Both the fact that the C150T mutation originates a new mtNA replication site (Zhang et al., 2003) and the complementation consequent to the mitochondrial network dynamics could account for the significant association between CR-mtDNA heteroplasmy and longevity.
Table 3. Variant sites found in mtDNA CR (nt16531 – nt261). For each haplotype the absolute frequency in centenarians (A) and controls (B) is reported. The number of subjects
showing DHPLC heteroplasmy is reported in parenthesis. rCRS refers to the revised Cambridge Reference Sequence (MITOMAP: A Human Mitochondrial Genome Database.
http://www.mitomap.org, 2006). Nt 20 55 57 64 72 73 93 114 143 146 150 151 152 153 182 185 188 189 191 194 195 198 199 200 204 207 217 225 226 227 228 235 239 rCRS A T T C T A A C G T C C T A C G A A A C T C T A T G T G T A G A T A B 27(14) 18(3) - - - G - - - - -2 (1) 0 - - - - C - - - -3 (3) 0 - - - - - G - - - - A G - - - A - -21(8) 24(6) - - - -5 (3) 7 (4) - - - C - - - -1 (0) 0 - - - - G - - - - C - - - -1 (1) 2 (0) - - - G - - - - T - - - C - - - -1 (1) 0 - - - - G -1 (1) 0 - - - - - G - T - - - -1 (1) 7 (6) - - - G - - - - C - - - -1 (1) 0 - - - - - G - - - - T - - - G - - - -1 (1) 0 - - - - - G - - - C - - - G - - - C - - - A C - - - -4 (4) 7 (1) - - - G - - - - C - - - -1 (1) 0 - - - - - G - - A - - - C - - - A C - - G -1 (1) 2 (0) - - - G - - - - T - - - -1 (0) 0 - - - - A - -2 (2) 0 - - - - - G - - - - - T C - - - -3 (1) 2 (2) - - - G - - - - A - - - A - -1 (0) 0 - - - - G - - - -1 (0) 0 - - - - - G - - - - G - - - C - - - A C - - - -1 (0) 0 - - - - - G - - A C - - C - - - C - - - -2 (1) 0 - - - - G - - -
-1 (1) 6 (5) - - - G - - - - T - C - - - -1 (1) 0 - - - T - G - - - - G - - - C - - - A C - - - -1 (0) 0 - C C - - - C - - - -2 (1) 0 - - - - T - - - C 2 (0) 7 (1) - - - C - - - -1 (1) 0 - - - - T - - - -1 (0) 0 - - - T - - - C - - - -1 (1) 0 - - - - - G - - - C - - - G - - - C - - - A - G - - -1 (1) 2 (2) - - - G - - - - C - - - C - - - -1 (1) 0 - - - - - G - - - - G - - C - - - C A - - - -1 (1) 0 - - - - C - G - - - T - - - C T - - - -1 (1) 4 (2) - - - G - - - C T - - - -1 (1) 0 - - - - - G - - - - T - - - -1 (0) 1 (0) - - - G - - - C - - - -1 (1) 0 - - - - - G - - - - T - - - C - - G - - - -0 2 (1) - - - - C - - - T - - - C - - - -0 1 (0) - - - G - - - - A - G - - - A - -0 1 (0) - - - - C - - - T - - - -0 3 (3) - - - G - - - - C - - A G - - - -0 1 (1) - - - C - - C - - - -0 1 (1) - - - G - - - - -0 1 (1) T - - - -0 5 (2) - - - G - - - C - - - C - - - -0 2 (1) - - - G - - - C - - C - - - -0 1 (0) - - - T C - - - C - - - -0 1 (0) - - - G - - - - A - - G - - - A - -0 1 (0) - - - - C - - - T - - - -0 2 (2) - - - G - - - - T - C - - - C - - - -0 1 (1) - - - G - - - - G - T C - - - -0 1 (1) - - - G - - - - G - - - -0 1 (1) - - - G - - - C T - C - - -
-In any case, the independence between CR-mtDNA heteroplasmy and mtDNA variability (Tables 2 and 3) shows that the nuclear genome drives the occurrence/accumulation of such a heteroplasmy. What kind of nuclear genes may be responsible for these findings? On the basis of the previous considerations (Introduction, chapter 1.1), it would be interesting to verify in future studies if some relationship does exist between the accumulation of the C150T mutation and qualitative or quantitative variants of dynamin genes.
3.4 The role of the C150T mutation in longevity
As remarked in the Introduction, our main interest was to study the C150T somatic mutation in relationship to aging and longevity. Therefore, the DHPLC experimental conditions used for assembling the reference curve of Fig. 7 had been set up by means of CR-mtDNA cloned fragments that only differed at the C150T position. Of course, when we dealt with biological samples, we could not exclude that the observed DHPLC patterns of heteroplasmy were due to other heteroplasmic sites. To make clear this point, first of all we carried out a careful visual inspection of every DHPLC profile in centenarians, their offspring, and controls. We observed that, although most of the profiles (more than 60%) had shapes comparable with those shown in Fig. 8, alternative profiles were present, suggesting the presence of different/further mutations in the analyzed region. Then, in order to match the molecular basis of heteroplasmy with the DHPLC profile, we compared DHPLC profile and sequence data whenever possible (requirement: heteroplasmy 25% at least, see Fig. 8).
Out of 16 samples satisfying the requirement, we recognized the six profiles reported in Fig. 11, where also the corresponding heteroplasmic mutations are shown.
Fig. 11 DHPLC profiles and sequence analysis in the samples having levels of heteroplasmy equal to or higher than 25%. The sequence which characterizes each profile is shown on the right
Table 4 summarizes the proportion of different mutations found in centenarians, their offspring and controls.
Mutations G62A T146C C150T T152C G189A Centenarians 1 1 4 1 Offspring of centenarians 1 4 1 Controls 2* 2* 1
* Two subjects are heteroplasmic for both T146C and C150T mutations.
Table 4. Heteroplasmic sites identified by sequence analysis of CR-mtDNA in subjects showing DHPLC heteroplasmy higher than 25%. The number of subjects showing the specific mutation is
Although the number of screened subjects is too small for drawing any conclusion, some comments can be done. First, the C150T somatic mutation is present in 4 out 7 centenarians and in 4 out 6 offspring of centenarians. By considering that the C150T mutation could provide a new mtDNA replication origin (Zhang et al., 2003) this finding is encouraging for the hypothesis that it concurs to the familial aggregation observed for the longevity trait. The mutation is also present in controls, but in association with the T146C mutation. We could speculate that in this arrangement, the C150T mutation is not able to restore a new replication site. Of course, this is only a hypothesis that requires to be verified by appropriate experiments (for example mtDNA
in vitro syntheses). Second, it is unexpected that the T152C mutation which is reported
as a mutation hotspot (Pesole and Saccone, 2001) is not found in centenarians. The T152C mutation was found to be over-represented in AD brains (Coskun et al., 2004); however the numbers in Table 4 are too small to conclude that centenarians are in some way protected against this mutation, although the observation is interesting and deserves further investigation.
4. Concluding remarks
Historically, mtDNA heteroplasmy has been always regarded as a detrimental phenomenon which increases with age and, beyond a certain threshold, becomes deleterious for mitochondrial function, chiefly in stable tissues characterized by high metabolic rate. Therefore, it was quite surprising to discover that leukocytes of centenarians, who are usually regarded as a “winning” segment of population, displayed high levels of CR-mtDNA heteroplasmy (Zhang et al., 2003). Of course, such high levels could arise from their extreme aging, but some insights prompted us to further explore the significance of the above result: i) the finding that the C150T mutation originates a new replication site; ii) the finding that the levels of CR-mtDNA heteroplasmy were more concordant in MZ than in DZ twins, thus suggesting a nuclear genetic control on this epigenetic phenomenon (Zhang et al., 2003).
The histograms of Fig. 9 clearly show that the patterns of CR-mtDNA heteroplasmy in relatives of centenarians are much more similar to those of centenarians than to those of sex- and age-matched unrelated subjects. In fact statistical analyses showed that no difference does exist between centenarians and offspring or nieces/nephews, while a significant difference exists between relatives of centenarians and age-matched controls. This finding implies that the occurrence/accumulation of CR-mtDNA heteroplasmy is, at least in part, under genetic control. Furthermore, the observation that CR-mtDNA heteroplasmy is independent of inherited mtDNA variability (Tables 2 and 3) indicates that not mitochondrial but nuclear genes are involved in the above control.
These unexpected findings may be explained in the light of homeostatic cell reactions by which the nuclear genome would push the mitochondria to accumulate an mtDNA mutation (C150T) that provides a new replication site to the mitochondrial genome. However, the biological basis of the high heteroplasmy observed in centenarians and their descendants may also involve complementation phenomena that compensate the detrimental load of mtDNA molecules harboring different mutations by means of the mitochondrial dynamic network. In such a case, beneficial variables (qualitative or quantitative) of dynamin genes would be responsible for the high levels of CR-mtDNA heteroplasmy. This hypothesis could be tested in our collection of population samples, and this may be a next step in our research.
In any case, the results here presented open new avenues for exploring the relationships between mitochondria and aging.
5. Materials and Methods
5.1 Population samples
A total of 414 subjects were analyzed: 100 trios composed by one centenarian, his/her child, his/her nephew/niece plus a control group of 114 unrelated subjects lacking of centenarians in their family (Table 5).
All the subjects were born and living in Calabria (southern Italy) and their Calabrian ancestry had been ascertained up to the grandparents generation. The sampling was carried out in the frame of the ECHA research project (see http://biologia.unical.it/ECHA/ where details on criteria of recruitment and further information are reported). All the subjects had provided written informed consent for using their phenotypic and genetic data in studies on human aging.
Sample
Males Females Total
Centenarians 53 47 100
Median age (yrs) 99,0 100,0 100,0
Offspring of centenarians 42 58 100
Median age (yrs) 70,0 70,0 70,0
Nephews/Nieces of
centenarians 51 49 100
Median age (yrs) 71,0 70,0 70,0
Controls 50 64 114
Median age (yrs) 68,5 72,0 71,0
5.2 DNA extraction
Five-six microliters of blood were drawn from each recruited subject and aliquoted in Falcon sterile tubes with EDTA to avoid coagulation. Ten microliters of STE buffer were added to each sample. STE composition was:
• NaCl 0,1 M
• Tris-HCl 0,1 M (pH= 8) • EDTA 0,001 M (pH= 8)
Then the sample was centrifuged at 4000 rpm for 20 min at 4°C. This causing separation of three phases: a yellow superior phase that contains the serum; a red low phase that contains erythrocytes and an intermediate phase characterized by a fine white layer, defined “buffy coat”, that contains leucocytes. By using a sterile pasteur, supernatant was gently removed in order to easily draw the buffy coat; this was immediately resuspended in an equal volume of STE buffer and again centrifuged at 4000 rpm for 20 min. The buffy coat that was picked up and freezed at -20°C.
The following phase consisted in DNA extraction from buffy coats. This was performed by using the protocol provided by S.T. Warren, Department of Biochemistry &
pediatrics, Emory University School of Medicine (Atlanta, USA).
Buffy coat was defrozen and resuspended in an equal volume of sterile erythrocytic
lysis buffer constitued by:
• NH4Cl 155 mM • KHCO 10 mM • EDTA 0.1 mM
After preservation in ice for 10 min, the sample was centrifugated at 2500 rpm for 5 min at 4°C. Subsequently, the supernatant was removed and the remaining pellet was resuspended in 3 ml of sterile buffer A, consisting of:
• Tris-HCl 10 mM (pH= 8) • NaCl 400 mM
• EDTA 2 mM (pH= 8)
The mixture was manually shaked and then added with:
• 100 µl of 20%SDS
• 1 ml of K proteinase (1mg/ml concentration)
Sample was gently shaked and then incubated over-night at 37°C. The following day, 1 ml of 6M NaCl saturated solution was added and vigorously shaked for 15 sec. Subsequently, the mixture was centrifugated at 2500rpm for 20 min at 4°C. The supernatant containing DNA was transferred into a Falcon sterile tube and added with an equal volume of isopropanol wich caused DNA precipitation. Subsequently, by using a sterile hooked pasteur, DNA was recovered and washed in 700 µl of a 70% ethanol (EtOH) solution. Finally, DNA was resuspended in a volume of sterile TE buffer proportional to the DNA extracted amount. TE buffer consisted of:
• Tris-HCl 0.01 M (pH= 8) • EDTA 0.001 M (pH= 8)
The extracted DNA was incubated for 5-6 hours at 37°C and then preserved at 4°C for the following analyses.
To measure the DNA concentration (expressed in ng/µl) we used a DNA Fluorometer
TKO 100 (Hoefer Scientific Instruments). The DNA Fluorometer was tared by a
standard solution at known concentration (250ng/µl DNA extract by calf thymus cells). Two microliters of each DNA sample were drawn and placed in a cuvette containing 2 ml of a buffer TNE plus Poison solution. Poison is a fluoroscent compound that binds DNA favouring the DNA concentration measure.
5.2.1 PCR amplification
A 300 bp region of mtDNA encompassing the C150T site (region 16531-261) was amplified by AATAGCCCACACGTTCCCCTTA-3’ forward primer and 5’-GCTGTGCAGACATTCAATTG -3’ reverse primer (0.4 µM each) in a final volume of 25 µl, containing 100 ng DNA, 1.5 mmol/L MgCl2, 200 µmol/L of each dNTP, and 1U of EuroTaq DNA polymerase (EuroClone). Amplification was performed in a Perkin Elmer Cetus 9600 PCR system. The amplification conditions were as follows: initial denaturation at 93°C for 30s, followed by 35 cycles at 93°C for 15s, 64°C for 20s, 72°C for 1 min. PCR products were checked by 2% agarose gel electrophoresis in TBE buffer with ethidium bromide.
5.3 Molecular cloning
The PCR products containing common (C150) and mutant (150T) sequences were cloned by using the pGEM-T Easy Vector Systems (Promega), a system for the TA cloning of PCR products. The high-copy-number pGEM-T Easy Vector is already cutted with EcoR V and provided of a 3´ terminal thymidine to both ends. These single 3´-T overhangs at the insertion site greatly improve the efficiency of ligation of a PCR product into the plasmids by preventing recircularization of the vector and providing a
compatible overhang for PCR products generated by Taq DNA polymerases.
The PCR products with common (C150) and mutant (150T) sequences were ligated to
pGEM-T Easy Vector in two reactions each containing:
• 5µl of 2X Ligation Buffer, T4 DNA Ligase • 1µl of pGEM-T Easy Vector (50 ng) • 1µl of PCR product (100 ng)
• 1µl T4 DNA Ligase (3 units)
• deionized water to a final volume of 10µl
The two reactions were mixed by pipetting and incubated for 1 hour at room temperature. For each reaction, a positive control that did not contain the PCR product was carried out too. Then, the ligation reactions were transformed into Top10 E. coli cells by electroporation. First, we got electrocompetent cells ready. To this pourpose, 300 ml of L-Broth (1% Bacto-Tryptone, 0.5% Bacto-yeast extract, 0.5% NaCl) containing streptomycin (50 µg/ml) were inoculated with 6 ml of a overnight Top10 E.
coli cell culture and incubated on a rotary shaker at 37°C. The cell growth was
monitored by photometer measuring the optical density at 600 nm (OD600)every 45min-1hr. When the OD600 value was equal to about 0.6 (log phase growth), the cells were
removed from the shaker and placed on ice. Then the cells were centrifuged twice subsequent at 4000 rpm for 15 min at 4°C. and the pellets were gently resuspended in decreased volume of ice-cold sterile water (300 ml and 150 ml respectively). Again the cells were centrifuged at 4000 rpm for 15 min at 4°C. The supernatants were removed and the pellets were resuspended in 6 ml of ice-cold 10% sterile glycerol. The, the cells were centrifuged at 4000 rpm for 15 min at 4°C. The pellets was resuspended in 600 µl of ice-cold 10% glycerol. 20 µl aliquots of cells were prepared in pre-chilled 1.5ml eppendorf tubes.
20 µl of the electrocompetent cells and 2 µl of each ligation mixture were transferred in the 0,2 cm cuvette BIORAD and immediately electroporated at 250 kV, 25 µF, 200 ohms (Dower W.J. et al., 1988). 480 µl of liquid Luria-Bertani medium (LB) (1% Bacto-Tryptone, 0.5% Bacto-yeast extract, 1% NaCl) were added. Then the electropored cells were placed for 45 min on a rotary shaker at 37 °C.
100 µl of electropored cells were plated in a selective solid LB medium (1.6% agar) containing:
• ampicillin (50µg/ml), • streptomycin (50µg/ml),
• Isopropil-Thio-b-D-galactopiranoside (IPTG) (20mM)
• 5-Bromo, 4-Chloro, 3-Indolyl β – D-galactopiranoside (XGal) (50 mg/ml).
Then, the cells were incubated overnight at 37°C. The following day, single white colonies were picked from the solid medium, transferred in a liquid LB medium and incubated at 37°C. Finally, the plasmids containing the common (C150) and mutant (150T) sequences were prepared by using Wizard Plus SV Minipreps DNA purification
system (Promega). Sequence analysis were carried out to confirm the insertion of the
PCR products and that the sequences matched original sequences without PCR-generated errors.
5.4 DNA sequencing
PCR-amplified fragments were purified by QIAquick PCR purification Kit (Qiagen), and sequenced by fluorescence-based automated direct sequencing with BigDye Terminator Cycle Sequencing Ready Reaction Kit in 310 DNA sequencer (PE Applied Biosystems). Sequencing reaction mixtures contained 4 µl of Terminator Ready Reaction Mix, 200 ng of template, 3.2 pmol of each primer in a total volume of 20 µl. Cycle sequencing was carried out for 25 cycles at 96°C for 10s, 50°C for 5s, 60°C for 4min in GeneAmp PCR system 9600. The extension products were purified by using the Centri-SepTM spin columns (Princeton Separations).
5.5 Quantitative DHPLC
Accurate heteroplasmy level determinations of the mtDNA region encompassing the C150T site in DNA samples was analysed using Denaturing High Performance Liquid Chromatography (DHPLC) technology and direct sequencing.
After PCR fragments had been denatured for 3 min at 95°C, and gradually re-annealed from 95°C to 65°C in 30 min, 15 µl of each sample were injected onto a DNASep™ column of a Transgenomic Wave Nucleic Acid Fragment Analysis System (Transgenomic, San Jose, CA). The amplicons were eluted in 0.1 M triethylammonium


![Fig. 6 Example of heteroplasmy quantitation by measuring [Het / Hom + Het] n in the 5% C with 95% T](https://thumb-eu.123doks.com/thumbv2/123dokorg/2880496.10292/26.892.189.630.804.977/fig-example-heteroplasmy-quantitation-measuring-het-hom-het.webp)


