Alma Mater Studiorum – Università di Bologna
DOTTORATO DI RICERCA IN
Ingegneria Civile, Ambientale e dei Materiali
Ciclo XXVIII
Settore Concorsuale di afferenza: 08/A3Settore Scientifico disciplinare: ICAR/05
EVALUATING CYCLIST PATTERNS USING GPS DATA
FROM SMARTPHONES.
Presentata da: Silvia Bernardi
Coordinatore Dottorato
Relatore
Prof. Alberto Lamberti
Prof. Federico Rupi
Acknowledgements
My journey through this three-years PhD study has been sometimes challenging, always interesting, and has taught me so much about the research subject, but also about myself. I have grown an invaluable set of skills, both work-related, and personal. I have had the opportunity of travelling a lot, working with many talented researchers and this improved significantly the value of my study and my personal growth.
The first person I feel like saying thanks to is Lissy: during this last year you have been my supervisor, my roommate, my life-coach but most of all my friend. I should thank you for the numerous lessons on transport modelling, but also for those on passion, hard work, and strength. Your example has been inspiring through these final months of work on my thesis.
I would like to say thank you to Karst Geurs, for his kindness, support, encouragement and patience. A cake is not nearly enough to thank you for the opportunity you gave me, not even my chocolate one.
Also thanks to all the CTS people at the University of Twente, you have been extremely welcoming and nice to me, and made those months one of the best memories from this years. A special acknowledgement is for Borja, who taught me tons of ArcGIS secrets, I will never thank you enough for your precious help.
I would like to thank my supervisor Federico Rupi, and all my colleagues from the University of Bologna, for your help and guidance during this experience.
Furthermore, Professor Aura Reggiani, from the Department of Economics of the University of Bologna and Professor Kevin J. Krizek, from the University of Colorado, are greatly acknowledged for their guidance and their precious inputs to my work. The conference time we shared, and the talks, have been greatly inspiring.
On a more personal note, I would like to thank all my friends, I will not name all, but each of you helped me and encouraged me during these three years. Also, I would like to thank Pier Paolo: among all the surprises I found throughout this journey, probably the least expected, certainly the most joyful.
Finally, this work is dedicated to my family, my parents Angela and Claudio and my brother Alessandro: thank you for your loving support during my education and your constant faith in me, without your encouragement nothing I did would have been possible.
Part of the contributions of the candidate, and her co-authors, to the study presented in this PhD thesis have already been published as Journal papers, listed below. Data, methodologies and results published in these papers are therefore part of this document, and will be discussed in Chapter 1 and 3.
Journal Paper 1: The paper presented in Chapter 1 is first-authored by the candidate, authored by Professor Kevin J. Krizek of the University of Colorado Boulder, and co-authored by Professor Federico Rupi, and is published as:
Bernardi, S., Krizek, K.J., Rupi, F. (2016). Quantifying the role of disturbances and speeds on separated bicycle facilities. Journal of Transport and Land Use, 9(2), In Press.
Journal Paper 2: The paper excerpted from Chapter 3 is first-authored by Dr. Joerg Schweizer, co-authored by the candidate, and co-authored by Professor Federico Rupi, and is published as:
Schweizer, J., Bernardi, S., Rupi, F. (2016). Map-matching algorithm applied to bicycle GPS traces in Bologna. ITE Intelligent Transport Systems, In Press.
Summary
Abstract ...15
Abstract in italiano ...16
Introduction ...18
Research background and aims ...18
Thesis outline ...21
Chapter 1: Quantifying the role of disturbances and speeds on separated bicycle facilities (Journal Paper #1) ...24
1.1. Overview ...25
1.2. The specific context of separated cycling facilities ...27
1.3. Research approach ...29
1.3.1. Selection of segments studied and their characteristics ...29
1.3.2 Data collection ...33
1.4. Results and analysis ...34
1.4.1. Speed and use attributes ...34
1.4.2. Disturbance analysis...38
1.5. Implications and future research ...42
1.6. Summary ...44
1.7. References ...45
Chapter 2: The use of GPS data for bicycle route choice modelling ...49
2.1. Introduction ...49
2.2. Literature Background ...53
2.2.1. Map-matching ...53
2.2.2. Alternative choice set generation ...56
2.2.3. Bicycle route choice modelling ...59
Chapter 3: Application to the first case study: the European Cycling Challenge in Bologna
(Italy) ...67
3.1. The GPS trips database ...67
3.2. The network database ...69
3.3. The map-matching methodology (Journal Paper #2) ...71
3.3.1. Introduction ...72
3.3.2. Map-matching methods ...74
3.3.3. The buffer-based map-matching procedure ...75
3.3.4. Application of the map-matching algorithm to the case study of Bologna ...79
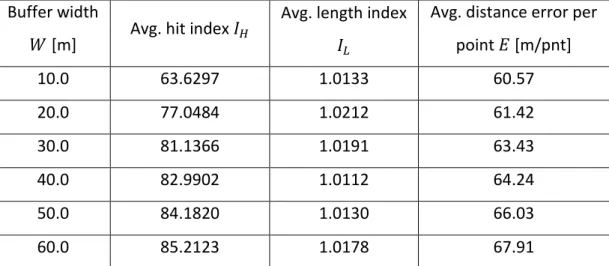
Evaluation criteria ...80
Sensitivity analysis ...82
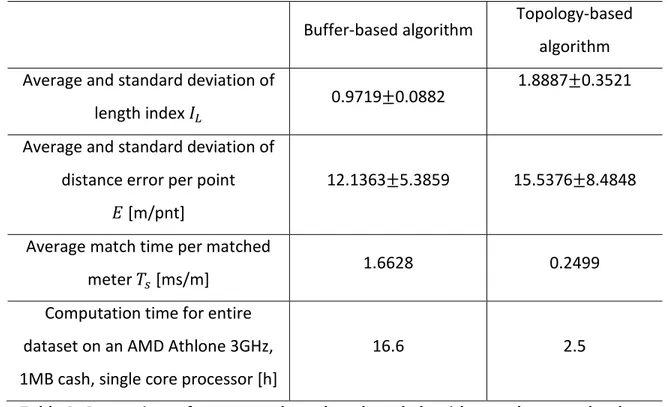
Performance comparison ...85
Limitations ...90
3.3.5. Summary ...90
3.4. Descriptive analysis of the results ...92
3.5. References ... 101
Chapter 4: Application to the second case study: the Mobile Mobility Panel in the Netherlands ... 105
4.1. Description of the database ... 105
4.1.1. The GPS trips database ... 105
4.1.2. The network database ... 107
4.1.3. GPS Post-Processing ... 109
4.2. Descriptive analysis of the results ... 109
4.2.1. Statistics ... 109
4.2.2. Traveled distance versus shortest distance ... 115
4.3. Choice set generation ... 117
4.4. Model estimation ... 119
4.4.1. Discrete Choice Modelling Framework ... 119
4.4.2. Binomial logit model ... 121
4.4.3. Mixed multinomial Path-Size logit model ... 123
Abstract
In recent years the availability of GPS data has seen as a significant improvement in data accuracy, continuity and quality, due to the spread of smartphones and mobile applications for self-localization and navigation. GPS datasets provide analysts with geo-referenced information about users’ mobility and habits.
The first part of the thesis consisted of an analysis of the context of bicycle facilities for the city of Bologna, Italy, made through experimental measures of cycleway and road usage rates, and cycling speed.
The following part of the study focused on the use of GPS traces datasets, which allow to record a wide amount of bike trips. The main advances in the last years’ relevant literature have been described. Subsequently, two case studies have been analyzed: GPS traces datasets recorded through mobile devices, both for the city of Bologna and for the whole Netherlands.
First, the original dataset of GPS points have been properly filtered in order to exclude instrumental errors. The GPS points have then been matched to a high-detail network database, in order to obtain the actual routes chosen by cyclists. The considered road networks included both attributes of the roadway and attributes of the bicycle facilities, when existing.
The percentage of the trips done on a bicycle facility versus the roadway could thus be compared with the results from the first part of the study, and be used as a measure of the attractiveness and effectiveness of the bicycle facilities available. Furthermore, the chosen routes could be compared with the shortest routes for each origin-destination pair, and route choice models could be calibrated, based on different relevant attributes of the networks, of users, and of trips.
Abstract in italiano
Negli ultimi anni la disponibilità di dati GPS ha visto un deciso miglioramento in termini di accuratezza, continuità e qualità del dato, anche grazie al diffondersi di smartphone e applicazioni per l’auto-localizzazione e navigazione. I dati GPS forniscono agli analisti preziose informazioni geo-referenziate riguardo agli spostamenti e alle abitudini di mobilità degli utenti.
La prima arte del lavoro di tesi è consistita in un’analisi del contesto ciclabile per la città di Bologna, attraverso rilievi sperimentali dell’uso delle infrastrutture ciclabili, o della carreggiata stradale, nonché delle velocità dei ciclisti.
Successivamente lo studio si è concentrato sull’uso di dataset di tracce GPS, che permettono di registrare una grande quantità di viaggi in bici. Sono stati descritti i princiali avanzamenti della letteratura pubblicata sul tema negli ultimi anni. Successivamente, sono stati presi in considerazione due casi di studio: le tracce GPS regsitrate tramite applicazioni mobile, per la città di Bologna in Italia, e per tutto il territorio dell’ Olanda.
Per prima cosa, i punti GPS che costituiscono i dataset originali sono stati opportunamente filtrat per escludere errori strumentali. I punti GPS sono quindi stati attribuiti ad un modello di rete opportunamente dettagliato, ottenendo così i veri e propri percorsi scelti dai ciclisti. I modelli di rete considerati includono sia le caratteristiche delle strade che delle piste ciclabili, laddove presenti.
Le percentuali di utilizzo delle piste ciclabili e della carreggiata stradale hanno così potuto essere confrontate con i risultati ottenuti dalla prima parte dello studio, e utilizzate come misura dell’attrattività e dell’efficienza delle piste ciclabili disponibili nei due casi di studio. Inoltre, i percorsi scelti sono stati confrontati con i percorsi di minima lunghezza calcolati per ciascuna coppia OD, e due modelli di scelta del percorso sono stati calibrati, sulla base di attributi della rete di trasporto, dei ciclisti e dei viaggi.
Introduction
Research background and aims
Over the years, non-motorized travel alternatives, as cycling, have been largely underrepresented in transport discussion both from city-administrators and policy makers, but also from research. Growing interest in sustainable transportation systems has increased the focus on policies and investments that are able to transform cycling in a real travel option, for everyday urban trips and for an increasing number of people belonging to different population segments. However, such investments are often made without being able to carry out a quantitative forecast of the impacts of the investment, thus risking to result in ineffective interventions. In this sense, what needs to be investigated in advance is the level of usage of existing bicycle infrastructures and travel patterns of existing cyclists. By knowing the “state of fact” of cycling mobility in a certain urban context, decision makers can effectively intervene for enhancing it.
The first approaches to the problem were mainly based on measuring the three fundamental traffic quantities – speed, volumes and density. The idea was to apply to bicycle infrastructures the same approach seen for the determination of the Level of Service for road segments. What these studies have determined, is that the same criteria adopted for car mode cannot completely be transferred to bicycle mode, as different are the factors that influence the quality of a trips as perceived by car travelers and cyclists. As research has been demonstrating in the last decades, cyclists consider a variety of factors when evaluating the quality of their cycling trips in an urban context. Cyclists’ travel decisions are often motivated by perceived travel time – and speed – as well as by perceived safety. Both travel time and safety are influenced by the geometric design of the facilities (turning radii, slope, lane width) and functional features (proximity to cars, speed
of adjacent cars, proximity of car parking stalls, presence of dedicated facility). Moreover, other factors intervene, less easy to quantify and measure, as land-use, pleasantness of the environment, or perceived quality of a bicycle context.
Thus, researchers tried to develop synthetic indicators of bikeability, or stress level, or level of service, mainly based on stated preference surveys. Stated preference surveys has been largely used for understanding cyclists’ preferences, as they constitute a relatively cheap data collection method, and they provide a controlled experimental environment.
Another consistent part of the literature on the subject has relied on revealed preference surveys, where analyst asked participants to describe their travel choices after the travel itself. In order to use this more reliable source of data, more information on the network is needed, as well as specific methodologies for data analysis.
Recently, research on cyclists’ preferences has grown thanks to the spread of the Global Positioning Systems (GPS) recording devices. On one side, the level of accuracy of GPS devices has increased, thanks to the investments on the involved technologies. On the other side, people habits and attitude towards the use of smartphone changed very rapidly, to the point that nowadays it is absolutely common for people to possess a smartphone, keep self-localization devices activated, declare their position in order to make it available for a vaste set of applications and services, register, monitor and share with people their position, trips and activities. Data availability for investigating cyclists travel choices and habits has seen an incredible enhancement.
In parallel with these changes in technology and society, research followed: several of the methodological developments relevant to modelling route choices from GPS-based travel surveys are relatively recent.
This work aimed at understanding which are the most critical aspects of cycling in an urban context, and individuating what makes a path more attractive of another for cyclists. To do so, we started to explore some experimental data from Bologna, an Italian medium-sized city that has one of the highest bicycle split rate, considering the Italian context. The first measurements of usage rates and speed patterns on cycleway and road segments of the
network of Bologna indicated that cyclists often cycle on the road, mixing with motorized traffic, even if a bicycle facility next to the roadway is provided. This in mainly due to the frequent interruptions that a cyclist encounter along a dedicated bicycle path, and to the presence of disturbances. One of the main factors influencing cyclists’ choices are indeed his perception of speed and safety.
The research then moved towards the use of GPS smartphone-based datasets. Such data provides a broader point of view on cyclists’ behaviour, as well as more information on the cycling patterns of a much wider sample of cyclists on a much wider portion of the network. The benefits of the availability of such rich travel datasets comes, of course, with the burden of a much more complicated process of data elaboration and analysis. The main processing methodologies for modelling route choice from GPS traces recorded from smartphone have been described, and can generally fall into three main categories: (1) filtering and map-matching procedures, (2) choice set generation and (3) route-choice modelling.
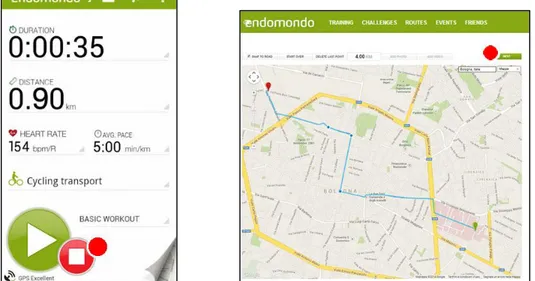
Each of these steps has been considered in this work, and both novel and existing methodologies have been applied to real case studies. The first case study considered is, again, the city of Bologna. A rich database of GPS traces collected through a smartphone application by cyclists, in the framework of the European Cycling Challenge of 2013, has been processed and analysed.
The second GPS-recorded trip dataset available has been collected in the Netherlands, in the framework of the Mobile Mobility Panel, using a dedicated smartphone application. Participants from all over the Netherlands has been registering their bicycle trips for weeks, indicating the trip purpose. The database also comprised personal socio-economical information of participants.
Thesis outline
This PhD thesis consists of four main parts, which are illustrated in next page scheme. The first part of the thesis will present an analysis of the context of bicycle facilities for the city of Bologna, Italy. From first Chapter a Journal paper has been published, and the outline of the Chapter reflects the main structure of the paper. The aim of this first part of the study is to shed light on cyclists’ usage of the bicycle facilities, in order to describe the specific context of bicycle facilities in Italy.
The second part of the work will focus on the use of GPS data coming from smartphone to investigate cyclists’ preferences and habits. The literature background on the subject will be descripted in Chapter 2, focusing on the three main phases of the GPS data analysis process, i.e. the map-matching of the GPS points to the network database, the choice set generation methods, and route choice modelling.
Further, two applications to two case studies will be described: Chapter 3 will provide detail on the case study of the GPS database of cyclists trips collected in Bologna in the framework of the European Cycling Challenge. First, the GPS trips database and the network database will be described. Subsequently, a novel map-matching procedure will be proposed and applied to the case study; from this map-matching phase of the study a second Journal paper has been excerpted and published. The last part of Chapter 3 will provide a descriptive analysis of the traces obtained as an output of the map-matching algorithm previously proposed.
Chapter 4 focuses on the second case study, the bicycle GPS traces collected in the Netherlands for the Mobile Mobility Panel. This second database available for the study will be described, the analysis of matched trips will be illustrated and two models for route choice will be estimated and discussed.
Finally, general conclusions from the whole PhD study will be drawn in the final part of the document, summarizing the applied methodologies, the main results, and the lessons that could be derived, also considering possible future developments to this research.
Chapter 1: Quantifying the role of
disturbances and speeds on separated
bicycle facilities
Journal Paper 1: The paper presented in Chapter 2 is first-authored by the candidate, authored by Professor Kevin J. Krizek of the University of Colorado Boulder, and co-authored by Professor Federico Rupi, and is published as:
Bernardi, S., Krizek, K.J., Rupi, F. (2016). Quantifying the role of disturbances and speeds on separated bicycle facilities. Journal of Transport and Land Use, 9(2), In Press.
A preliminary version of this paper was presented at the World Symposium of Transport and Land Use Research in Delft (NL), in June 2014. The paper was then updated, rewritten and accepted for publication from the Journal of Transport and Land Use, scheduled for Scheduled for JTLU vol.9 (2), 2016.
1.1. Overview
As cities worldwide aim to spur more bicycling in cities, a key issue revolves around the nature and design of specific, bicycling-oriented facilities. What design treatments might be necessary to best separate cyclists and pedestrians from traffic? What are associated land use constraints? Available guidelines (e.g., see CROW 2007, NACTO 2012, AASHTO 2012) are usually specific to various countries or contexts and provide differing levels of specificity about the degree to which cycling facilities mix with pedestrians. What remains unknown is detailed knowledge about how pedestrians mix with or impede cycling behavior in different contexts. This research therefore aims to quantify the impact of impedances along different types of cycling facilities, focusing on, but certainly not limited to, the role of pedestrians.
Several research efforts address the effectiveness of dedicated bicycle facilities on outcomes such as cyclist safety, user satisfaction or other. Using stated preference surveys (Abraham et al. 2002, Sener et al. 2009, Stinson and Bhat 2005, Krizek and Roland 2005, Tilahun et al. 2007), revealed preference surveys (Broach et al. 2012, Menghini et Al. 2010, Hood et Al. 2011), and accident data (Aultman-Hall and Hall 1998, Lusk et al. 2011, 2013, 2014), the research base generally suggests that dedicated facilities help spur levels of cycling (Schweizer and Rupi, 2014), provide safety benefits (perceived and real), and advance a more pleasurable cycling experience.
Cyclists consider a variety of factors when evaluating the utility of a route and more specifically, a particular segment of a route. Decisions are often motivated by perceived safety and a desire to maintain their ideal cycling speed (i.e., they tend not want to be slowed by various obstructions). Safety and speed are influenced by the geometric design of the facilities (turning radii, slope, lane width) and functional features (proximity to cars, speed of adjacent cars, proximity of car parking stalls, presence of disturbances on the facility). But key dimensions that have received less attention in the design and research
about bicycle facilities revolve around disturbances: specific obstacles in the facility that affect user satisfaction. Disturbances may be stationary (e.g., intersections, utility poles, bollards) or non-stationary (e.g., other cyclists or pedestrians).
For example, intersections that punctuate bicycle facilities have shown to be particularly vexing: a body of literature examining intersections along off-street paths is burgeoning (Phillips et al. 2011, Schepers et al. 2011, Sorton and Walsh 1994, Strauss and Miranda-Moreno 2013). In the path/route choice literature, using both SP and RP-based studies Broach et al. (2012) and Sener et al. (2009) found that route utility reduced by high-traffic crossings, stop signs, and traffic signals. Although the delay of these intersections can vary and be modified to favour cyclists, depending on traffic control devices used (signals or stop signs), more intersections than fewer are often perceived as a nuisance and impedance.
A different type of disturbances are those that are non-stationary in nature—other cyclists or users of other modes. Sometimes, the utility of a separated bicycle facility may be undetermined because of the intended or unintended need to mix with other modes. Pedestrians are a prime example of such. Little research, however, has focused on the extent to which pedestrians mixing with cyclists decrease the speed and therefore lessen the utility.
The most relevant literature we are aware of in this respect refers to “pedestrian hindrances.” For example, knowing volumes and speeds of pedestrians and cyclists, Botma (1995) initially proposed a model to evaluate the number of passing and meeting events on off-street facilities. This work was later adopted and applied to different contexts (Allen et al 1998, Virkler et al. 1998, Green et al. 2003, Highway Capacity Manual 2010) to demonstrate how hindrances affect functional characteristics of bicycle facilities. The main contribution of these studies was the determination of a level of service for shared off-street facilities based on the number of passing and meeting events. This work, however, left issues unanswered, such as the specific impact of hindrances on users speed. Also, Botma’s methodology supposes a normal distribution of bicycle speeds and fails to consider alternatives such as mixing with traffic.
We aim to fill this gap in the literature by systematically analyzing three transportation segments in Bologna (Italy). We considered two different environments: off-street bicycle facilities and mixed traffic conditions in the roadway. By definition, off-street facilities include both separated bicycle facilities (exclusive to cyclists – cycleways – or shared with pedestrians) and cycle tracks (, i.e. bicycle-exclusive paths) (European Economic and Social Committee, 2012).
We focus here exclusively on non-stationary disturbances to cyclists: pedestrians and bicyclists for the off-street environments and motorized vehicles for roadway environment. We compared cycling travel speeds in each environment to quantify speed reductions, largely types and amounts of non-stationary disturbances.
Our results contribute to the literature by quantifying cyclist speed reductions from pedestrians (on off-street facilities) and motorized traffic (on the roadway). This work has direct implications for developing decay curves that relate travel speed on cycling facilities with pedestrian volumes; such decay curves prove useful for the future planning of dedicated facilities in urban areas. We describe the context of our research and the specifics of the three segments. The following section details our data collection process and results. The conclusions discuss implications and future research needs.
1.2. The specific context of separated cycling facilities
Our research focuses on disturbances, which are a situated in a particular cultural context. It is therefore helpful to each as they apply to our study—being situated in Bologna (Italy)— and some peculiarities relating to bicycle facilities. Structural and functional aspects of cycling facilities in Italy are regulated by the Codice della Strada, along with the Decreto Ministeriale number 557 from 1999, “Regolamento recante norme per la definizione delle caratteristiche tecniche delle piste ciclabili.” These regulations offer guidelines to plan and design cycling facilities, stating as their aim, “the achievement of a proper level of safety and environmental sustainability” (Decreto Ministeriale number 557 of 1999, Article 1).
Different designs for off-street facilities described by the Italian guidelines are shown in Figure 1. These guidelines, similar to the situation in many countries, prescribe various types of bicycle facilities for different types of traffic situations. There is wide variation in the types of facilities and the manner in which they separate cyclists from cars.
Note at least three factors run in the face of these guidelines. The first is that it is not uncommon for a cycling facility to be constructed with design treatments misapplied in a given context; alternatively, specific standards might be waived or ignored. Secondly, contextual factors (most often lack of space) affect the overall quality of specific design elements. For example, in some instances, an “off-street bicycle facility” is comprised of a raised treatment (e.g., a curb with accompanying bricks) on one side of the street to separate the cyclist from cars. The other side of the cycling lane, however, might merely be a painted stripe to separate cyclists from pedestrians. This leads to a third issue: even when a facility is designed and rules for its use are specified, regulations are mere suggestions. When space for pedestrians is provided in adjacent space or banned from the cycling facility altogether, it is not uncommon for pedestrians to encroach on the cycling facility. In cases of high pedestrian flows, they merely “spill over” into the cyclist facility. This is commonplace not only in Bologna, but also in many cities throughout Europe where it is difficult to find space for non-motorized travel in extremely space-constrained situations.
a) b)
c) d)
Figure 1: Some examples of the off-street facility typologies in Italy, as categorized in the Italian regulation: a) separated path non-adjoining the roadway; b) separated path,
separation obtained by a non-continuous barrier; c) cycle track, obtained from the sidewalk, separating pedestrian and bicycle areas with different pavements; d) cycle track, obtained from the sidewalk, separating pedestrian and bicycle areas by painted
markings.
1.3. Research approach
1.3.1. Selection of segments studied and their characteristics
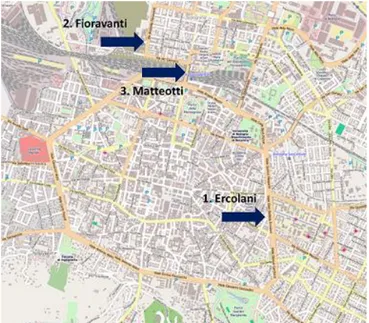
Our central objective was to quantify how different types of disturbances affect cyclist travel speed; we chose three segments of Bologna’s (Italy) cycling network to do so (Figure
2)1. Our primary concern was on the interplay between pedestrians and cyclists in off-street
bicycle facilities—but we aimed to do so, in part, relative to disturbances caused by motorized vehicles (cars, buses/trucks, motorcyclists) in mixed traffic. We therefore chose study segments with: (a) an off-street bicycle facility adjacent to the roadway, (b) varying levels of pedestrian use around them, and (c) varying traffic volumes on the roadway. To the extent possible, we chose segments away from key intersections, allowing us to better focus on primary characteristics of segments vis-a-vis cyclists travel behaviour. Similarly, we aimed to keep speeds of vehicular travel constant as best as possible. The segments were defined to be 20 meters long and the location of each is approximately two kilometres from the centre of Bologna. Characteristics of each segment are described below with locations shown in Figure 2. Summary characteristics are presented in Table 1.
Figure 2: Map of Bologna and locations of the three segments.
1 We employ the following nomenclature throughout this manuscript to improve
clarity. Segments are the three areas studied; each segment is approximately 20 meters long. These segments contain an off-street bicycle facility (that is separated from traffic via a physical means — raised curb, parked cars or median) and an adjacent travel lane where the cyclists can mix with motorized traffic, i.e. the roadway. Therefore, each segment has two different types of environment.
Segments Type of off-street bicycle facility Width of the bicycle area (m) Width of the pedestrian area (m) Pedestrian volumes Posted speed limit of adjacent roadway (km/h) Peak bus volumes on adjacent roadway /hour (1) Ercolani Exclusive separated facility 1.80 - Low 50 40 (2) Fioravanti Cycle track on pavement 2.10 1.90 Modest 50 5 (3) Matteotti Cycle track on pavement 1.90 1.50 High 50 55
Table 1: Features of the three segments examined.
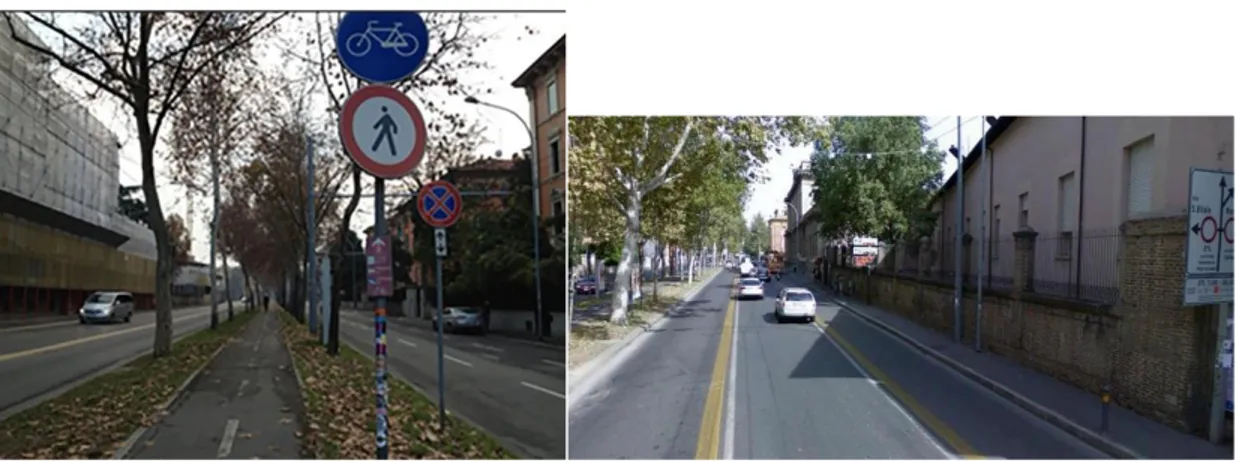
(1) Ercolani (Figure 3) is along the first ring road of the city. It includes two carriageways
with 50 km/h traffic that is divided by a median strip. Both sides of the northbound and southbound carriageways carry buses: 40 per hour, southbound, during peak times, and 20 per hour, northbound. The off-street bicycle facility in this section is part of a separated facility with bidirectional lanes, reserved only for cyclists2.
2 The red circled sign with the pedestrian indicates pedestrians are technically
Figure 3: The off-street facility and roadway layout in Segment 1.
(2) Fioravanti (Figure 4) is along a one-way street that heads toward the city centre
(southbound). Bus traffic is considerably less than in Segment #1 (5 per hour), but lateral parking is permitted on both sides of the roadway. The off-street bicycle facility in this section is bi-directional and is separated from a pedestrian zone by a painted stripe. Pedestrian volumes are modest.
Figure 4: The off-street facility and roadway layout in Segment 2.
(3) Matteotti (Figure 5) is adjacent to a four lane road close to the central train station;
the off-street bicycle facility in this section is similar to that in Segment #2. Being close to the central train station, bicycle, pedestrian and motorized volumes are high. On average, bus volumes are between 50 and 60 per hour, using all three southbound lanes.
Figure 5: The off-street facility and roadway layout in Segment 3.
1.3.2 Data collection
For each of the three segments, we studied cyclist travel on the off-street bicycle facility and on the immediately adjacent roadway (for a total of six environments). We chose seven working days (from 8:30 until 10:30) in April 2012 to be best representative of general cycling conditions. We collected data in two different phases. Our first phase counted the number of cyclists on each of the six different environments and timed how long each cyclist took to travel the 20 meter stretch. We tallied cyclists in all directions according to the environment they were cycling in (off-street versus roadway). This data provided us with baseline information about speed and also pointed to general patterns of use across the different facilities.
In the second phase we administered our own experiments to collect data relating disturbances and speed. One researcher cycled in each environment approximately 100 times. Employing the typology presented in Table 2, he used his own judgement to record
all types of disturbance he encountered. For example, pedestrians encroaching onto the off-street bicycle facility were a disturbance; in the mixed traffic, cars or buses that forced him to share a lane or otherwise affected his travel were a disturbance . The researcher was asked to conform to typical cycling behaviour, and to keep it consistent (e.g., when to pass other cyclists). Furthermore, he was encouraged to apply consistency in how each type of disturbance was classified. The other researcher timed the cyclist on the 20 meter stretch. The research team did this approximately 100 times for each environment, totalling almost 600 coupled measures.
Off-street Bicycle Facility Roadway
No pedestrians, bikes in same direction No disturbances or two-wheeled vehicles No pedestrians, bikes in opposite direction 1 car or more
1 – 3 pedestrians 1 bus or more
4 pedestrians or more Heavy vehicles
Table 2: Classes of disturbances considered.
1.4. Results and analysis
1.4.1. Speed and use attributes
We first aimed to better understand baseline measures for each of the three environments and the relative characteristics. Segment #3 had the highest volume of cyclists, recording an average of 850 cyclists for the two-hour period; Segment #1 averaged 480 cyclists and Segment #2 had 240. These volumes are consistent with the intensity of land uses and activities around each segment (e.g., Segment #1 is adjacent to the central station and
along a primary corridor headed into town; Segment #2 is in a more peripheral location and on a minor road). Using data collected from this phase we calculated average speeds for each environment; summary results are shown in Table 3. Average cycling speeds varied between 14.6 and 22 km/h, which generally agree with the values reported in Allen et al. (1998). Most studies with which we are familiar found bicycle speeds to be normally distributed; this varied by facility in our data and distributions for each are shown in Figure 6. A significance t-test was performed for the two speed samples, comparing off-street facility and mixed traffic data, and results revealed a statistically significant difference between the two samples for all the three segments.
Across all segments, average cyclist speed was higher in mixed traffic facility than on the off-street bicycle facility. Overall, cyclists’ speeds were highest in Segment #1 (18.9 km/h on the off-street bicycle facility and 22 km/h in mixed traffic), largely owing to pedestrians being technically forbidden in the off-street facility and cyclists often using the dedicated bus lanes in the roadway.
Figure 7 shows the proportion of cyclists’ using the different environments. Segment #2 had the highest percentage of cyclists using the off-street facility (73%), followed by 58% in Segment #1. In contrast, less than half of the cyclists (47%) used the off-street facility in Segment #3. Even in Segment #1, where the off-street facility is not shared with other users, 42% of the cyclists chose to mix with traffic. Several factors contribute to these patterns and explaining them is clearly beyond the scope of our immediate study. Common sense suggests that variations and revealed preferences have to do with the width of the adjacent corridor for pedestrians (which lead to disturbances); other matters relate to discontinuities of the off-street facility further upstream (or downstream). Still other factors may be due to the cyclist’s desire to link origins and destinations along the corridor; the specific facility might be out of the way of their needed route. But some of the variation is also influenced by intensity of the non-stationary disturbances (particularly pedestrians) in affecting speed along the routes. We now turn to quantifying the extent of these non-stationary disturbances in terms of decreased speed.
Segments Average # of cyclists measured in 2 hrs Statistic Off-street Bicycle Facility Roadway (1)Ercolani 480 Mean speed (km/h) 18.90 22.00 Standard deviation (km/h) 3.16 5.08 Coeff. of Variation 0.168 0.231 (2)Fioravanti 240 Mean Speed (km/h) 14.60 16.8 Standard deviation (km/h) 3.12 4.24 Coeff. of Variation 0.213 0.252 (3)Matteotti 850 Mean Speed (km/h) 16.00 17.00 Standard deviation (km/h) 2.97 4.39 Coeff. of Variation 0.186 0.259
Segment 1 - Ercolani Segment 2 - Fioravanti Segment 3 - Matteotti 0 5 10 15 20 25 30 35 40 < 1 0 10 – 12 12 – 14 14 – 16 16 – 18 18 – 20 20 – 22 > 2 2 0 10 20 30 40 50 60 < 1 0 10 – 12 12 – 14 14 – 16 16 – 18 18 – 20 20 – 22 > 2 2 0 5 10 15 20 25 30 35 40 < 1 0 10 – 12 12 – 14 14 – 16 16 – 18 18 – 20 20 – 22 > 2 2 0 5 10 15 20 25 < 1 0 10 – 12 12 – 14 14 – 16 16 – 18 18 – 20 20 – 22 > 2 2 0 5 10 15 20 25 30 35 40 45 50 < 1 0 10 – 12 12 – 14 14 – 16 16 – 18 18 – 20 20 – 22 > 2 2 0 5 10 15 20 25 30 35 40 < 1 0 10 – 12 12 – 14 14 – 16 16 – 18 18 – 20 20 – 22 > 2 2
Figure 6: Cyclists’ travel speed distributions: on the horizontal axes speed values are divided in ranges; the bars represent the frequency of speeds. In blue, the results for
separated bicycle facilities, in red those for the roadway.
Figure 7: Cyclist use by facility.
1.4.2. Disturbance analysis
For each of the approximate 600 coupled observations, we calculated average speeds and examined them relative to the type of disturbance. For each recorded disturbance, we calculated the speed reduction compared to free flow (undisturbed) travel conditions. We also tallied the frequency of the different types of disturbances, reflected as a proportion of measurements where a disturbance was recorded. Finally, we calculated the average speed weighted by the frequency of each disturbance for both the off-street bicycle facility and the roadway. Results are shown in Tables 4 and 5, by segment.
Average travel speeds reflect the probability of each type of disturbance. The bottom row in the tables shows the frequency of measurements where at least one disturbance was registered — as a complement to the percentage of measurements where no disturbances
58 73 47 42 27 53 0% 10% 20% 30% 40% 50% 60% 70% 80% 90% 100%
(1) Ercolani (2) Fioravanti (3) Matteotti % Separated facility % Mixed traffic
were registered3. The cyclist-researcher experienced a disturbance approximately half the time. And, when the cyclist-researcher experienced no disturbances, his speeds generally agreed with the speeds recorded from phase 1 of the data collection. For Segments #1 and #3, disturbances were more frequent on the off-street bicycle facilities (54% and 90% of the time) than on the roadway (45% and 58%, respectively). The frequency of disturbances was more balanced across the facilities for Segment #2 (58% for separated and 62% for mixed).
The frequency by type of disturbance varied. Pedestrians were most common for the off-street facilities in Segments #2 and #3; for Segment #3, a cyclist would encounter a pedestrian in 90% of the observances. Cyclists in the opposite direction were most common in #1. For the roadway, cars were clearly the most common disturbance (24%, 57%, 47% of observances).
In each of the off-street facilities, pedestrians had the largest impact on cyclists’ travel speed, affecting a 10 to 27% reduction. Other cyclists were second, slowing speeds by 5%, on average. The speed reduction was felt most acutely in Segment #3 — owing to a variety of factors — but overall pedestrian volumes were clearly one of them.
In mixed traffic, we noticed speed reductions from cars and trucks; disturbances from motorcycles were negligible. In Segment #1, buses led to speed reductions of 25%; in Segment #3, cars and buses led to speed reductions of 32% and 37%. The largest impact was associated with heavy vehicles, a 63% speed reduction. In general, cars, buses and heavy vehicles, have the greatest impact on reducing cyclist travel speed; pedestrians much less.
Furthermore, we considered weighted average — jointly analysing the average speed reduction weighted by frequency of disturbance. For Segments #1 and #2, weighted speed reductions are relatively minor, ranging between 2% and 14%. The weighted speed
3Percentages of observations with no disturbance and at least one disturbance sum to 100. Some of the observations, however, had more than one disturbance; therefore, the sum of the percentages of events for single classes of disturbance exceeds 100.
reductions we calculated in Segment #3 were considerable: 20% for the off-street facility and 40% for the mixed traffic. This segment is rich in disturbances and has notable speed reductions. Our analysis suggests cyclists might be making route choice trade-offs that are influenced by two factors: (1) frequent pedestrian disturbances on the off-street facility that produce moderate speed reductions, (2) relatively fewer disturbances on the roadway that have more severe speed reductions. Most cyclists prefer to travel in the mixed traffic — though robustly explaining this phenomena is beyond the scope of this data collection exercise.
Such factors suggest the attractiveness of a bicycle facility is impacted by jointly considering the frequency of disturbances and their effects. This joint calculus is a contributing factor in a cyclist’s decision to use an off-street facility versus the roadway. In other words, even if they know that encountering a heavy vehicle might present a safety hazard, at least on segments we studied, the event could be perceived to be rare enough for them to choose the mixed traffic condition.
(1)Ercolani (2)Fioravanti (3)Matteotti Disturbance type Average Travel Speed (km/h) % Reduction Average Travel Speed (km/h) % Reduction Average Travel Speed (km/h) % Reduction No disturbance 16.7 - 15.2 - 15.6 -% of events 45.9% 41.9% 9.6% Bikes same direction 16.0 4.2% 14.1 6.8% 15.5 0.14% % of events 6.6% 13.3% 4.8% Bikes opp. direction 16.2 3.1% 14.4 5.0% 14.1 9.0% % of events 29.5% 10.7% 1.2% 1 – 3 pedestrians 14.5 13.1% 13.5 10.8% 12.3 20.9% % of events 13.1% 33.3% 84.3% 4 pedestrians
or more n.a. n.a. 13.5 11.1% 11.3 27.2%
% of events 0.0% 1.3% 18.1%
Average speed, weighted by disturbance
15.6 6.4% 13.9 8.8% 12.5 19.6%
% of events 54.1% 58.1% 90.4%
(1)Ercolani (2)Fioravanti (3)Matteotti Disturbance type Average Travel Speed (km/h) Reduction% Average Travel Speed (km/h) Reduction% Average Travel Speed (km/h) Reduction% No disturbance 18.6 - 17.0 - 17.7 -% of events 55.2% 37.5% 42.1% Two-wheeled veh. 18.4 1.1% 17.0 0.26% 17.3 2.2% % of events 10.3% 3,1% 5,3% 1 car or more 17.0 9.0% 16.8 1.15% 12.0 31.7% % of events 24.1% 56.3% 47.4% 1 bus or
more 13.8 25.8% n.a n.a 11.1 37.2%
% of events 10.3% 0.0% 21.1%
Heavy
vehicles n.a n.a 14.9 12.3% 6.6 62.9%
% of events 0.0% 3.1% 2.6%
Average speed, weighted by disturbance
16.0 14.1% 16.7 1.8% 10.53 40.5%
% of events 44.8% 62.5% 57.9%
Table 5: Cycling Speeds by Type of Disturbance (Roadway).
1.5. Implications and future research
Aim to spur non-motorized travel, transport officials in cities are often challenged by finding available space in travel corridors for dedicated cycling facilities. This work informs these matters in several respects and also provides springboard to spur future research on the issue. We employed a data collection approach to quantify the speed effects of
non-stationary disturbances — disturbances which often influence cyclists’ route choice decisions. Relying on speed as just one of several performance measures, we measured the joint effects of disturbance frequency and disturbance impact.
We learned that motorized disturbances (particularly heavy vehicles) have the strongest impact on lowering cyclist’s travel speed. However, these specific disturbances proved to be relatively infrequent relative to those encountered on off-street bicycle facilities (where pedestrians are more plentiful and contribute to slowing the speed of cyclists). To our knowledge, this is the first data collection effort and analysis to point to this trade-off. Furthermore, failing proper separation between users, we learned that the presence of pedestrians can reduce cyclists speed by up to 30 percent.
Myriad factors influence a cyclist’s route choice, particularly the decision to use an off-street bicycle facility or ride in traffic. The probability of disturbances and their impact on travel speed are just two of them. Our results suggest that design elements of these facilities can play a role in affecting the frequency, type, and severity of disturbances. However, it is necessary for future work to better isolate this element (e.g., better projecting how wide sidewalks need to be given pedestrian volumes to avoid disturbing the bicycle facility). For example, Segment #2 had excess space for pedestrian travel and therefore little speed reductions from pedestrians; cyclists can avert pedestrians without significantly reducing their speed and, evidently, also pedestrian safety results enhanced. Furthermore, wider cycle-tracks (when warranted) benefit cyclist-cyclist interactions because it is easier to pass each other going in the same direction.
Our data collection effort represents a univariate population, which is an oversimplification. Different types of cyclists prefer different environments (Larsen and El-Geneidy 2011, Sener et al. 2009, Wilkinson et al. 1994). This type investigation could benefit from more robustly accounting for demographic, attitudinal or other behavioural data which was unfortunately unavailable for this effort. Furthermore, the type of detailed GPS data that is now being employed in other bicycle research applications (Broach et al. 2012, Hood et al. 2011, Menghini et al. 2011) could be adapted to focus specifically on
issues we studied here. GPS technology could then be used to focus on the role of trip type and broader route choice characteristics.
A subsequent step would be to integrate these results into a bicycle route choice model where frequency of disturbance and its magnitude represent various attributes of the utility. In the current state of the research, the most advanced approach merely considers the proportion of the facility that is separated for bicycling (Broach et al. 2012, Hood et al. 2011, Menghini et al. 2010). Finally, this research documents the frequency and quantifies the intensity of disturbances on speed. As future research on this matter evolves, cities would benefit from learning about various thresholds of pedestrian volume and corresponding cycling speed impacts. This work lays the foundation to create a decay curve which could be used to predict travel speed vis-à-vis pedestrian volumes (similar to how speed decay curves of vehicle flow are used to determine the level of service of infrastructures). Planners would then be able to more robustly estimate cyclist speeds— and levels of service—for different pedestrian volumes.
1.6. Summary
When off-street bicycle facilities are poorly designed or placed in less than optimum locations (such as in Segment #3), their intended use is less than anticipated. By analysing the speed reductions from different types of disturbances we found that frequency of disturbance might weigh more heavily than the intensity of the disturbance. Furthermore, encountering pedestrians along an off-street bicycle facility lowers average speeds by as much as 30 percent, especially in situations where the bicycle facility fails to conform to minimum standards. In mixed traffic, the presence of motorized vehicles can produce even more severe speed reductions (i.e. in case of heavy vehicles), but these interactions proved to be less frequent.
Most policy officials know they need to heed caution when prescribing off-street bicycle facilities adjacent to areas with high pedestrian activity. An outstanding question is how
many pedestrians present a problem and the corresponding speed reductions. For researchers, this work helps spearhead more robust investigations to establish, for example speed decay curves based on pedestrian volumes. For practitioners, our results draw attention to the need for physically separating pedestrians from cyclists in facility design. Or, where the context suggests less than optimum conditions for an off-street facility, it helps quantify when it might be more convenient to better accommodate bicycle travel in mixed traffic conditions.
1.7. References
[1] AASHTO. 2012. Guide for the Development of Bicycle Facilities. American Association of State Highway and Transportation Officials, Washington D.C.
[2] Abraham, J., McMillan, S., Brownlee A., Hunt, J.D., 2002, Investigation of cycling sensitivities. Presented at the 81st Annual Meeting of the Transportation Research Board, Washington, D.C.
[3] Allen, D. P., Rouphail, N. M., Hummer, J. E., Milazzo, J. S., 1998., Operational Analysis of Uninterrupted Bicycle Facilities. Transportation Research Record, 163, 29-36.
[4] Aultman-Hall, L., Hall, F.L., 1998, Ottawa-Carleton commuter cyclist on- and off-road incident rates. Accident Analysis and Prevention, 30(1), 29-43.
[5] Botma, H., 1995, Method to Determine Level of Service for Bicycle Paths and Pedestrian-Bicycle Paths. Transportation Research Record, 1502, 38-44.
[6] Broach, J., Dill, J.,Gliebe, J., 2012, Where do cyclists ride? A route choice model developed with revealed preference GPS data. Transportation Research Part A, 46, 1730-1740.
[7] CROW, 2007, Design manual For Bicycle Traffic. National Information and Technology Platform for Infrastructure, Traffic, Transport and Public Space, The Netherlands. [8] Decreto Legislativo 30 aprile 1992, n. 285. Nuovo Codice della Strada.
[9] Decreto Ministeriale 30 novembre 1999, n. 557. Regolamento recante norme per la definizione delle caratteristiche tecniche delle piste ciclabili.
[10] European Economic and Social Committee, 2012, European Cycling Lexicon. EUR-OP. doi:10.2864/10239.
[11] Green, J. S., Hummer, J. E., Rouphail, N. M, 2003, Using the number of passing and meeting events to design pedestrian and bicycles-use paths. Presented at the 2nd Urban
Street Symposium: Uptown, downtown, or small town: designing urban streets that work; July 28-30, 2003.
[12] Hood, J., Sall, E., Charlton, B., 2011, A GPS-based bicycle route choice model for San Francisco, California. Transportation Letters, 3(1), 63-75.
[13] Krizek, K.J., Roland, R.W., 2005, What is at the end of the road? Understanding Discontinuities of On-street Bicycle Lane in Urban Settings. Transportation Research Part D, 10, 55-68.
[14] Larsen, J., El-Geneidy, A., 2011, A travel behavior analysis of urban cycling facilities in Montreal Canada. Transportation Research Part D, 16, 172-177.
[15] Lusk, A.C., Furth, P.G., Morency, P., Miranda-Moreno, L.F., Willet, W.C., Dennerlein, J.T., 2011, Risk of Injury for Bicycling on Cycle Tracks versus in the Street. Injury Prevention, 17(2), 131-135.
[16] Lusk, A.C., Morency, P., Miranda-Moreno, L.F., Willett, W.C., Dennerlein, J.T., 2013, Bicycle guidelines and crash rates on cycle tracks in the United States. American Journal of Public Health, 103(7), 1240-1248.
[17] Lusk, A.C., Wen, X., Zhou, L., 2014, Gender and used/preferred differences of bicycle routes, parking, intersection signals, and bicycle type: Professional middle class preferences in Hangzhou, China. Journal of Transport and Health, 1(2), 124-133. [18] Menghini, G., Carrasco, N., Schüssler, N., Axhausen, K.W. 2010. Route choice of
cyclists in Zurich. Transportation Research Part A, 44, 754-765.
[19] NACTO, 2012, Urban Bikeway Design Guide. National Association of City Transportation Officials, Washington D.C.
[20] Phillips, R. O., Bjørnskau, T., Hagman, R., Sagberg, F., 2011, Reduction in car-bicycle conflict at a road–cycle path intersection: Evidence of road user adaptation?. Transportation Research Part F, 14, 87-95.
[21] Schepers, J.P., Kroeze, P.A., Sweers, W., Wüst, J.C., 2011, Road factors and bicycle -motor vehicle crashes at unsignalized intersection. Accident Analysis and Prevention, 42, 853-861.
[22] Schweizer, J., Rupi, F., 2014, Performance evaluation of extreme bicycle scenarios. Procedia of Social and Behavioral Sciences, 111, 508-517.
[23] Sener, I., Eluru, N., Bhat, C., 2009, An analysis of bicycle route choice preferences in Texas, US. Transportation, 36(5), 511-539.
[24] Sorton, A., Walsh, T., 1994, Stress level as a tool to evaluate urban and suburban bicycle compatibility. Transportation Research Record 1438, 17-24.
[25] Stinson, M.A., Bhat, C.R., 2003, An Analysis of commuter bicyclist route choice using a stated preference survey. Transportation Research Record, 1829, 107-115. [26] Strauss, J., Miranda-Moreno, L.F., 2013, Spatial modelling of bicycle activity at
signalized intersections. Journal of Transport and Land Use, 6(2), 47-58.
[27] Tilahun, N., Levinson, D.M., Krizek, J.K., 2007, Trails, lanes, or traffic: the value of different bicycle facilities using an adaptive stated preference survey. Transportation Research Part A, 41, 287.301.
[28] Transportation Research Board., 2010, Off-street pedestrian and bicycle facilities. In Highway Capacity Manual. Washington, D.C.
[29] Virkler, M., Balasubramanian, R., 1998, Flow Characteristics on Shared Hiking-Biking-Jogging Trails. Transportation Research Record, 1636, 43-46.
[30] Wilkinson, W., Clarke, A., Epperson, B., Knoblauch, R., 1994, The effects of bicycle accommodations on bicycle/motor vehicle safety and traffic operations. U.S. Department of Transportation, Federal Highway Administration.
Chapter 2: The use of GPS data for
bicycle route choice modelling
2.1. Introduction
As we discussed in the previous sections, understanding the main factors cyclists consider when evaluating an available path between an OD pair, is crucial in order to build effective infrastructures. The aim, when investing in bicycle infrastructure, is to answer to the following questions: Where people want to cycle from? Where to? On which path? Which type of facility they would prefer to ride on? And in which environment? When determining which path they will take from a certain origin to a certain destination, cyclists consider different aspects of the trip: travel time, directness, comfort, safety, are those generally indicated by literature. The analysis of cyclists’ choice behaviour has been investigated in recent years, through the estimation of route choice models.
One of the important issues in studying route-choice behaviour in cycling is the availability of data and its collection procedure. Information about actual chosen routes cannot be collected through conventional household travel-surveys. Thus, one reason for the lack of such data is that routes cannot be easily reported in the Computer-Assisted-Telephone-Interview (CATI) methods used for data collection. In the past decades, route choice models could be estimated mainly using stated preference data. In this case, for the data collection, the source of data would be surveys where users were asked to state which path they would choose between a certain origin and destination. Survey’s participants would have to indicate the chosen path on a map or, in alternative, different options could be pre-selected by researchers and users would have to indicate the one they would consider the most convenient. This second option would better allow researchers to control the
alternative choice set. Nevertheless, stated preference surveys have been largely criticized, as they do not capture the actual choices of users, but only their intentions; indeed, it has been verified that what people state they would do, does not always match with their actual, observed, behaviour.
A way to collect data that more reliably describe users’ choices is through revealed
preference data. Traditionally, information about trips were collected at the destination,
asking users to declare (and describe) the route they have just chose to reach that specific destination. While this data collection method let researchers observe more reliable choices, two are the main limitations: the small size of samples, when obtained by surveys at a specific location, and the difficulty of observing the routes.
In recent years, these issues has been significantly overcome by the use of Global Positioning System (GPS)-based travel surveys now provides an approach to trace vehicle movements and, hence, collect data on the actual routes chosen by cyclists in their trips. To date, the literature on empirical modelling of route choices using GPS traces are quite limited (see the work of Schussler and Axhausen 2009, Menghini et al. 2010 for the city of Zurich, Hood et al., 2010, with an application to the city of San Francisco, Broach et al, 2012, for Portland), but undoubtedly expanding. This can be explained considering different factors: for example, on one side the level of accuracy of GPS devices has increased, thanks to the investments on the involved technologies. On the other side, people habits and attitude towards the use of smartphone changed very rapidly, to the point that nowadays it is absolutely common for people to possess a smartphone, keep self-localization devices activated, declare their position in order to make it available for a burgeoning set of applications and services, register, monitor and share with people their position, trips and activities. Further, in parallel with these changes in technology and society, research on mobility followed: several of the methodological developments relevant to modelling route choices from GPS-based travel surveys are relatively recent.
In this context, the broad focus of this research is to combine data from GPS-based travel surveys and Geographic Information Systems (GIS)-based roadway network databases to estimate models for route-choice. For these purpose three are the main macro-areas of
research that have seen a significant development in recent years, and they can be classified following the three basic steps for any route-choice modelling study using raw GPS-data:
1) Map-matching;
2) Choice Set Generation; 3) Route Choice Modelling.
The map-matching is the process of identifying the specific links of the roadway traversed by a vehicle by mapping the points from its GPS trace to an underlying road network database. This step is critical as it identifies the fundamental “choice” (i.e., the route) of interest. In other words, given the singular GPS points registered during one trip – could be one per second, or registered with higher headway, generally up to 20 seconds – the map-matching procedure provides the sequence of links, belonging to the network database, that most likely where used. This means that the network database plays a key-role in the accuracy of the results of the map-matching: the more complete is the network representation, more likely it is that the process provides the path that was actually taken for the single registered trip. Furthermore, map-matching procedure should be easily replied for different contexts, and almost completely automated. For this reason, another important issue is the efficiency of the algorithms implied in this process, their ability to examine a high number of points and links with a reasonable computational effort.
Once the chosen path has been identified, the next step is to determine which other paths were available to the same traveller for moving between the same origin-destination pair. This process is called choice-set generation. Contrary to the case of a stated choice experiment, in this case there is not a limited choice set built “a priori”, or indicated by the respondent. For this reason, researchers (see for example Bovy and Fiorenzo-Catalano, 2007, Prato and Bekhor, 2007, Rieser-Schüssler et al. 2012, Halldórsdóttir et al. 2014 ) tried to develop algorithms and procedures to “generate” plausible alternatives, considering the network topology or a various set of network features. The challenge, for choice-set generation methodologies, is to build alternatives that are realistic, distinct but also – as
for the map-matching step – to maximize the efficiency of the involved procedures, especially in terms of computational effort.
Comparing the chosen routes for all respondents and all origin-destination pairs, and the corresponding choice sets, route choice models can be estimated, to describe the aspects of route choice behaviour. Considering the research field of route choice models, the literature is burgeoning with theoretical approaches and applications. For example, for an extensive description of discrete choice models that can be suitable for short-term travel decisions, such as route choice decisions, see Ben Akiva and Bierlaire (1999). The various models applied to bicycle route choice models will be listed and described further in this Chapter, in paragraph 3.2.3. In general, it can be said that the main aspect to considerate, when dealing with bicycle route choice deduced by smartphone data are: (1) the overlapping of alternatives and (2) the repetition of choices made by the same respondent. More in detail, the urban context and the roads on which people usually cycle require a small scale approach, and this leads to consider alternatives – paths – that can be very similar and highly overlapped. Different approaches and model forms were proposed to overcome this issue. Further, route choice models estimated from travel diaries – which is generally the case with smartphone data, should account for trip repetitions, between the same origin-destination pair, made by the same user. It is very likely that those choices that are usual and repeated over the days – systematic trips – present different features if compared with the occasional ones.
Another aspect that differs between the various models proposed in literature is the choice of explanatory variables, made by the analyst. This aspect is, of course, connected with the availability of data. As highlighted in the previous Chapters of this thesis, and widely established by research on bicycle trip mode, many are the aspects that cyclists consider when choosing a path over another, and such variety of factors should be captured by route choice models. In the last decade, in parallel with the development of the technologies connected to trip detecting and recording through portable localization devices, also the level of detail and attributes incorporated in network database has significantly increased. Thanks to the diffusion of what has been defined “volunteered geographic information”,
richer network database are available, compiled by volunteers, both in terms of completeness and in terms of attributes describing the network’s elements. As we will see in the following Chapter of this thesis, the application to the two case studies has been made, in both cases, using network database coming from volunteer cyclists: for the Italian case study, the Open Street Map network has been freely obtained and used; for the Dutch case study, the network compiled by the volunteers of Fietsersbond (a Dutch cyclists union) has been used. The “crowd-sourcing” approach for network database – also applied to other relevant information, e.g. land-use – allow to have larger – both in terms of area and in terms of detail – and more descriptive networks. Thus, more accurate models can be estimated for bicycle route choice, for example including route attributes (such as travel time, numbers of turns, and number of intersections, pavement, presence and type of bicycle facility, environment, etc.), trip attributes (time of the day, day of the week, trip purpose), and traveller attributes (gender, age, experience etc).
The next paragraphs provide a review of the existing studies in the areas of map matching, choice-set generation and route choice modelling.
2.2. Literature Background
2.2.1. Map-matching
The map-matching process consists of all those operations that transform a stream of GPS points to a road-network database to identify the traversed links in the chosen route. There are many map-matching algorithms proposed in literature, depending on the input data and on the application context. An extended review of map-matching algorithms applied to transportation research can be found it Quddus et al. In this review, map-matching algorithms have been categorized into three typologies: geometrical, topological and advanced. The geometrical approach is normally based on the distance between GPS points and network elements, edges or nodes (proximity-based algorithms): this approach
is rather uncomplicated in terms of implementation, but the accuracy and the stability of such algorithms is rather scarce. For example, Spissu et al (2011) implemented a GIS-based procedure, using proximity as the main criteria for matching the GPS points to the network: a spatial join was used to match the GPS points to the corresponding routes, and afterwards a manual inspection corrected the matching errors. The method found routes only for 58% of the trips. Unmatched trips were due to missing GPS points, inconsistent activity data and missing links in the roadway network. Furthermore, the main drawback of this methodology is the need of a manual check of the results.
Topological approaches, other than the sole distance, also take into consideration the sequence of GPS points and the connectivity of network elements. For example, some studies have applied the “shortest-path procedure”. Du (2005) proposed a method that predicts the chosen route by determining the shortest path satisfying network topology such as link location, connectivity, one-ways, and allowable u-turns. The method was implemented in ArcGIS and examined against 674 trips collected on 18 known routes of Lexington, KY. For a known OD pair, approximately 95% of the routes were constructed entirely. However, high computational times and manual interventions were needed. Finally, advanced map-matching procedures typically combine geometric and topological procedures with additional criteria, parameters, assumptions, probabilistic analysis, or optimization. For example, an advanced approach consists of taking into consideration the GPS measurement errors and constructing confidence regions around the points, based on data quality; then, only the edges within these regions are selected for evaluation. The evaluation can be based on a combination of different criteria, such as distance, speed or connectivity to the previously matched edges. The challenge for new and advanced map-matching procedures is to increase the accuracy while maintaining computational efficiency.
Marchal et al. (2005) proposed an algorithm that uses a multiple hypothesis technique (MHT).The MHT stores multiple paths during the process and in the end selects a path with the best score. The authors starts by calculating a “link score” by determining the distance of the link to the GPS point. The algorithm starts with finding a set of links that are closest