Unsaturated Soils – Alonso & Gens (eds) © 2011 Taylor & Francis Group, London, ISBN 978-0-415-60428-4
Shear strength of an unsaturated silty sand
F. Casini, P. Minder & S.M. Springman
Institute for Geotechnical Engineering, IGT-ETH, Zürich, Switzerland
ABSTRACT: This paper presents a series of direct shear tests performed on a silty sand at three differ-ent gravimetric water contdiffer-ents. The soil was sampled from test pits south of Ruedlingen in North East Switzerland, where a landslide triggering experiment was carried out on a 37°–40° steep forested slope through infiltration of extreme artificial rainfall. The aim of this work was mainly to establish a correla-tion between the degree of saturacorrela-tion and slope stability. Direct shear tests were performed on reconsti-tuted samples with a direct shear apparatus under undrained conditions for the water phase. Three of the samples were saturated after the shear phase in order to analyse the effect of wetting on shear strength. The results were interpreted with the assistance of a soil water retention curve (WRC) and an analytical slope stability analysis was performed to apply the laboratory results to the field experiment.
the slope. Some surface movements were detected during this extreme event, although failure did not occur. Subsequently, a range of measures was implemented, such as relocating the distribution of the sprinklers to provide more rainfall to the upper part of the slope, so that a failure mechanism was triggered in March 2009, incorporating about 150 m3 of debris (Springman et al. 2009; Casini
et al. 2010; Askarinejad et al. 2010).
It is essential to establish a suitable model for the shear resistance of the soil in order to conduct stability analysis. Shear tests performed by Minder (2008) on reconstituted samples are presented in this paper. They are interpreted based on a WRC by considering the influence of vertical load and water content. A simple slope stability analysis is also performed that takes the hysteresis of the WRC into account in respect to the suction acting on the shear plane.
2 MATERIAl TESTED 2.1 Soil characterisation
A series of sieve analyses of the soil from Ruedlin-gen has been carried out by Casini et al. (2008), paying special attention to its spatial variability (Springman et al. 2009; Casini et al. 2010). The soil can be classified as medium to low plasticity silty sand (Ml) according to USCS. The activ-ity, IA, is higher than 1.25 in the upper part of
the soil profile and decreases from IA = 1.25 to
IA = 0.75 with increasing depth. Activity of the soil
comes from the chloritic-smectitic clay fraction (Colombo 2009). The mean physical properties are summarised in Table 1.
1 INTRoDUCTIoN
landslides are a common natural hazard in steep mountainous terrain, such as that of Switzerland (Springman et al. 2003; lateltin et al. 2005; Spring-man et al. 2009). Experience in Hong Kong shows that they occur when short-duration rainfall is of high intensity (Brand et al. 1984; Finlay et al. 1997; Fannin et al. 2005). The location of the fail-ure is strongly influenced by spatial and temporal variations in seepage induced pore water pressure (Fannin et al. 2000). A clear understanding of the likely failure mechanisms is required for a reliable stability analysis, and characterization of the soil strength is essential over an appropriate stress range (Fannin et al. 2005). A slip can be caused by: a transient increase in pore water pressure gener-ated by subsurface seepage (Johnson & Sitar 1990); static liquefaction induced by small perturbation that leads to flow failure (Anderson & Sitar, 1995); reduction in negative pore pressures that requires the suction history of the soil to be taken into account (Springman et al. 2003).
A landslide triggering experiment was carried out near Ruedlingen in North East Switzerland along the river Rhine in autumn 2008 and spring 2009 to replicate the effects of a heavy rainfall event from May 2002, in which 100 mm rain fell in 40 minutes (Fischer et al. 2003), causing 42 super-ficial landslides.
The slope was subjected to extreme rainfall by artificial means in october 2008 over a period of 4 days, with a rainfall intensity of 15 mm/h for the first two days and an intensity of 30 mm/h for the last two days. The sprinklers were distrib-uted at constant spacing along the central line of
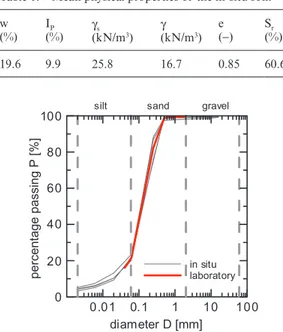
The soil was reconstituted based on a represent-ative grain size distribution (Figure 1), by mixing the fractions of the natural soil and omitting the fractions larger than 2 mm.
2.2 Sample preparation
The hand-mixed soil was passed through a 4 mm sieve before it was stored for 24 hours in a sealed bag in order to avoid large clods for being placed in the direct shear apparatus. After this homogenisa-tion phase, the wet soil was statically compacted in one 2 cm thick layer to a void ratio e = 0.9 by means of a hydraulic press. Figure 2 illustrates the steps of sample preparation.
The samples were statically compacted at three different target water contents of w = 15%, 20% and 25%. The compaction stress required to reach the same void ratio of e = 0.9 varied with water content. It ranged from 10 kPa (w = 25%) to 100 kPa (w = 15%) but was similar for samples with the same water content.
Depending on the remoulding water content, different degrees of sample homogeneity were obtained. Figure 3 shows a comparison between a homogeneous sample (w = 20%) with a wetter, macroporous sample (w = 25%).
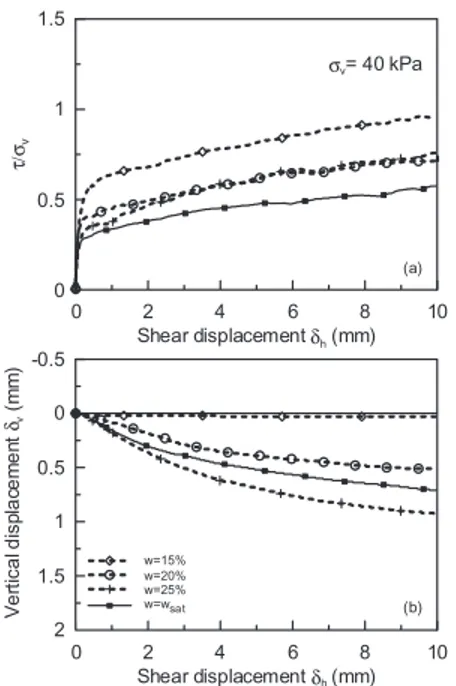
The shear tests were performed with a stand-ard direct shear apparatus at three vertical stresses
σv = 20 − 40 − 80 kPa, respectively. Three of the
samples were saturated after 6 mm horizontal
displacement in order to analyse the effect of the wetting on the mobilised shear strength.
The samples were sheared with a velocity v = 0.033 mm/min. This shear rate is fast enough to represent undrained conditions for the water phase. 3 ExPERIMENTAl RESUlTS
3.1 Shear tests
The results of the shear phase are shown in Figures 4, 5 and 6 in terms of the relation between normalised shear stress (τ/σv), vertical
displace-ment δv and shear displacement δh. A negative
vertical displacement indicates an increase in speci-men height.
Highest stress ratios are exhibited by two samples
at σv = 20 kPa and w = 15 and 20% (Figure 4a). Both
specimens show an increase in height (dilatancy) during shearing (Figure 4b). The soil reduces in vol-ume during the saturation of specimens at w = 20 and 25%, indicating wetting collapse (Figure 4b). In the subsequent shearing stage, the stress ratios are in good agreement with the saturated sample. Table 1. Mean physical properties of the in-situ soil.
w (%) I(%)P γ(kN/ms 3) γ (kN/m3) e (−) S(%)r 19.6 9.9 25.8 16.7 0.85 60.6 0.01 0.1 1 10 100 diameter D [mm] 0 20 40 60 80 100 percentage passing P [% ] in situ laboratory
silt sand gravel
Figure 1. Comparison between in situ and laboratory grain size distribution.
Figure 3. Sample homogeneity: (a) sample w = 20%; (b) sample w = 25%.
Figure 2. Sample preparation: (a) cloddy soil after mix-ing with water; (b) sieved soil; (c) shear box filled with soil; (d) compaction with hydraulic press.
The sample under σv = 80 kPa also reduces in
vol-ume during the saturation phase (Figure 6). The stress ratio for the equal water content decreases as the vertical stress increases. This is due to the combination of two effects. Firstly, increasing
vertical stress leads to a lower void ratio resulting in a higher degree of saturation and therefore less suc-tion. Secondly the overconsolidation ratio (oCR) is decreasing as the vertical stress increases. 3.2 Soil water retention curve
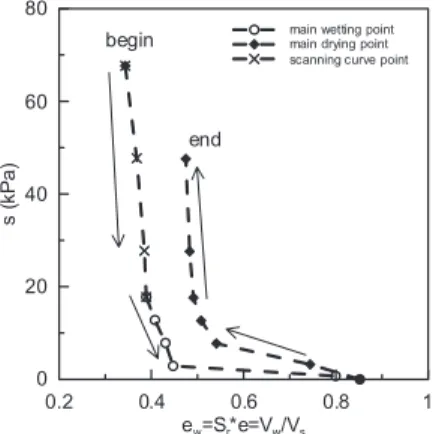
The Water Retention Curve (WRC) in terms of water ratio ew = Vw/Vs, where Vw is the volume of
water and Vs is the volume of solids, and suction
s = ua − uw; was obtained using a Fredlund
oedom-eter (Figure 7) under suction controlled conditions for a reconstituted sample with an initial void ratio e0 = 0.83 and w0 = 17%.
The volumetric state variable ew = Sre tends
towards the void ratio with increasing the degree of saturation Sr. The water ratio ew is obtained
directly in laboratory measuring the inflow or out-flow of water into a soil with a known volume of solids. In addition, ew remains constant in water
undrained tests in an equivalent concept to iso-choric tests, where e remains constant (Romero & Vaunat 2000).
The results are reported in Figure 8. A suction s = 70 kPa was applied as first step. Water was pressed out of the sample initiallly, which means that the compacted soil had a suction less than 70 kPa. The following three points seem follow a straight
line in the plane ew–s (which could be interpreted as
a scanning curve). The other points in wetting and in drying follow the respective main curves.
0 2 4 6 8 10 Shear displacementδh(mm) 0 0.5 1 1.5 τ /σv w=15% w=20% w=25% w=wsat saturation saturation 0 2 4 6 8 10 Shear displacementδh(mm) 2 1.5 1 0.5 0 -0.5 V er tic al di sp la ce m en tδv (m m ) σv= 20 kPa (a) (b)
Figure 4. Tests with σv = 20 kPa: (a) stress ratio and
(b) vertical displacement versus shear displacement.
0 2 4 6 8 10 Shear displacementδh(mm) 0 0.5 1 1.5 τ /σv w=15% w=20% w=25% w=wsat 0 2 4 6 8 10 Shear displacementδh(mm) 2 1.5 1 0.5 0 -0.5 V er tic al di sp la ce m en tδv (m m ) σv= 40 kPa (a) (b)
Figure 5. Tests with σv = 40 kPa: (a) stress ratio and
(b) vertical displacement versus shear displacement.
0 2 4 6 8 10 Shear displacementδh(mm) 0 0.5 1 1.5 τ /σv w=15% w=20% w=25% w=wsat saturation 0 2 4 6 8 10 Shear displacementδh(mm) 2 1.5 1 0.5 0 -0.5 V er tic al di sp la ce m en tδv (m m ) σv= 80 kPa (a) (b)
Figure 6. Tests with σv = 80 kPa: (a) stress ratio and
4 DATA INTERPRETATIoN 4.1 Water retention curve
The data reported in Figure 8 was modelled with a multimodal Durner model (1994) that describes the retention characteristics of soils with hetero-geneous pore systems. The multimodal retention function is constructed by a linear superposition of subcurves of the Van Genuchten type:
e e e e w s w wres wsat wres i i k ni mi − − = + =
∑
1 1 1 ( )α (1)where k is the number of “subsystems” that form
the total pore-size distribution, and wi are
weight-ing factors for the subcurves, subject to 0 < wi < 1
and ∑wi = 1. As for the unimodal curve, the
param-eters of the subcurves (αi, ni, mi) are subject to the
conditions (αi > 0, mi > 0, ni > 1. The parameter mi
is assumed to be mi = 1 − 1/ni.
A bimodal retention function was chosen, because the soil was compacted on the “dry part” of the Proctor curve, which usually leads to a bimodal distribution of voids. This assumption is also supported by Mercury Intrusion Porosimetry (MIP) tests performed by Colombo (2009).
The comparisons between the model for drying and wetting curves and the laboratory results are reported in Figure 9 and the resulting parameters are given in Table 2.
4.2 Shear strength envelope
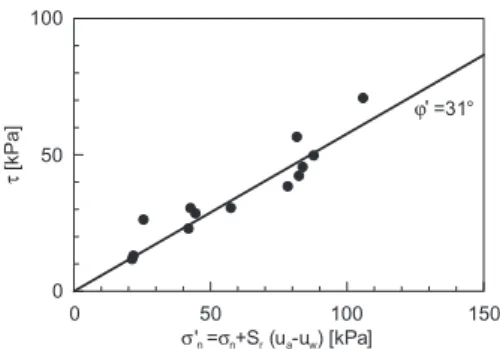
The shear strength of an unsaturated soil can be espressed using many different approaches (e.g. Miao et al. 2001; Vaunat et al. 2002). A predic-tion based on the WRC was chosen here (Öberg & Sällfors 1997; Springman et al. 2003):
τ = (σn – ua)tan ϕ ′ + Sr(ua – uw)tan ϕ ′ (2)
where σn is the total normal stress, ua is the air
pres-sure, uw the pore water pressure, Sr is the degree of
saturation and ϕ’ is the friction angle of the mate-rial. The quantity Sr(ua − uw) was obtained using the
WRC. For each test known ew and e, it was obtained
the suction and the degree of saturation Sr = ew/e.
The comparison between the prediction and the laboratory data are shown in Figure 10. The
meas-0.2 0.4 0.6 0.8 1 ew=Sr*e=Vw/Vs 0 20 40 60 80 s (kP a)
main wetting point main drying point scanning curve point
begin
end
Figure 8. WRC of the reconstituted Ruedlingen soil.
0 0.2 0.4 0.6 0.8 1 ew=Sr*e=Vw/Vs 0 20 40 60 80 100 s (kPa )
scanning curve point main wetting main drying
Figure 9. Multimodal function for the water retention curve.
Table 2. Parameter durner model. w1 a1 (kPa–1) n 1 a2 (kPa–1) n 2 ewsat ewres drying 0.53 0.27 3.3 0.014 7 0.85 0.15 wetting 0.65 0.86 3.3 0.022 2.9 0.85 0.15
Figure 7. oedometer-type pressure plate apparatus (after Perez Garcia et al. 2008).
ured points are reasonably well fitted with a linear envelope using Equation 2 with a ϕ′ = 31°. 4.3 Slope stability analysis
In order to apply the laboratory results to the test side in Ruedlingen a simplified slope stability anal-ysis is carried out with shear strength determined under unsaturated conditions for homogeneous ground. Extending the approach of Springman et al. (2003) to a laterally limited slide, the factor of safety FoS becomes:
FoS K z K z c z d d z =
(
+ ⋅)
+ ′ +(
⋅)
*cos cos( ) tan cos ( )
tan
2α 1 2 α γ ϕ 1 3α
γ α
(3) where c* = Sr(ua − uw) tan ϕ ′, α is the inclination
of the slope, z the depth of the sliding surface, d the width of the slope, K the earth pressure coef-ficient. The groundwater table is assumed to lie below the sliding surface and the lateral sides can fully mobilise the shear resistance according to Equation 2.
In the following parametric evaluation of Equa-tion 3 a slope inclinaEqua-tion of α = 38°, a width of d = 8 m, a void ratio e = 0.9 and an earth pressure of K = 1 − sin(ϕ)(ϕ ′ = 31°) were chosen as repre-sentative values for the field conditions.
The depth, for which the factor of safety reaches unity, is plotted in Figure 11 versus the. All points to the left of the curves represent stress states where the shear stress exceeds the shear resistance. Shallow slides are stable due to the apparent cohe-sion provided by suction, whereas very deep slides are unlikely to happen due to the friction mobi-lised on the planes of the failure mechanism. The difference between drying and wetting conditions originate from different degrees of saturation and unit-weight at same suction.
When plotting the critical depth z (FoS = 1) versus the degree of saturation (Figure 12), the difference
between the drying and the wetting branch of the WRC becomes more evident. During a rainfall event, the soil is saturated gradually. When a
suc-tion s = 2.9 kPa and Sr = 0.55 are exceeded, a sliding
surface is formed at a depth of about 1.12 m. 5 CoNClUSIoN
A triggering landslide experiment was conducted in north-east Switzerland. In order to character-ise the strength of the soil, a series of direct shear tests were conducted at three constant water con-tent and vertical stresses. Three samples were also saturated for a better understanding of the effect of saturation. 0 50 100 150 'n= n+S σ σ r(ua-uw) [kPa] 0 50 100 ' =3 ϕ 1° τ [kPa]
Figure 10. Shear strength envelope using the WRC.
Figure 11. Depth z for FoS = 1 for the drying and wet-ting branch is plottet as a function of suction.
Figure 12. Depth z for FoS = 1 for the drying and wetting branch is plotted as a function the degree of saturation.
The results were interpreted with the help of a water retention curve obtain under suction con-trolled conditions. They are well fitted with a Mohr Coulomb criteria with the use of Bishop stress with
parameter χ = Sr and a critical state friction angle
of ϕ ′ = 31°. During the saturation phase, all three samples showed a decrease in height indicating a wetting collapse that decreases as the water con-tent increases. The normalised shear stress (τ/σv)
decreases, for the same gravimetric water content; as the vertical stress increases due to a lower void ratio and hence a higher degree of saturation and lower suction.
A slope stability analysis was performed using the same approach as Springman et al. (2003) but extended to a laterally limited slide. A critical depth z = 1.12 m is obtained for a suction of 2.9 kPa. All the other depths investigated needed less suction for a safety of factor FoS = 1.The approach used is quite simple with all the limitations of limit equilib-rium analyses. But it can be applied to predict the zone of potential failure, which in the field experi-ment was located at a depth z ∼ 1.25 m. The suc-tion mobilised at failure was lower than the critical value determined here. This is due to a more com-plex response of the soil in the field in comparison to the constraints of the laboratory sample and its reconstitution.
ACKNoWlEDGEMENTS
This research was funded by the Competence Centre for Environment and Sustainability (CCES) within the framework of the TRAMM - Project. The authors are grateful to Amin Askarinejad, lorenzo Colombo, Peter Kienzler, Marco Sperl, Ernst Bleiker for their contribution to the field and laboratory studies. We are also most grateful to the Gemeinde Ruedlingen and their President Katy leutenegger for giving permission to carry out this experiment on their land.
REFERENCES
Anderson, S.A., Sitar, N. (1995). Shear strength and slope stability in a shallow clavey soil regolith. In Haneberg W.C., Anderson S.A. (eds): Reviews in Engin. Geology,
Vol. X: Clay and Shale Slope Stability.
Askarinejad, A., Casini, F., Kienzler, P., Springman, S.M. 2010. Comparison of the in situ and laboratory water retention curves for a silty sand (this issue).
Brand, E.W., Premchitt, J., Phillipson, H.B. 1984. Rela-tionship between rainfall and landslides in Hong Kong. Proc. 4th Int. Symp. on Landslides 1: 377–384. Casini, F., Jommi, C., Springman, S.M. 2010. A
labora-tory investigation on an undisturbed silty sand from a slope prone to landsliding. Granular Matter 12(3):
303–316.
Casini, F., Kienzler, P., Askarinejad, A., Springman, S.M., 2008. laboratory results. IGT CCES-TRAM: 1–13. Colombo l. (2009), large shear box for analysing
strength mobilisation in unsaturated conditions.
Mas-ter Thesis, Politecnico di Milano.
Durner W. (1994), Hydraulic conductivity estimation for soils with heterogeneous structure. Water Resources
Research. 30(2): 211–223.
Fannin, R.J., Eliadorani, A., Wilkinson, J.M.T. 2005. Shear strength of cohensionless soils at low stress.
Géotechnique 55(6): 3–10.
Fannin, R.J., Jaakkola, J., Wilkinson, J.M.T., Hetherington E.D. 2000. The hydrological response of soils to rainfall at the Carnation Creek water-shed, Brititsh Columbia. Water Resour. Res. 36(6): 1491–1494.
Fischer, C., lópez, J., Springman, S.M. 2003. Remedia-tion of an eroded steep slope in weathered sandstone after a major rainstorm. Intern. Conf. on Land., Hong
Kong:. 878–883.
Finlay, P.J., Fell, R., Maguire, P.K. 1997. The relationship between the probability of landslide occurrence and rainfall. Can. Geotech. J. 34(6): 811–824.
Johnson, K.A., Sitar N. 1990. Hydrologic conditions leading to debris flow initiation. Can. Geotech. J.
27(6): 789–901.
lateltin o., Haemmig Ch., Raetzo H., Bonnard Ch. 2005 landslide risk management in Switzerland.
Journal of the International Consortium on Landslides, 2(4).
Miao, l., Yin, Z., liu, S., 2001. Empirical function rep-resenting the shear strength of unsaturated soils.
Geo-tech. Testing Journal 24: 220–223.
Minder, P. (2008). Shear resistance of silty sand from the Rüdlingen monitoring and triggering test site.
Semes-ter thesis, ETH, Zurich.
Öberg, A., Sällfors, G. 1997. Determination of shear strength parameters of unsaturated silts and sands based on the water retention curve. Geotech. Test. J. 20(1): 41–48.
Perez-Garcia, N., Houston, S.l., Houston, W.N., Padilla, J.M. 2008. An oedometer–type Pressure Plate SWCC Apparatus. Geotechnical Testing Journal 31: 1–9. Romero, E., Vaunat, J. 2000. Retention curves of deform-able clays. Intern. Work. On Unsat. Soils: Exper. Ev. &
Theoretical Approaches in Unsat. Soils, Trento, Italy:
91–106. Tarantino A, Mancuso C (eds), Balkema Rotterdam.
Springman, S.M., Jommi, C., Teysseire P. 2003. Instabili-ties on moraine slopes induced by loss of suction: a case history. Géotechnique 53(1): 3–10.
Springman, S.M., Kienzler, P., Casini, F., Askarinejad, A. 2009. lanslide triggering experiment in a steep for-ested slope in Switzerland. In Hamza M., Shaien, M., El-Mossallamy Y. (eds):: Proc. of the 17th Intern.
Conf. on Soil Mech. and Geotech. Engin., Egypt, 5–9 Oct.. IoS Press.
Vaunat, J., Romero, E., Marchi, C., Jommi, C. 2002. Modeling the shear strength of unsaturated soils.
3rd Intern. Conf. on Unsaturated Soils, 2: 245–251. Balkema.