Master of Science in Management Engineering
AY. 2018/2019
MASTER THESIS
Big Data Quality:
Stock Market Data Sources Assessment
Supervisor:
BARBARA PERNICI
Co-supervisors: CINZIA CAPPIELLO
VALTER BERNARDINI
Master’s thesis of:
MOHAMED ELFAKHFAKH
Student ID: 903157
i
Acknowledgement
I would like to express my deepest gratitude to my supervisor, Prof. Barbara Pernici, for her valuable guidance, her continuous support and insightful knowledge and considerable encouragements throughout the whole period of this work. I really do appreciate your efforts. I would also like to thank Prof. Cinzia Cappiello for her useful and constant help, support and effort.
Additionally, I would love to extend my sincere thanks to Mr. Valter Bernardini for his continuous support and guidance. Mr. Marc Carazzato, thank you for doing everything to make this thesis work. The physical and technical contribution of ‘Assioma.net’ is truly appreciated.
A special thanks to my fiancée, Mariam Abdelaty, who is and has been the best partner I could ever ask for. Thank you for believing in me, your continuous support and help in the thesis. I could have never done this without you.
To my mother, your unconditional love has carried me through every moment of my life. Even though you are no longer with us, your soul has always guided me to be the best version of myself.
Finally, to all my family, friends and colleagues, I cannot thank you enough for everything you have done to me throughout the thesis. Thank you for your continuous support and encouragement whenever needed.
ii
Abstract
Nowadays, the stock market data is used widely for various purposes. Companies, investors, and traders are very interested in understanding the stock prices trend. This data affects the decision-making process. Thus, high quality is essential. Since, there are many sources providing the stock market data. We proposed a model to assess the data quality of different stock market data sources, ranking them, and choosing the most reliable one. Moreover, we developed a predictive model using Long-Short Term Memory (LSTM) architecture to predict the missing values in that source, in order to enhance its quality. Three main dimensions were used to assess the quality, namely, completeness, consistency and accuracy. We introduced a Quality Indicator (QI) index to rank the sources. The data were collected from four sources: Yahoo Finance, MSN Money, Stooq and Tiingo. The collected data is focusing on 60 companies in NASDAQ stock market over a period of 10 months from January 2019 to October 2019. The quality glitches were mainly in the completeness and accuracy dimensions, and no glitches were found in the consistency dimension, resulting to choose Yahoo Finance as the most reliable source. In addition, we used the predictive model on a sample of three companies, to fill in the missing days in the chosen source.
Keywords: Data Quality, Data quality dimensions, Stock market, Quality indicator,
iii
Table of Contents
Chapter 1: Introduction ... 1
1.1 Motivation ... 1
1.2 Aim of the Thesis ... 1
1.3 Thesis outline ... 2
Chapter 2: State of Art ... 3
2.1 Introduction to Big Data ... 3
2.2 Introduction to the concept of DQ ... 4
2.3 effect of poor-quality DQ ... 5
2.3.1 Disasters caused by poor DQ ... 5
2.3.2 How poor DQ affects businesses ... 7
2.4 Data Quality management (DQM) ... 8
2.5 Data Quality Dimensions ... 9
2.5.1 Intrinsic Dimensions ... 10
2.5.2 Contextual Dimensions ... 11
2.6 Approaches to Data quality Dimensions ... 11
2.6.1 Theoretical Approach... 12
2.6.2 Empirical Approach ... 12
2.6.3 Intuitive Approach ... 13
2.7 Changes in Data quality ... 14
2.8 Data quality models ... 16
2.8.1 Total DQ Management (TDQM) ... 17
2.8.2 Information Integrity Methodology (IIM) ... 17
2.8.3 AIM Quality model (AIMQ) ... 17
2.8.4 DQ Management Maturity Model (DQMMM) ... 18
2.8.5 Complete DQ Management (CDQM) ... 18
2.9 Different techniques to deal with data... 19
2.9.1 Quality Assessment using batch processing ... 20
2.10 Measuring data quality ... 22
2.10.1 Domains presented by the Data quality Literature ... 23
2.10.2 Measuring data quality and data quality dimensions ... 24
iv
2.11 Deep learning in Stock market data forecast ... 48
Chapter 3: Methodology ... 51
3.1 The implemented model ... 51
3.1.1 DQ basics phase ... 54
DQ dimensions and metrics ... 54
3.1.2 Data preparation phase ... 59
Data collection step ... 59
Data pre-processing step ... 59
Chapter 4: Model Implementation ... 61
4.1 data preparation ... 61
4.2 DQ assessment phase ... 65
4.3 Sources evaluation phase ... 65
4.4 Predictive model ... 65
Chapter 5: Results ... 68
5.1 First scenario: TOP 20 COMPANIES in nasdaq ... 68
5.1.1 Completeness dimension ... 68
5.1.2 Consistency dimension ... 68
5.1.3 Accuracy dimension... 69
5.1.4 Summary ... 74
5.2 Second scenario. MEDIUM SIZE COMPANIES... 74
5.2.1 Completeness dimension ... 74
5.2.2 Consistency dimension ... 79
5.2.3 Accuracy dimension... 79
5.2.4 Summary ... 86
5.3 Third scenario: SMALL AND MICRO COMPANIES ... 87
5.3.1 Completeness dimension ... 87
5.3.2 Consistency dimension ... 89
5.3.3 Accuracy dimension... 89
5.3.4 Summary ... 96
5.4 The three scenarios comparison ... 96
5.5 Predictive model results ... 97
Chapter 6: Conclusion and future work ... 100
6.1 Conclusion ... 100
v
List of Figures
Figure 2.1: The Five V's of big data [9] ... 4
Figure 2.2: DQ word cloud ... 5
Figure 2.3: O-ring Leakage [2] ... 6
Figure 2.4: Number of correct data records for a study involving 75 executives [13] . 8 Figure 2.5: DQM process ... 9
Figure 2.6 Practical dimensions of DQ [15] ... 10
Figure 2.7: Data Quality architecture presented by [35]... 21
Figure 2.8: Quality Rules Discovery Framework [37] ... 22
Figure 2.9: The domain of studies [31] ... 23
Figure 2.10: Mapping between dimensions of DQ and DQ assessment methods[44] 31 Figure 2.11 Networked Grouping of Information Quality Criteria [46] ... 33
Figure 2.12: The model used in [51] ... 37
Figure 2.13: The data quality axes [55] ... 40
Figure 2.14: RNN simple cell versus LSTM cell [66] ... 50
Figure 3.1: (a) Sources assessment model, (b) Predictive model ... 53
Figure 4.1: LSTM model architecture ... 66
Figure 5.1: The constraints types for all sources(Top 20 Companies) ... 69
Figure 5.2:The maximum error value for the three quarters in Stooq (Top 20 Companies) ... 70
Figure 5.3: The error distribution for the third quarter in Yahoo (Top 20 companies)70 Figure 5.4:Error distribution across all quarters in Stooq (Top 20 Companies) ... 71
Figure 5.5: The error count for each company in Stooq (Top 20 Companies) ... 72
Figure 5.6: The error count across the whole period for all sources (Top 20 Companies) ... 73
Figure 5.7: The MSE for all quarters in all sources (Top 20 Companies) ... 73
Figure 5.8: Count of missing values for all sources (Medium companies) ... 75
Figure 5.9: missing in NEBU for the first and second quarters in Tiingo (Medium companies) ... 75
Figure 5.10: missing values in BMLP and NEBU across all quarters in Stooq (Medium companies) ... 76
Figure 5.11:The missing days in the MSN source for each company ... 77
Figure 5.12:Heatmap for Stooq and MSN sources (Medium companies) ... 78
Figure 5.13:Number of excess days reported in MSN (Medium companies) ... 79
Figure 5.14:Yahoo error distribution for the third quarter(Medium companies) ... 80
Figure 5.15:Tiingo error distribution for the third quarter(Medium companies) ... 81
Figure 5.16: Maximum error values for all the sources across the quarters(Medium companies) ... 81
Figure 5.17:The count of the error per company for Stooq is on the left side, while the mean error per each company is a on the right (Medium companies) ... 82
Figure 5.18: Error distribution in Stooq for all quarters(Medium companies) ... 83
Figure 5.19: Number of errors in MSN for each Company (Medium Companies) ... 83
vi Figure 5.21: The Error distribution in the first quarter of a sample company in
MSN(Medium companies)... 84
Figure 5.22:Error count for all sources in each quarter (Medium) ... 85
Figure 5.23: MSE for all sources across the quarters (Medium) ... 86
Figure 5.24:Number of missing values for each source (Small-Micro companies) .... 88
Figure 5.25:Reported days in Yahoo for ONTO Symbol (Small-Micro companies) .. 88
Figure 5.26:On the left side is the number of missing values per company while on the right side is the missing values for WSC across the year (Small-Micro companies) .. 88
Figure 5.27: Extra reported days in MSN for each company (Small-Micro companies) ... 89
Figure 5.28:Error Distribution in Stooq for each period (Small-Micro companies) ... 90
Figure 5.29: The number of errors in Stooq for each company (Small-Micro companies) ... 91
Figure 5.30:The number of errors in MSN for each company (Small-Micro companies) ... 91
Figure 5.31: Error distribution in Tiingo for the first and the second quarter (Small-Micro companies) ... 92
Figure 5.32: The number of errors in Tiingo for each company (Small-Micro companies) ... 92
Figure 5.33:Error distribution in MSN for each period (Small-Micro companies) ... 93
Figure 5.34:the number of errors in each source for each quarter (Small-Micro companies) ... 94
Figure 5.35: MSE in all sources for each quarter (Small-Micro companies) ... 95
Figure 5.36:The number of errors in Tiingo and MSE without the NTIC symbol (Small-Micro companies) ... 95
Figure 5.37: The predictive vs the real in Alcoa Corp ... 98
Figure 5.38: The predictive vs the real in Almaden Minerals Ltd ... 99
vii
List of Tables
Table 2.1: Three V's definition ... 3
Table 2.2 Dimensions proposed in the empirical approach [17] ... 12
Table 2.3: Dimensions proposed in the intuitive approach [18] ... 13
Table 2.4:Ten potholes on Information Quality [22] ... 15
Table 2.5: Quality-in-use model for Big Data based on ISO 25012 [23] ... 16
Table 2.6 Strengths and Weaknesses of DQ [30] ... 19
Table 2.7: Dimensions measurements and weights [39] ... 25
Table 2.8: The metrics for semantic accuracy [43]... 28
Table 2.9:The metrics for syntactic accuracy [43] ... 29
Table 2.10:The metrics for uniqueness [43] ... 29
Table 2.11:The metrics for consistency [43] ... 29
Table 2.12:The metrics for completeness [43] ... 30
Table 2.13: The summary for the DQ dimensions, the approach and the selected domain used for nonfinancial publications ... 35
Table 2.14: Three case studies in [54] ... 39
Table 2.15: Types of constraints proposed by [5]... 42
Table 2.16: List of the attributes examined in[6] ... 44
Table 2.17: The summary for the DQ dimensions and the approach used for financial publications ... 47
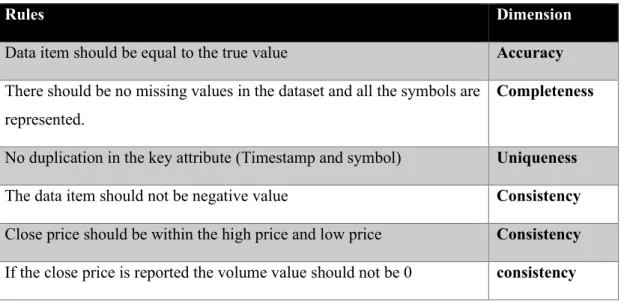
Table 3.1: The rules the dataset should meet and the affected dimension ... 54
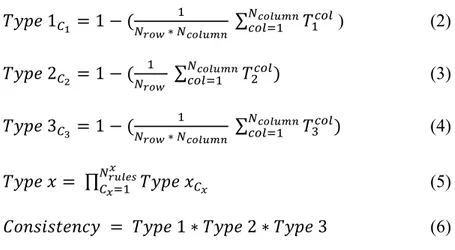
Table 3.2: The list of constraints to be calculated in each constraint type ... 57
Table 4.1: Companies classification by market capitalization provided by NASDAQ [77] (M: Million, B:Billion) ... 62
Table 4.2: The top 20 companies of the first scenario ... 62
Table 4.3: The second scenario list of companies ... 63
Table 4.4: The Third scenario list of companies... 63
Table 4.5: The standard calendar quarters that make up the year [79] ... 65
Table 4.6: Sample data for GE used as input in the predictive model ... 66
Table 4.7: The final chosen hyperparameter for the LSTM model ... 67
Table 5.1: Statistical summary for error in all sources(Top 20 companies) ... 70
Table 5.2: Accuracy dimension values for each source (Top 20 companies) ... 74
Table 5.3: Dimensions summary for the first scenario ... 74
Table 5.4:The count of missing values in NEBU and BMLP companies in Stooq (Medium companies) ... 76
Table 5.5: The count of missing values in NEBU and BMLP companies in MSN source ... 77
Table 5.6:Statistical summary for the error in each quarter for all sources (Medium companies) ... 80
Table 5.7:Accuracy dimensions values for each source (Medium companies) ... 86
Table 5.8:Dimensions summary for the second scenario ... 87
Table 5.9: The statistical parameter of error distribution for all sources across quarters (Small-Micro companies) ... 90
Table 5.10: Accuracy dimensions for all sources (Small-Micro companies) ... 96
viii Table 5.12: The QI for all the sources in each scenario ... 97
ix
List of Terms
AIMQ AIM Quality Model
ARCH Autoregressive conditional heteroscedastic ARIMA Autoregressive Integrated Moving Average ARMA Autoregressive Moving Average
CDQM Complete DQ Management
DL Consecutive Changes
CNN Convolutional Neural Network DMA Data Management Association
DQ Data Quality
DQES Data Quality Evaluation Scheme DQM Data Quality Management DQR Data Quality Rules
DQMMM DQ Management Maturity Model EHR Electronic Health Record
ETL Extract Transfer Load FIT Feed Inspection Tool Q1 First Quarter
Q4 Fourth Quarter
GQM Goal Questions Metric
IIM Information Integrity Methodology IP Information Protocol
IQ Information Quality ICs Integrity Constraints IOT Internet of Things
LOD Linked Open Data
LSTM Long-Short Term Memory Market Cap Market Capitalization MSE Mean Squared Error MLP Multi-Layer Perceptron NASDAQ
National Association of Securities Dealers Automated Quotations
NYSE New York Stock Exchange NMSE Normalized Mean Squared Error
SP Price Spread
PSP Product and Service Performance Model QI Quality Indicator
RNNs Recurrent Neural Networks RIS Research Information Systems
Q2 Second Quarter
STD Standard Deviation
LG Successive Trends
Q3 Third Quarter
TAR Threshold Autoregression TDQM Total DQ Management
1
Chapter 1:
Introduction
1.1 MOTIVATION
No doubt that the world we are living in today is being driven by data more and more every year. According to a report done by McKinsey Global Institute (MGI): The age of analytics: Competing in a data-driven world [1]; data volume continues to double every three years as information emanates from digital platforms, wireless sensors, applications for virtual reality, and billions of mobile phones. Capacity for data storage has increased while costs have dropped. Consequently, businesses do not have to go on gut instinct anymore; they can use data and analytics to make decisions quicker and accurate predictions backed by an enormous amount of evidence.
In order to exploit the power of data we must validate its quality. Poor Data Quality (DQ) can be the reason of tragic disasters e.g. space shuttle Challenger and the USS Vincennes/Iranian Airbus disasters [2]. Both businesses and economy can be affected by the quality of the data as well. IBM estimated a whopping 3.1 trillion US dollars as the cost of poor DQ on the US economy in the year 2016 alone [3]. It has also operational impacts like lowering customer satisfaction, typical impacts like difficulties to implement data warehouses, and strategic impacts like difficulties to set and implement the strategy [4]. As a result of the aforementioned reasons, DQ has been a thriving point of research lately with several applications in various domains.
1.2 AIM OF THE THESIS
The financial health of a company can be determined from its stock price and its trend. An increase in the company’s profit may lead to the rising of its stock price, whereas a huge amount of debt may lead to the opposite. So, it is very important for the investors and the shareholders to monitor the stock prices for all the companies they are interested/invested in.
There is an enormous number of sources that provide stock prices. Some are offered free of charge, while others should be paid for to be granted access. The data is available in many formats as well, which make it more challenging to maintain its
2 quality. The DQ can be assessed minute by minute [5] or it can be assessed day by day [6], in this thesis end of the day data has been used to assess the DQ.
The main objective of the thesis is to assess the quality of different sources providing stock market data, more specifically NASDAQ (National Association of Securities Dealers Automated Quotations) stock market, to rank them and identify the most reliable source to be used in any application. The datasets gathered from these sources will be compared to the ground truth to evaluate its quality. The ground truth will be the dataset provided form the NASDAQ official website, which is the original source of the data and the only credible one. The ground truth is a single true value. The examined data is a 10 months period from January 2019 to October 2019. The quality assessment for the sources will be conducted using the proposed model in Chapter 3. It has four phases, namely, DQ basics phase, data preparation phase, DQ assessment phase, and sources evaluation phase.
DQ assessment phase is performed on three different scenarios, categorized based on the company size that can be expressed by its Market Capitalization (Market Cap). The three classification are Top 20 companies, medium companies, small and micro companies, with Market Cap of greater than 10B$, form 2B$ to 10B$, from 300M$ to 2B$ and less than 300M$ respectively. For the second and the third scenario the companies are chosen randomly from different geographical areas and different industries to ensure the presence of all possible ranges of companies.
A predictive model using Long-Short Term Memory (LSTM) is developed by using the historical data of the past years as input. This model is used to predict the stock price in a specific day which could be missing in the most reliable source to make the source more reliable in order to be used in any application.
1.3 THESIS OUTLINE
In Chapter 2, an overview on the DQ and its management along with the DQ assessments are presented. Afterward, the methodology used to assess the quality and its steps are illustrated in Chapter 3. Followed by the implementation steps of the model and the used tools are discussed in Chapter 4. Then in Chapter 5, the proposed model’s results are shown and analysed. Finally, the conclusion and future work will be mentioned in Chapter 6.
3
Chapter 2:
State of Art
2.1 INTRODUCTION TO BIG DATA
In the recent years, big data has emerged as one of the trendiest topics with numerous applications in a multitude of fields ranging from daily tasks to space exploration. The data analytics giant SAS defines big data as a “large volume of data – both structured and unstructured – that inundates a business on a day-to-day basis” [7]. According to SAS, the term “big data” refers to data that is so large, fast or complex that it’s difficult or impossible to process using traditional methods [7].
Big data has been introduced in terms of the three V’s [8]: volume, velocity, and variety. The elaboration of each one is shown in Table 2.1.
Table 2.1: Three V's definition
The 3 V’s Definition
Volume The amount of data needed to be stored compared to the possibility of storing and managing it.
Velocity The calculation speed required to process the data relative to the rate of receiving the data.
Variety The number of the different formats included in the data.
Most of the big data definitions focus on these three V’s, although, lately they have added 2 more attributes to define data quality, namely, veracity and value [9] as shown in Figure 2.1. By analyzing big data, valuable information can be extracted, the results of such an analysis are hardly reliable unless well-defined. Moreover, proper verification and quality control mechanisms are applied to the data before it is used.
4
Figure 2.1: The Five V's of big data [9]
2.2 INTRODUCTION TO THE CONCEPT OF DQ
A term that is usually associated with big data is DQ. Data is considered of high quality if it correctly reflects the real-world status, allows the party using the data to effectively get useful insights that help to determine the clients’ needs and to find the best ways to serve the clients.
DQ does not necessarily mean zero defects, but it is the conformance of data to valid requirements. Therefore, we must determine who sets the requirements, the rules by which the requirements are set, and the degree of conformance needed by these requirements [10]. In short, DQ is the assessment of how much the data is usable and fits its serving context. In Figure 2.2, the word cloud for the most common words related to data quality is presented.
5
Figure 2.2: DQ word cloud
2.3 EFFECT OF POOR-QUALITY DQ
DQ is crucial for business intelligence and other data analytics. It leads to a high operational efficiency and a better customer relationship. In the information technology field, it helps to increase the accuracy of the system or of the software used; the better the DQ the more reliable results you get. Basically, if the data is flawed the results will be flawed, hence, the decisions most probably will be flawed as well. But what could really happen if the quality of the data is not good? In this section we will discuss the consequences of poor DQ with a real-life disaster and how it can affect the businesses.
2.3.1 Disasters caused by poor DQ
When the data is flawed, which means that its quality is not good, it may lead to life-threatening decisions. These wrong decisions may lead to a serious disaster not just to the business, like losing profit and bad customer relationship but also could affect human lives.
There are two well-known disasters, namely, the space shuttle Challenger and the USS Vincennes/Iranian Airbus disasters. They have been mentioned in many newspapers as well as in the literature, however, not many focused on the problem of DQ which is one of the main reasons that caused these disasters. The authors of [2] they focused on these reasons from a DQ perspective.
6 NASA launched the space shuttle Challenger on 28 January 1986, however, there was an internal debate about the safety of the O-rings in cold temperatures. The committee that investigated this disaster reported that the main reason causing it was due to a flawed decision-making process. Mainly, allowing the rocket’s launch while there was an evidence of a possible problem. This led to a leakage as shown in Figure 2.3. These flaws in the decision process are mainly due to the following quality issues: accuracy, completeness, consistency and relevance [2]. Not only the DQ issue was the reason for this disaster, but also other theories have highlighted narcissism and the organization decay, information format, interaction of images and technology as reasons for the disaster [4].
Figure 2.3: O-ring Leakage [2]
The accuracy problem was highlighted by the erroneous identification of the O-rings. As it was reported that one manager has declared that the problem of the O-rings was solved without any evidence or consent of doing that. On the other hand, the consistency problem was presented in the O-rings misclassification. In some cases, the equipment needed for the O-rings were marked as redundant, while in other cases they were not.
The USS Vincennes took down an Iranian Airbus on 3 July 1988 by mistake, results of killing 290 civilians. Several justifications have been given as a reason to mistake a civilian aircraft to a fighter like inexperienced crew having poor reaction to combat, insufficient time to verify data, incomplete training and hostilities in the area
7 that created an environment conductive to incorrect interpretation. Although the main reason was the poor DQ, specifically in these dimensions: accuracy, completeness, consistency and timeliness. [2]
It is obvious that the DQ was not an important aspect to get the attention of the decision-making board in both cases. As mentioned in [2] there were 10 glitches spread over five quality dimensions for Challenger case like the erroneous identification of the O-rings in the accuracy dimension and there were eight glitches spread over five quality dimensions for the USS Vincennes case like the error of the their system that said that the aircraft is in ascending mode while the crewmen operating on separate console reported that the aircraft is in descending mode and this affects the accuracy dimension. Given that it is difficult to believe that a proper decision could be made with the existence of glitches in the dataset.
2.3.2 How poor DQ affects businesses
Poor-quality data cause good decision making to be so much harder and a lot more costly to the business. Thomas C. Redman in his book “data driven” introduced the so-called “rule of 10”, which provides a simple way to estimate the extra costs of bad decisions taken due to a DQ problem. Redman observed that it costs 10 times as much to complete a unit of work when the input data are defective as it does when they are perfect [11]. Thus, someone who’s using a dataset with 80% good data will take good decisions with no added effort 80% of the time, but 20% of the time it will cost about 10 times as much to make corrections and to complete the work.
IBM estimated a whopping 3.1 trillion US dollars as the cost of poor-quality data on the US economy in the year 2016 alone [3]. The reason poor-quality data costs so much is that decision makers, managers, knowledge workers, data scientists, and others must accommodate it in their everyday work. And doing so is both time-consuming and expensive. The data they need has plenty of errors, and in the face of a critical deadline, many individuals simply make corrections themselves to complete the task at hand. They do not think to reach out to the data creator, explain their requirements, and help eliminate root causes [12]. Using poor-quality data can as well lead to some non-financial impacts such as the loss of credibility for your business, customer dissatisfaction, and increasing risk levels.
8 In a study that was done over a 2 years period and was published in the Harvard business review, involving 75 executives from different businesses and departments, only 3% found that their department fell within the acceptable range of 97 or more correct data records out of 100 (DQ score) [13]. The findings of the study can be seen in Figure 2.4. The study found that on average, 47% of the newly created data records have at least one critical (e.g., work-impacting) error [13].
Figure 2.4: Number of correct data records for a study involving 75 executives [13]
From a managerial point of view, these results can be scary as whether, as a manager, you see it or not, most data are bad unless you take the right measures to make sure your data is of high quality.
2.4 DATA QUALITY MANAGEMENT (DQM)
The Data Management Association (DAMA) defines data management as “the business function that develops and executes plans, policies, practices, and projects that acquire, control, protect, deliver, and enhance the value of data” (DAMA, 2011, p. 78). From DAMA point of view, DQ management is a function within the overall scope of data management.
As mentioned in the previous section, poor-quality data can lead to poor decisions. Hence, DQM is an essential process for any business as it can save a lot of time and money. DQM is a set of practices that aim at maintaining a high quality of the
9 information and make sure the used data is relevant, reliant and accurate. A DQM program establishes a framework for all departments in the organization that provides, and sometimes enforces, rules for DQ [14]. For any set of data, according to [10], there’s a four-phase process for achieving successful DQM. This process is shown in
Figure 2.5.
Figure 2.5: DQM process
• Data profiling is the process of gaining an understanding of the existing data relative to the quality specifications. Data profiling determines if the data is complete and accurate.
• In the DQ step, we build on the information learned in data profiling to understand the causes of the problems.
• Data integration involves combining data residing in different sources and providing users with a unified view of them.
• Data augmentation involves combining internal data with data from external sources not related to the base data, to increase the level of understanding and gain insights.
2.5 DATA QUALITY DIMENSIONS
DQ dimensions are a useful measurement approach to compare DQ levels across different systems over time. There are many different sources describing and talking about the DQ dimensions; however, all of them almost followed the same approach of describing it, although it often refers to different levels and different data model elements. Below is the interpretation of one of these authors.
David Loshin in [15] said that “Different dimensions are intended to represent different measurable aspects of DQ and are used in characterizing relevance across a set of application domains to monitor against the specified organizational standard of DQ”. Loshin categorized the practical dimensions of DQ into intrinsic dimensions and contextual dimensions; Intrinsic dimensions relate to the data values themselves out of
Data
10 a specific data or model context, while the contextual dimensions look at the data element in relation with other data elements (driven by context). Figure 2.6 shows the practical dimensions of DQ as introduced in [15].
Figure 2.6 Practical dimensions of DQ [15]
2.5.1 Intrinsic Dimensions
The intrinsic dimensions focus on the values of data themselves, without necessarily evaluating the context of those values. These dimensions characterize structure, formats, meanings, and enumeration of data domains – essentially the quality of organizational metadata and how it is used [15]. The intrinsic dimensions introduced are:
• Accuracy: it refers to the degree to which data values agree with an identified source of correct information.
• Lineage: A dimension measuring the historical sources of data in order to have the ability to identify the source of any new or updated data element and hence measure the trustworthiness of the data.
• Semantic consistency: Semantic consistency refers to consistency of definitions among attributes within a data model, as well as similarly named
11 attributes in different enterprise datasets, and it characterizes the degree to which similar data objects share consistent names and meanings.
• Structural consistency: Structural consistency refers to the consistency in the representation of similar attribute values, both within the same dataset and across the data models associated with related tables.
2.5.2 Contextual Dimensions
The contextual dimensions provide a way for the analyst to review conformance with DQ expectations associated with how data items are related to each other [15]. The contextual dimensions introduced are:
• Completeness: refers to the expectation that certain attributes are expected to have assigned values in a dataset.
• Consistency:relevant to the different levels of the data hierarchy, within tables, databases, across different applications, as well as with externally supplied data which is in another words integrity constraints.
• Currency: refers to the degree to which information is current with the world that it models. Currency can measure how “up to-date” information is, and whether it is correct despite the possibility of modifications or changes that impact time and date values.
• Timeliness: refers to the time expectation for accessibility of information. Timeliness can be measured as the time between when information is expected and when it is readily available for use.
• Reasonableness: this dimension includes general statements associated with expectations of consistency or reasonability of values, either in the context of existing data or over a time series.
• Identifiability: refers to the unique naming and representation of core conceptual objects as well as the ability to link data instances containing entity data together based on identifying attribute values.
2.6 APPROACHES TO DATA QUALITY DIMENSIONS
This section describes three main different approaches adopted for addressing comprehensive sets of DQ dimensions definitions. There approaches are theoretical, empirical, intuitive. The theoretical approach it contains a formal model to define the dimensions. The empirical approach constructs the set of dimensions from experiments,
12 interviews, and questionnaires. The intuitive approach basically defines the dimensions based on common sense and practical experience.
2.6.1 Theoretical Approach
This approach to the definition of DQ is proposed in Wand and Wang [16], the identified dimensions are presented below quoted from [16]:
• Accuracy: “inaccuracy implies that the information system represents a real-world state different from the one that should have been represented.”
• Reliability: “whether the data can be counted on to convey the right information; it can be viewed as correctness of data.”
• Timeliness: “the delay between a change of the real-world state and the resulting modification of the information system state.” Lack of timeliness may lead to a state of past data (out-of-date data)
• Completeness: “the ability of an information system to represent every meaningful state of the represented real-world system.”
• Consistency: “inconsistency would mean that the representation mapping is one-to-many.”
2.6.2 Empirical Approach
This approach is mentioned in Wang and Strong [17]. Through interviewing data customers, DQ dimensions have been chosen. Among of 179 DQ dimensions, the author focused on 15 of them (see- Table 2.2).
Table 2.2 Dimensions proposed in the empirical approach [17]
Category Dimension Definition: the extent to which
Intrinsic Believability Data are accepted or regarded as true, real and credible Accuracy Data are correct, reliable and certified free of error Objectivity Data are unbiased and impartial
Reputation Data are trusted or highly regarded in terms of their source and content
Contextual Value-added Data are beneficial and provide advantage for their use Relevancy Data are applicable and useful for the task at hand Timeliness The age of the data is appropriate for the task at hand Completeness Data are of enough depth, breadth, and scope for the
13
Appropriate amount of data
The quality or volume of available data is appropriate
Representational Interpretability Data are in appropriate language and the data definitions are clear
Ease of understanding
Data are clear without ambiguity and easily comprehended
Representational consistency
Data are always presented in the same format and are compatible with the previous data
Concise representation
Data are compactly represented without being overwhelmed
Accessibility Accessibility Data are available or easily and quickly retrieved Access security Access to data can be restricted and hence kept secure
Wang and Strong have classified the dimensions into four categories, which they added two more categories that were discussed in [15]:
• Representational DQ captures what is related to the data representation quality. (e.g. interoperability)
• Accessibility DQ can be interpreted from its name, is related to accessibility of data and the level of security.
2.6.3 Intuitive Approach
This approach is discussed by Redman [18]. DQ dimensions are classified into three categories, namely, conceptual schema, data values, and data format. As we are not concerned about the conceptual schema, so in Table 2.3 we present the definitions provided by Redman for data value and format dimensions only.
Table 2.3: Dimensions proposed in the intuitive approach [18]
Dimension Name
Type of dimension
Definition
Accuracy Data value Distance between the true value and the value, considered as correct
Completeness Data value Degree to which values are present in a data collection
Currency Data value Degree to which datum is up to date
Consistency Data value Coherence of the same datum, represented in multiple copies, or different data to respect integrity constraints and rules
14
Appropriateness Data format One format is more appropriate than another if it is more suited to user needs
Interpretability Data format Ability of the user to interpret correctly values from their format
Portability Data format The format can be applied to as a wide set of situations as possible
Format precision Data format Ability to distinguish between elements in the domain that must be distinguished by users
Format flexibility Data format Changes in user needs and recording medium can be easily accommodated
Ability to
represent null values
Data format Ability to distinguish neatly (without ambiguities) null and default values from applicable values of the domain
Efficient use of memory
Data format Efficiency in the physical representation. As icon is less efficient than a code
Representation consistency
Data format Coherence of physical of data with their formats
2.7 CHANGES IN DATA QUALITY
There are many changes in the past years that highly affected the DQ and how to deal with it. Changes like the possibility to increase the processing power, the increase of communication speed, the increase of physical storage room with a practically low cost and the apparition of ubiquitous devices [19][8]. In addition to that the availability of various cloud computing and associated commercial solutions, it is not required now to buy and deploy an IT infrastructure from scratch [20][21].
These new changes have dramatically affected the traditional vision of DQ. Several potholes in the path of information quality that affect the DQ dimensions. As shown in Table 2.4, the ten potholes and the affected dimensions. That leads to a transition from the stable and controlled solid ground to a dynamic unstable world, which the data is being received from different sources, velocity, sizes, format, and representations. In other words, quoted from [22], we are shifting from what they called “close world assumptions” to “beautiful and challenging chaos”.
Mainly the changes that are needed to be faced are known as the 3Vs: Velocity (e.g. data coming at real time or streaming data), Volume (e.g. data coming in a huge size or in tables or in files), Variety (e.g. data coming in unstructured way) [8]. Some
15 authors add a fourth V as well which is Veracity [22] so it becomes be the 4Vs. Others have added two to become five Vs [9] as mentioned before in Section 2.1.
Table 2.4:Ten potholes on Information Quality [22]
Potholes Affected DQ dimension(s)
1. Multiples sources of the same information produce different values
Consistency and believability
2. Information is produced using subjective judgements, leading to bias
Objectivity and believability
3. Systemic errors in information production lead to loss of information
Correctness and completeness
4. Large volumes of stored information make it difficult to access the information in reasonable time
Concise representation, timeliness, value-added, and accessibility
5. Distributed heterogenous systems lead to inconsistent definitions, formats and values.
Consistent representation, timeliness, and value-added
6. Nonnumeric information is difficult to index Concise representation, value-added, and accessibility
7. Automated content analysis across information collection is not yet available
Analysis requirements, consistent representation, relevance, and value-added
8. As information consumers’ task and the
organizational environment change, the information that is relevant and useful changes, the information that is relevant and useful changes.
Relevance, value-added, and completeness
9. Easy access to information may conflict with requirements for security, privacy, and confidentiality.
Security, accessibility, and value-added
10. Lack of sufficient computing resources limits access. Accessibility, and value
Because of these changes some authors proposed some solutions for this issue. As for [23] they proposed a DQ model called the 3Cs, which is combination of Consistency, Temporal Consistency and Operational Consistency. Below are the three consistency types with their description:
Contextual Consistency refers to capability of datasets to be used within the
same domain of interest of the problem independent from any format (e.g. structured vs unstructured), any size, or coming at different velocities.
16
Temporal consistency refers to the fact that dataset is generated throughout
time. The time is used for performing analysis and understood data consistency.
Operational Consistency refers to the extent of which dataset can be included
in the same analysis, from a technological point of view. Where basically means the data accessibility.
In [23], they are claiming that the main DQ dimension is consistency and all the types of consistency in order to assess the level of quality for big data project. As shown in Table 2.5, these three consistencies will affect most of the external DQ dimensions based on ISO 25012, which is the standard that can be used to establish DQ requirements, define DQ measures, and perform DQ assessments.
Table 2.5: Quality-in-use model for Big Data based on ISO 25012 [23]
DQ characteristics Contextual consistency Temporal consistency Operational consistency Accuracy X X Completeness X X Consistency X X X Credibility X X Currentness X Accessibility X Compliance X X Confidentiality X Efficiency X Precision X Traceability X Understandability X Availability X X Portability X Recoverability X
2.8 DATA QUALITY MODELS
In order to manage DQ dimensions and improve it, it is important to follow a systematic process to ensure better quality within the organization and to make sure of the presence of continuous quality check. Therefore, many researches have proposed models and methodologies for DQ management.
17
2.8.1 Total DQ Management (TDQM)
It is basically an extension of Total Quality Management (TQM) framework which is using for physical product quality. TDQM has been proposed to support the concept of “data as a product”, that they used the same procedures used in TQM to achieve high quality [24].
The methodology starts with the information product (IP) concept. At this point, in order to achieve high quality state, the IP has its own characteristics and specifications. The information quality (IQ) metrics are then developed and used to calculate the IP. The outcome of the measurement is then analyzed using statistical control of the process, identification of trends and comparison map. Finally, improvement of TDQM.
Nonetheless, when comparing information output to physical production, there are several concerns. These included the ability to share data between users. Second, when needed, raw data may not arrive in time and several value measurements such as integrity are difficult to assign to physical production. TDQM has been designed to manage the quality of data in databases and current technologies, including big data, may limit their use. This is because of the variety of data types in big data available. The framework can be redesigned by incorporating other data sources into big data in future work.
2.8.2 Information Integrity Methodology (IIM)
This methodology has been introduced later and expressed the need to meet information integrity by focusing on the foundation of the data itself [25]. Information integrity considered the ability to meet strategic goals of the organizations. However, a requirement for information integrity should be met in order to achieve high data reliability. The framework contains data policy, capability of organization, data management, design, system, verification, interaction, and compliance with the framework. On the other hand, the proposed methodologies added another phase of DQ management to reassure the quality of the data after the process of improvement.
2.8.3 AIM Quality model (AIMQ)
It includes the Product and Service Performance model (PSP) for IQ [26]. In this model, a questionnaire is used to evaluate the quality of data. Additional statistical analysis is then used to classify the problem area of data reliability. The aim of PSP /
18 IQ is to obtain high-quality information based on the attributes of dimensions: intrinsic, descriptive, contextual and accessible [27]. comprises
2.8.4 DQ Management Maturity Model (DQMMM)
The establishment of this model is to improve information structure quality and as the result it would give high quality of information [28]. In this model, structure of incorporated databases being overseen by normalizing its metadata. Standardization of database metadata can be separated into a few phases. For example, intelligent, physical. Other information quality administration model and philosophies referenced before does not oversee information quality during the mix of different databases over the association.
This model focused on the necessities of information mix to upgrade information exactness and consistency. Besides, its capacity to guarantee high quality of information during database incorporation will be an additional worth.
2.8.5 Complete DQ Management (CDQM)
All the previous models and most of the researches were focusing on the structured data type, however this model can deal with structured, semi structured, and unstructured data type. CDQM proposes theoretical, empirical and intuitive approach to check the quality of the data [29]. It has three stages: state reconstruction, assessment and choice of optimal improvement process. As mentioned before, the model is flexible dealing with different kinds of data types, however, it does not have a clear measurement method or a way to calculate the quality dimensions which makes it difficult to apply it in the organization. Table 2.6 is a comparison done by Izham and Fatimah showing the strengths and the weaknesses for the different models [30].
19
Table 2.6 Strengths and Weaknesses of DQ [30]
Model/Methodology Strengths Weaknesses Data Type
TDQM Various choice of
tool to analyses DQ such as statistical process control, pattern recognition and pareto chart.
Data can be shared among user whereas raw material assigned to a single product. -Timeliness raw material arrived at time. -Believability difficult to compare with physical products. Structured
IIM Reassurance phase helps organization to reevaluate DQ after appropriate DQ improvement process.
IIM required DQ policy creation and fulfilment. Thus, it takes more effort for the organization to create DQ policy. Structured AIMQ Measure DQ dimensions in the attributes of intrinsic, representational, contextual and accessibility. Limited tool to identify information quality problem areas. Structured DQMMM Manage DQ during database integration process.
Suitable only for relational database.
Structured
CDQM Support structured,
unstructured, and semi-structured data type.
Unspecific. No DQ dimensions measurement and calculations defined in CDQM. Structured, unstructured, and semi-structured
2.9 DIFFERENT TECHNIQUES TO DEAL WITH DATA
Based on the studies and the papers published so far, they followed three processing techniques to assess the data quality, namely, Stream processing, Batch processing, and a Hybrid one. It is basically divided according to how they process the
20 data in their model. Each type of the processing techniques has outlier detection, evaluation and cleaning phase [31].
Stream processing deals with continuous data, it is a way to turn the big data into fast data. It works with the data online, by feeding the data into an analytic tool in real-time. On the other hand, the batch processing deals with the data in an offline mode. Which the data points are been collected within a specific time interval, after that start to process the data. For example regarding the financial related papers, in [5] they used the stream processing but in [6] they used the batch processing. The model of this thesis is built based on batch processing technique and it focuses on the evaluation phase.
2.9.1 Quality Assessment using batch processing
DQ assessment methods using the batch processing techniques have been divided into two categories: schema and instance based [31]. Both will be explained below.
Instance based technique has been followed by three papers [32][33][34], all
followed the same steps. In [32], they developed a model for improving the quality of open data. This model has four steps, the first step is to assess the DQ dimension, secondly the criteria of the DQ are defined. In the third step, the DQ index is calculated by weighing each dimension. Finally, the comments and the measures of the end users are collected in order to evaluate the quality level.
The quality of health data has been assessed in [33]. In this model the first step was to collect the data, and they assessed the quality of the data before and after the pre-processing phase. They choose dimensions like accuracy, completeness and correctness to evaluate before the pre-processing and measured the same dimensions after this phase in order to know the degree of quality improvement. The pre-processing phase is to work on the data before analyzing it, like filtering, transforming and other pre-processing steps. Electrical data has been evaluated in [34] with almost the same steps of [32] but with more dimensions like accuracy, consistency, integrity, redundancy, timeliness, and intelligence.
Schema based technique has been adopted by [35]. An architecture for data
quality assessment has been proposed in [35]. They defined two modules that are considered as core of the architecture, the DQ Profiling module and the DQ Assessment
21 module. Profiling is responsible for measuring the metadata that defines the data source, while the DQ Assessment module is mainly to calculate the DQ dimensions.
The architecture proposed by [35] along with the steps based on their approach is shown in Figure 2.7. The dimensions are being selected based on the data source, as it differs from one application to another and to the interest of the final user. Hence, in the first step the dimensions are determined automatically by the Source Analyzer module. Then an initial profiling to the source is done. In step 3 the Data Quality Service Interface let allows the users to access the DQ service to collect metadata that define the quality level. In the next step the system gathers all the user’s settings to build a configuration file which is used for execution of evaluation. And all the preferences are saved in Custom Settings. Finally, as soon as the confidence level is established, the DQ Assessment is performed.
Figure 2.7: Data Quality architecture presented by [35]
Data extraction, data pre-processing, data processing, data analysis, data transformation, and data visualization are the big data management steps and has been followed by [36] in their model. They have tried to assess the data quality by metadata in each of the mentioned steps. They defined metadata as structured information that describes, explains or make it easier to use or manage an information source, and the Quality metadata: describes the quality attribute of the data and the metrics for each quality attribute.
A framework to find the data quality rules (DQR) has been introduced by [37]. The framework components are shown in Figure 2.8. It consists of five components as
22 follows: big Data sampling and profiling, big data quality mapping and evaluation, big data quality rules discovery, DQR validation and DQR optimization. In the first step, data sampling and profiling are carried out from a huge amount of data. Quality dimensions are defined after profiling and evaluating data characteristics, and analyzed data are evaluated using quality dimensions. Quality mapping is made between DQ dimensions and the targeted data attributes. The quality mapping produces a set of Data Quality Evaluation Scheme (DQES), each element is a quality score for a specific attribute. At the processing stage the DQES is applied on a set of samples, which result in a DQ dimensions quality scores for each attribute. These scores are analyzed against quality requirements. The quality rules are generated, and attributes fully violate these rules might be discarded. Then the rules apply to the data sampled and inspect the changes. If it is necessary to change the rules, they will be changed.
Figure 2.8: Quality Rules Discovery Framework [37]
2.10 MEASURING DATA QUALITY
The previous sections goal was to provide a general knowledge about DQ and its managements, in addition to defining the quality dimensions and their different approaches. Finally, we illustrated various model and different techniques used to assess the DQ. Now, as the general aspects and definitions about DQ have been presented we will focus on measuring DQ applied by various authors and what dimensions they used choose.
23
2.10.1 Domains presented by the Data quality Literature
Nowadays we are living in a data-driven world, and the big data is becoming more significant, which it rises the importance of DQ. A lot of researches have been done lately on DQ and DQM in various domains. The dispersal of the researches done form the perspective of their application domain is illustrated in Figure 2.9.
Figure 2.9: The domain of studies [31]
As shown in the Figure 2.9, 44% of the papers were about general domain which there is no specific domain is specified. In another studies, most of the papers were about internet of things (IOT) with 37%; this is because of the massive usage of IOT. The rest of the studies are spread among weather, health, social network, and linked open data, with 10%, 5%, 2%, and 2% respectively [31].
To the best of our knowledge, there are many studies done on DQ in various domains, but not many on the financial domain. Nevertheless, there are some papers that addressed the financial domain by assessing the quality of the relevant sectors like: banking, financial organizations, and insurance companies’ datasets [51][54][55][56]. Other papers have addressed the financial domain by evaluating the stock market data [5][6].
Social Network 2%
Weather 10%
Linked Open Data 2% IOT 37% Domain General 44% Health 5%
Distribution of studies
24
2.10.2 Measuring data quality and data quality dimensions
In [39] they claim that defining the metrics is the most important step that should be done to assess the data quality and that not all the methodologies published in the DQ literature highlighted the importance of DQ metrics. They believe that the metrics usually do not take into consideration that data importance differ in the context of helping the company, and that metrics developments strategies are developed for a very specific case and lack the general point of view and sometimes it is difficult to apply as it will be too costly for the company.
They used a weighted criteria method to assess the quality, as if a data unit carries more weight in usage, it should play an important role in measuring the quality. Simple relevancy functions were used to determine the weight of each column, relevancy is defined as the extend of which the data is useful and helpful for the task in hand. Formula (1) [39] is an example of measuring the weight by the frequency of accessing. It could also be calculated using other criteria that suits the company like economic value, recency, and source reputation.
𝑅𝑒𝑙𝑒𝑣𝑎𝑛𝑐𝑦(𝑐𝑜𝑙𝑢𝑚𝑛𝐶) = 𝐴𝑐𝑐𝑒𝑠𝑠𝑒𝑠 𝑡𝑜 𝐶𝑜𝑙𝑢𝑚𝑛 𝐶
𝑇𝑜𝑡𝑎𝑙 𝑎𝑐𝑐𝑒𝑠𝑠𝑒𝑠 𝑡𝑜 𝑡ℎ𝑒 𝑡𝑎𝑏𝑙𝑒 𝑡ℎ𝑎𝑡 𝑖𝑛𝑐𝑙𝑢𝑑𝑒𝑠 𝐶 (1) Their application is a case study in an international seed trade company specifically their phone directory data set. The focus was on two dimensions which there are formulas to calculate them, namely, Completeness and Accuracy. The completeness dimension is calculated by a simple ratio between the missing values over the total number of data units then dimension value is calculated with respect of each column weight by formula 2 [39]. In this formula, 𝐶𝑊𝑖 is the column weight of the 𝑖th column and 𝐶𝐶𝑖 is the column completeness of 𝑖th column by simple ratio. This weighting criterion can be used in different levels such as cells, columns, tuples, tables and databases. Choosing the level used is totally based on the data and the methodology being used.
∑𝑛 (𝐶𝑊𝑖 × 𝐶𝐶𝑖)
𝑖=1 (2)
For the accuracy dimension there were two formulas one for the character values and other one for numerical values. Formula 3.a [39] is for the character values in which the 𝑟𝑖 is the ith value of the tuple t, NED is normalised edit distance and 𝐷(𝑟𝑖 ) is the closest value in the domain. The function returns 1 if there is an exact match other and the 1-NED otherwise. On the other hand, formula 3.b [39] is for numerical values
25 in which it returns 1 in there in an exact match otherwise the difference is calculated mathematically and divided by the max of the two values. Both cases are followed by formula 3.c [39] to calculate the accuracy dimension in which |𝑡| is the number of values in the tuple. Once accuracy dimension values are available, weights can be used as in the completeness case.
(𝑎) 𝑎𝑐𝑐(𝑟𝑖, 𝐷(𝑟𝑖 )) = {1, 𝑖𝑓 𝑟𝑖 ∈ 𝐷(𝑟𝑖) 1 − 𝑁𝐸𝐷(𝑟𝑖, 𝐷(𝑟𝑖 )), 𝑂𝑡ℎ𝑒𝑟𝑤𝑖𝑠𝑒 (𝑏)𝑎𝑐𝑐(𝑟𝑖, 𝐷(𝑟𝑖 )) = { 1, 𝑖𝑓 𝑟𝑖 ∈ 𝐷(𝑟𝑖) 1 − | 𝑟𝑖−𝐷(𝑟𝑖) | 𝑀𝑎𝑥(𝑟𝑖,𝐷(𝑟𝑖 )), 𝑂𝑡ℎ𝑒𝑟𝑤𝑖𝑠𝑒 (3) (𝑐)𝐴𝑐𝑐 [𝑡] = ∑𝑡𝑖=1𝑎𝑐𝑐(𝑟𝑖,𝐷(𝑟𝑖 )) |𝑡|
They claim that the results they got following this criterion brought objective and subjective measurements closer together. Furthermore, if the organization is aware of the significant dimensions, they can weight each dimension in order to combine them and to reach a comprehensive DQ value for the entire organization as shown in Table 2.7. In this paper they did not proposed a way to calculate the timeliness and consistency dimensions. In their application they just calculated the completeness and accuracy dimension as well as they did not consider a weight for each dimension.
Table 2.7: Dimensions measurements and weights [39]
Dimension Measurement Weight
Completeness 0.85 0.3
Accuracy 0.7 0.4
Timeliness 0.75 0.2
Consistency 0.65 0.1
Another approach of calculating data quality was in Research Information System (RIS) domain, which is defined as a central database that can be used to collect, manage and provide information on research activities and research results [40]. In this paper they considered four main dimensions, namely, completeness, correctness, timeliness and consistency because they were discussed widely in scientific publication and they play an essential role in practice. They also provide a general quantification definition for the metrics of a DQ dimension as follows [40]:
𝑅𝑎𝑡𝑖𝑛𝑔 𝑠𝑐𝑜𝑟𝑒 = 1 − 𝑁𝑢𝑚𝑏𝑒𝑟 𝑜𝑓 𝑢𝑛𝑤𝑎𝑛𝑡𝑒𝑑 𝑟𝑒𝑠𝑢𝑙𝑡𝑠 𝑛𝑢𝑚𝑏𝑒𝑟 𝑜𝑓 𝑎𝑙𝑙 𝑟𝑒𝑠𝑢𝑙𝑡𝑠
26 For the completeness they considered two types of completeness, the value and the tuple completeness as these are what can be fit in the RIS domain. Following the same presented formula, the completeness dimension can be calculated using formula 4 [40]. Bearing in mind the availability of existence of a value that does not exist as discussed in [29] in these cases, it does not consider as incompleteness.
Timeliness is calculated based on how current a data value is. In order to limit the cost of active examination, an estimate approach been followed by defining some parameters like 𝐴 is a data attribute, 𝑤 is a suitable data value, 𝑎𝑔𝑒(𝑤, 𝐴) in the age of the data value and 𝑑𝑒𝑐𝑙𝑖𝑛𝑒(𝐴) is an empirical ascertained value which describes the decay rate of the data value and the data attribute. Formula 5 [40] was proposed to measure the timeliness dimension for each attribute after that they applied the weighting criterion that was used in [39], except here was either 0 which means “not important” or 1 which means “important”.
Correctness dimension has been considered using both syntactic and semantic correctness, formula 6 [40] is used to calculate this dimension. They used the Levenshtein distance to calculate this dimension. Levenshtein distance calculates the minimum number of insertions, deletions, substitutions, and match operations to convert a given string to a second string, as well as transform strings of unequal length or to measure the effort based on the minimum number of these operations. Similarly, the consistency dimension is calculated by the formula 7. In this paper, they managed to use the desired dimensions useful for their application and combine the weighting criterion as well, however, their weighting criterion lack flexibility as there may be cases that the attribute is not important yet it needed to be weighted more than 0. On the other hand, there may exist an attribute that is important but not that important to be weighted by 1. 𝑄𝑐𝑜𝑚𝑝𝑙𝑒𝑡𝑒𝑛𝑒𝑠𝑠 = 1 − 𝑁𝑢𝑚𝑏𝑒𝑟 𝑜𝑓 𝑖𝑛𝑐𝑜𝑚𝑝𝑙𝑒𝑡𝑒 𝑑𝑎𝑡𝑎 𝑢𝑛𝑖𝑡 𝑛𝑢𝑚𝑏𝑒𝑟 𝑜𝑓 𝑐ℎ𝑒𝑐𝑘𝑒𝑑 𝑑𝑎𝑡𝑎 𝑢𝑛𝑖𝑡 (4) 𝑄𝑡𝑖𝑚𝑒𝑙𝑖𝑛𝑒𝑠𝑠(𝑤, 𝐴) = 𝑒(−𝑑𝑒𝑐𝑙𝑖𝑛𝑒(𝐴)×𝑎𝑔𝑒(𝑤,𝐴)) (5) 𝑄𝑐𝑜𝑟𝑟𝑒𝑐𝑡𝑛𝑒𝑠𝑠 = 1 − 𝑁𝑢𝑚𝑏𝑒𝑟 𝑜𝑓 𝑖𝑛𝑐𝑜𝑟𝑟𝑒𝑐𝑡 𝑑𝑎𝑡𝑎 𝑢𝑛𝑖𝑡 𝑛𝑢𝑚𝑏𝑒𝑟 𝑜𝑓 𝑐ℎ𝑒𝑐𝑘𝑒𝑑 data 𝑢𝑛𝑖𝑡 (6) 𝑄𝑐𝑜𝑛𝑠𝑖𝑠𝑡𝑒𝑛𝑐𝑦 = 1 − 𝑁𝑢𝑚𝑏𝑒𝑟 𝑜𝑓 𝑖𝑛𝑐𝑜𝑛𝑠𝑖𝑠𝑡𝑒𝑛𝑡 𝑢𝑛𝑖𝑡𝑠 𝑛𝑢𝑚𝑏𝑒𝑟 𝑜𝑓 𝑐𝑜𝑛𝑠𝑖𝑠𝑡𝑒𝑛𝑐𝑦 𝑐ℎ𝑒𝑐𝑘𝑠 𝑝𝑒𝑟𝑓𝑜𝑟𝑚𝑒𝑑 (7)
27 In the industrial domain, where the focus is on the data generated from maintenance management system or warranty databases or data warehouse systems, the purpose is mainly to calculate the reliability [41][42]. The dimensions used here are interpretability, plausibility, timeliness and usefulness [42]. However, in [41] completeness, free-of-error, inconsistency, sample selection and substitution quality were added and used different names for interpretability and usefulness like richness of information. As the goal is to measure the reliability so selecting the sample form the dataset is important, therefore they introduced the sample selection. In which the sample should represent the population from which the sample is collected from [41][42].
Gitzel and Turrin [41] applied two steps in order to assess and improve the DQ of a dataset. The first step they identified the possible data quality dimensions to check if it is important or not. The second step is using a hierarchy approach based on different levels to identify the key problems in the dataset and the most important metrics. The different levels are critical, substitution for critical, subfleet, added value and unspecified. This classification is based on their importance to calculation of the reliability Both steps are discussed in the following paragraphs. They developed a software framework with the aim of calculating the metrics for a specific dataset. All the metrics range from 0 to 100% where the higher the percentage is the higher the quality.
Completeness dimension is typically calculated by checking the empty values or the unknown values, however, they did not specify the probability of misjudge the existence of a missing value. This metric reflects the percentage of properties which are not empty. Free of error is basically the accuracy dimension but they used different name. It has been distinguished between logical, set membership and syntactical error, in which for each rule there is a metric to measure it. The plausibility dimension is more or less like the free of error as it is based on several rules as well but more domain specific, it has some rules that could be defined and added to the inconsistency metric, this comment goes for the free of error metric also. Richness of information metric is also too specific for their domain in which it measures if there are not enough details in the information, they consider the information to lack of richness. Regarding the inconsistency metric, Gitzel and Turrin [41] claim that it has a lesser importance among the metrics, that may be because they just check for the format and the unit of the data
28 value. However, different unites may affect the results and the decision-making process so it should be as important as the other metrics [42]. The last metric is substitution quality, this is another very specific domain metric. The metric tracks the percentage of which use a certain value instead of its substitutes. Noticed here that many of the metrics considered here could be added to the consistency dimension, as well as most of the metrics were highly tailored to the industrial domain.
Other domains have been introduced in the DQ literature, linked Open Data (LOD) is one of them. In [43], the authors proposed an approach to measure the inherent data quality of LOD datasets. Their approach is a metrics-driven approach that developed based on Goal Question Metric (GQM) approach. This approach starts with defining the set of goals that reflects the management requirements, then these goals are progressively developed into different questions to break down the issue and for each question one or more metrics are associated with it to be measured. GQM was initially proposed in the software engineering field, since then it has been used and applied in a different of other domains.
Initially, the authors of [43] focused on three dimensions accuracy, inconsistency and completeness, the accuracy dimension has been divided into three parts, namely, semantic accuracy, syntactic accuracy and uniqueness. After applying the GQM approach, 20 metrics were proposed for all the dimensions. All the metrics have been derived in quantitative way and based on a ratio scale, most of them have been calculated by calculating the number of undesired outcomes divided by the total outcome then subtracted by 1. Subsequently, 1 will represent the most preferable score and 0 the least preferable one. The questions proposed by the authors as well as the relevant metrics can be shown in Table 2.8 to Table 2.12.
Table 2.8: The metrics for semantic accuracy [43]
Question Metric
Are the entities described with the correct values?
M1. Ratio of triples contain missing objects M2. Ratio of triples with out-of-range objects M3. Ratio of triples contain misspelling data value
Do entities accurately represent the real world?
M4. Ratio of entities without correspondent in real-world
![Figure 2.4: Number of correct data records for a study involving 75 executives [13]](https://thumb-eu.123doks.com/thumbv2/123dokorg/7515519.105608/18.892.159.734.364.630/figure-number-correct-data-records-study-involving-executives.webp)
![Table 2.3: Dimensions proposed in the intuitive approach [18]](https://thumb-eu.123doks.com/thumbv2/123dokorg/7515519.105608/23.892.136.759.101.426/table-dimensions-proposed-intuitive-approach.webp)
![Table 2.4:Ten potholes on Information Quality [22]](https://thumb-eu.123doks.com/thumbv2/123dokorg/7515519.105608/25.892.133.763.208.842/table-ten-potholes-on-information-quality.webp)
![Table 2.5: Quality-in-use model for Big Data based on ISO 25012 [23]](https://thumb-eu.123doks.com/thumbv2/123dokorg/7515519.105608/26.892.180.718.484.952/table-quality-use-model-big-data-based-iso.webp)
![Table 2.7: Dimensions measurements and weights [39]](https://thumb-eu.123doks.com/thumbv2/123dokorg/7515519.105608/35.892.137.758.739.834/table-dimensions-measurements-and-weights.webp)
![Table 2.8: The metrics for semantic accuracy [43]](https://thumb-eu.123doks.com/thumbv2/123dokorg/7515519.105608/38.892.145.758.916.1109/table-metrics-semantic-accuracy.webp)
![Table 2.15: Types of constraints proposed by [5]](https://thumb-eu.123doks.com/thumbv2/123dokorg/7515519.105608/52.892.134.755.653.820/table-types-constraints-proposed.webp)
![Table 2.16: List of the attributes examined in[6]](https://thumb-eu.123doks.com/thumbv2/123dokorg/7515519.105608/54.892.142.757.679.839/table-list-attributes-examined.webp)