Predicting survival in newly diagnosed
idiopathic pulmonary fibrosis: a 3-year
prospective study
Marco Mura*, Maria A. Porretta*, Elena Bargagli#, Gianluigi Sergiacomi",
Maurizio Zompatori+, Nicola Sverzellati1, Amedeo Taglieri", Fabrizio Mezzasalma#, Paola Rottoli#, Cesare Saltini* and Paola Rogliani*
ABSTRACT: The natural history of idiopathic pulmonary fibrosis (IPF) is not well defined and its clinical course is variable. We sought to investigate the survival and incidence of acute exacerbations (AEs) and their significant predictors in newly diagnosed patients.
70 patients newly diagnosed with IPF were prospectively followed for at least 3 yrs. Baseline evaluation included Medical Research Council dyspnoea score (MRCDS), 6-min walk test, pulmonary function tests, all of which were repeated at 6 months, and high-resolution computed tomography. A retrospective cohort of 68 patients was used for confirmation.
Mean survival from the time of diagnosis was 30 months, with a 3-yr mortality of 46%. A Risk stratificatiOn ScorE (ROSE) based on MRCDS .3, 6-min walking distancef72% predicted and composite physiologic index .41 predicted 3-yr mortality with high specificity. 6-month progression of ROSE predicted rapid progression. 3-yr incidence of AE was 18.6%, mostly occurring in the first 18 months; risk factors for AE were concomitant emphysema and low diffusing coefficient of the lung for carbon monoxide. Results were confirmed in an independent cohort of patients.
In newly diagnosed IPF, advanced disease at presentation, rapid progression and AEs are the determinants of 3-yr survival. The purpose of the multifactorial ROSE is to risk-stratify patients in order to predict survival and detect rapid disease progression.
KEYWORDS: Acute exacerbation, idiopathic pulmonary fibrosis, prognosis, survival, usual interstitial pneumonia
I
diopathic pulmonary fibrosis (IPF) is the most aggressive form of idiopathic interstitial pneumonia (IIP). The natural history of IPF is not well defined. The clinical course is highly variable, with many patients remaining stable for a prolonged period of time, even in the absence of effective medical treatment, while others experi-ence a rapid and relentless progression [1–3]. In addition, in some cases, the clinical course consists of a stepwise process rather than of a gradual decline, with periods of stability alter-nating with acute respiratory worsening [4, 5]. Some of these events meet the criteria of acute exacerbations (AEs) and carry a high mortality. Currently, there is no standard approach to stage IPF and studies on the survival of newly diagnosed IPF date back to the 1990s [6–8], whenthe diagnostic criteria of IPF were not well defined. The estimation of survival depends on which time-point is used as the starting point: onset of symptoms, time of diagnosis or later time-points. Patients are likely to consult a physician when the extent of the disease reaches a threshold that is sufficient to provoke symp-toms [3, 5]. As this can occur more or less rapidly, delays in the diagnosis do occur. Consequently, mean survival rates reported in different studies are highly variable, being estimated at between 2 and 4 yrs from the time of diagnosis [1, 3, 9, 10]. The heterogeneity of the clinical course in IPF makes it difficult to predict the disease outcome, and hence the timing of lung transplantation (LTx), and patients with IPF present the highest waiting list mortality among LTx candidates [11].
AFFILIATIONS *Malattie Respiratorie,
"
Diagnostica per Immagini e Radiologia Interventistica, Policlinico Tor Vergata, University of Rome ‘‘Tor Vergata’’, Rome,
#Pneumologia Universitaria,
Policlinico Santa Maria alle Scotte, University of Siena, Siena,
+Radiologia Cardio-Toracica,
Policlinico S. Orsola Malpighi, University of Bologna, Bologna, and
1
Diagnostica per Immagini, Ospedale Maggiore, University of Parma, Parma, Italy.
CORRESPONDENCE P. Rogliani
U.O.C. Malattie Respiratorie, Policlinico Tor Vergata, Universita` di Roma ‘‘Tor Vergata’’, Viale Oxford 81, 00131 Rome
Italy
E-mail [email protected] Received:
June 20 2011 Accepted after revision: Nov 02 2011 First published online: Jan 12 2012
European Respiratory Journal Print ISSN 0903-1936 Online ISSN 1399-3003
Reliable predictors of outcome are needed to optimise the timing for LTx [11]. There is no single indicator that can correctly stage the disease [12]. Most of the studies on the prognostic factors in IPF are retrospective, which limits the strength of their conclusions. The prospective studies pub-lished recently have been generated from clinical trial data, and enrolment criteria usually exclude advanced patients, irrelevant of the symptom starting point, while they include patients with variable time lags from diagnosis [1, 10, 13–17]. In IPF, the prognostic power of demographic, functional and radiographic factors collected at time of diagnosis remains unclear. The aim of our study was to determine whether 3-yr survival could be predicted on the basis of clinical indicators collected at the time of diagnosis and re-evaluated at 6 months in a homogenous cohort of patients with a rigorous diagnosis of IPF. The incidence and predictors of AEs were also studied. The results were confirmed in a separate, retrospective cohort of IPF patients from another centre.
MATERIAL AND METHODS Design of the study and subjects
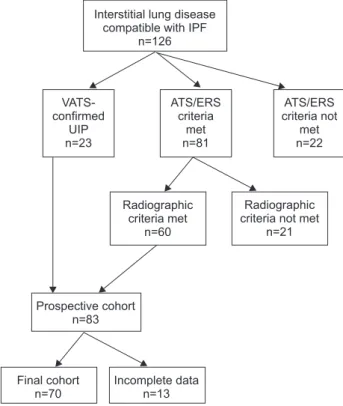
The design of the study is shown in figure 1. Between October 1, 2005 and December 31, 2007, among the 126 subjects diagnosed with IIP at the Pulmonary Unit, University of Rome ‘‘Tor Vergata’’, Rome, Italy, 23 patients had the pathological diagnosis of usual interstitial pneumonia (UIP) confirmed by surgical biopsy; 81 patients met the 2000 American Thoracic Society (ATS)/European Respiratory Society criteria [18]; 22 subjects did not meet them (due to the presence of collagen vascular diseases, drug toxicities,
domestic or professional environmental exposures) and were excluded.
High-resolution computed tomography (HRCT) scans of the 81 subjects without histological confirmation were independently reviewed by three radiologists (G. Sergiacomi, M. Zompatori and N. Sverzellati). In 60 cases, at least two radiologists agreed on a pattern consistent with UIP or possible UIP [19, 20]. The 23 subjects with biopsy-confirmed UIP and the 60 patients with confirmed radiographic diagnosis were included in the study and followed for at least 3 yrs; 12 were excluded due to lost follow-up or death for causes other than IPF.
Patients’ characteristics are shown in table 1. 24 (34%) subjects had concomitant emphysema (CE). Survival was defined as time to death or LTx. Time to diagnosis was defined as the time occurring between the onset of symptoms and diagnosis. AEs were defined according to the HRCT criteria described by AKIRA et al. [21], after excluding infective causes and cardiogenic oedema.
Subjects with mild-to-moderate disease were investigated for rapid progression of IPF. The cut-off values for each variable to define ‘‘mild-to-moderate disease’’ at the time of diagnosis were derived from the receiver operating characteristic (ROC) analysis against 3-yr survival.
Survival predictors were tested in an independent, retro-spective cohort of 68 subjects diagnosed with IPF [18] at the Pulmonary Unit, University of Siena, Siena, Italy. 22 (32%) subjects had biopsy-confirmed UIP; 13 (19%) had CE. This study was approved by local ethics committees. Further details and treatment regimens are provided in the online supplementary material.
Pulmonary function tests
Pulmonary function tests (PFTs) and 6-min walking test (6MWT) were performed according to the ATS guidelines [22, 23]. 6-min walking distance (6MWD) values were also expressed as per cent predicted [24]. The composite physiolo-gic index (CPI) was calculated according to WELLSet al. [12].
The severity of chronic dyspnoea was rated according to the modified Medical Research Council dyspnoea score (MRCDS) (online supplementary table S1) [25].
HRCT scanning
The interobserver variability among the three core radiologists fell into the limits established by large reports (online supplementary table S2) [14, 26]. The total extent of fibrosis was evaluated with a visual score [17, 20, 27–29]. The mean of the fibrosis scores established by each radiologist was calculated for each patient.
Statistical analysis
Values are expressed as mean¡SD. Weighted k coefficients
were used to assess the level of interobserver agreement among radiologists. Comparisons were made with unpaired t-test or with the Mann–Whitney U-t-test, where appropriate. The optimal cut-off value for different variables to detect mortality or AE was assessed using ROC analysis. Survival was evaluated using Kaplan–Meier curves and the log-rank test. Cox proportional hazards regression analysis was used to
Interstitial lung disease compatible with IPF
n=126 Radiographic criteria met n=60 Prospective cohort n=83 VATS-confirmed UIP n=23 ATS/ERS criteria met n=81 ATS/ERS criteria not met n=22 Radiographic criteria not met
n=21
Final cohort n=70
Incomplete data n=13
FIGURE 1. Design of the study. IPF: idiopathic pulmonary fibrosis; VATS: video-assisted thoracoscopy; UIP: usual interstitial pneumonia; ATS: American Thoracic Society; ERS: European Respiratory Society.
identify significant variables predicting survival status. Variables selected via univariate analysis were evaluated in the multivariate Cox regression analysis. p-values ,0.05 were regarded as significant.
RESULTS
Survival in newly diagnosed patients
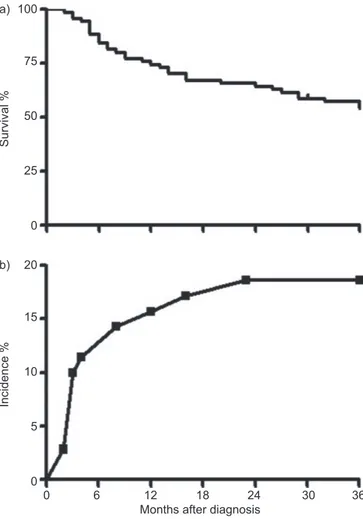
In the prospective cohort, the time to diagnosis was variable (table 1). Mean survival after diagnosis was 30¡21 months. During the 3-yr follow-up after diagnosis, 32 (46%) subjects died and one underwent a LTx (survival rate 53%) (fig. 2). Mortality in the first year after diagnosis was 26%, and 34% at 2 yrs from diagnosis. In biopsy-confirmed patients, mean survival after diagnosis was 28¡12 months, with a 3-yr survival rate of 57%. Prediction of 3-yr survival and 6-month disease progression The comparison of characteristics at the time of diagnosis (table 2) showed that nonsurvivors had significantly higher body mass index, MRCDS, alveolar–arterial oxygen tension difference (PA–a,O2), CPI, HRCT disease extent and broncho-alveolar lavage-total cell count (BAL-TCC), and significantly lower 6MWD (m and % pred), forced vital capacity (FVC) and diffusing capacity of the lung for carbon monoxide (DL,CO) compared with survivors. This probably reflects more ad-vanced disease. There was no significant difference in BAL-TCC between smokers and nonsmokers (608,750¡572,897 versus 577,772¡403,062 cells per mL, respectively). BAL-TCC did not show any significant correlation with any other variable, including pack-yrs (data not shown).
Nonsurvivors were more often affected by CE and more frequently had a significant desaturation (arterial oxygen saturationf88%) during the 6MWT compared with survivors (table 2). The correlation between HRCT disease extent and CPI at the time of diagnosis was significant (online supple-mentary fig. S1).
Kaplan–Meier survival curves were grouped according to ROC cut-off values (fig. 3 and online supplementary table S3). Univariate analysis and Kaplan–Meier curves confirmed that several variables at the time of diagnosis were significant predictors of 3-yr survival (table 3, online supplementary fig. S2A–L). 6MWD (% pred) showed a higher predictive value than 6MWD (m) (online supplementary fig. S2C–D), while the CPI was superior to the HRCT disease extent (online supplementary fig. S2J–K).
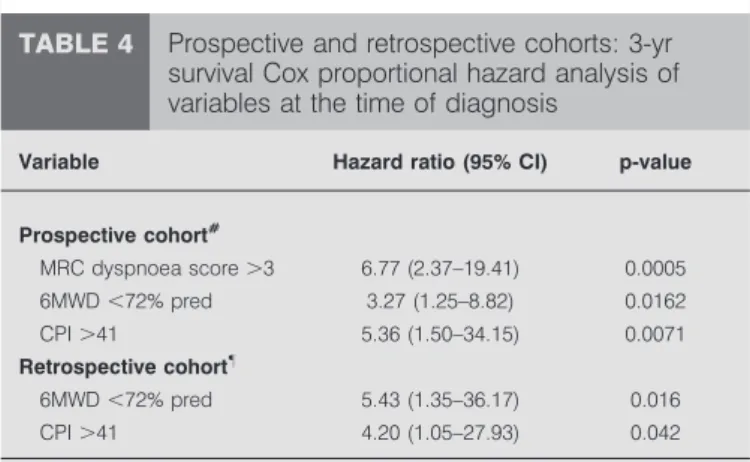
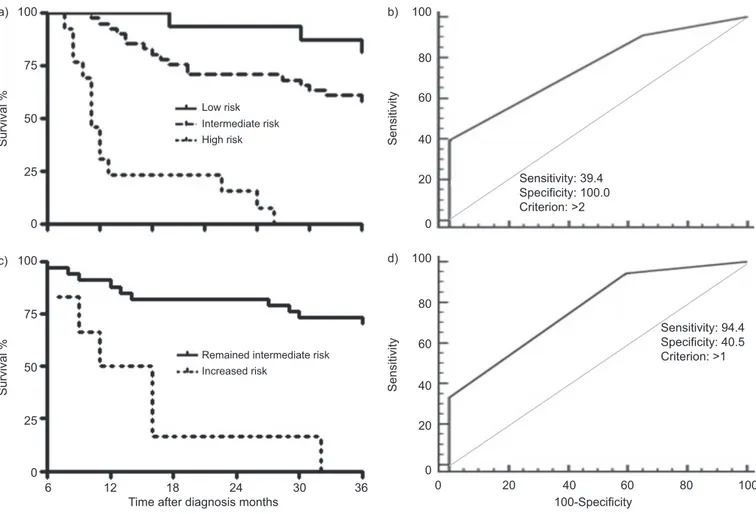
Multivariate analysis showed that MRCDS .3, 6MWDf72% pred and CPI .41 at diagnosis were significant and indepen-dent predictors of 3-yr survival (table 4). Therefore, for the purpose of 3-yr survival prediction, risk groups were defined as follows. Risk stratificatiOn ScorE (ROSE): low risk (n516): MRCDSf3, 6MWD .72% pred and CPIf41; intermediate risk (n541): MRCDS .3, 6MWDf72% or CPI.41; and high risk (n513): MRCDS .3, 6MWD f72% and CPI .41. 3-yr mortality was 19% in the low risk group, 42% in the inter-mediate risk group and 100% in the high risk group (p,0.0001) (fig. 4a). The ROSE predicted 3-yr survival with a 39% sensitivity and a 100% specificity (fig. 4b; online supplemen-tary table S3).
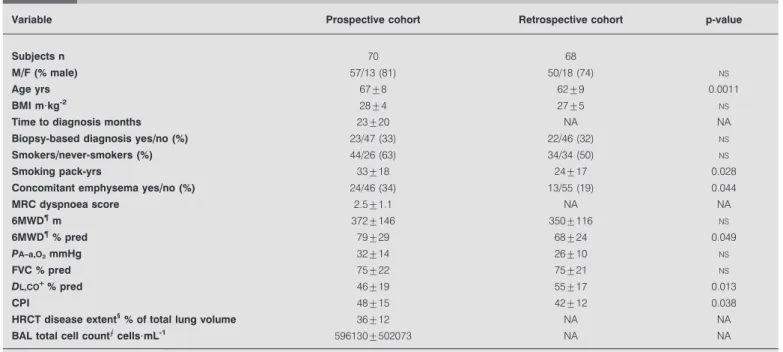
TABLE 1 Demographic, clinical, functional and radiographic characteristics of the two cohorts#at the time of diagnosis
Variable Prospective cohort Retrospective cohort p-value
Subjects n 70 68
M//F (% male) 57/13 (81) 50/18 (74) NS
Age yrs 67¡8 62¡9 0.0011
BMI m?kg-2 28¡4 27¡5 NS
Time to diagnosis months 23¡20 NA NA
Biopsy-based diagnosis yes//no (%) 23/47 (33) 22/46 (32) NS
Smokers//never-smokers (%) 44/26 (63) 34/34 (50) NS
Smoking pack-yrs 33¡18 24¡17 0.028
Concomitant emphysema yes//no (%) 24/46 (34) 13/55 (19) 0.044
MRC dyspnoea score 2.5¡1.1 NA NA 6MWD" m 372¡146 350¡116 NS 6MWD"% pred 79¡29 68¡24 0.049 PA–a,O2mmHg 32¡14 26¡10 NS FVC % pred 75¡22 75¡21 NS DL,CO+% pred 46¡19 55¡17 0.013 CPI 48¡15 42¡12 0.038 HRCT disease extent1
% of total lung volume 36¡12 NA NA
BAL total cell countecells?mL-1 596130¡502073 NA NA
Data are presented as mean¡SD, unless otherwise stated. M: male; F: female; BMI: body mass index; MRC: Medical Research Council; 6MWD: 6-min walking distance; % pred: % predicted; PA–a,O2: alveolar–arterial oxygen tension difference; FVC: forced vital capacity; DL,CO: diffusing capacity of the lung for carbon monoxide; CPI:
composite physiologic index; HRCT: high-resolution computed tomography; BAL: bronchoalveolar lavage;NS: not significant; NA: not available.#: a prospective cohort at
the Pulmonary Unit, University of Rome ‘‘Tor Vergata’’, Rome, Italy and a retrospective cohort at the pulmonary unit, University of Siena, Siena, Italy;"
: n564;+: n565;1
: mean of the scores from each of the three core radiologists;e: n528. p-value: Chi-squared, unpaired t-test or Mann–Whitney U-test, where required.
Subjects with mild-to-moderate disease (low-to-intermediate ROSE) based on the baseline evaluation were investigated for rapid disease progression. At 6 months after diagnosis, changes of MRCDS, 6MWD % pred and CPI were evaluated. Mortality was 100% in the group of patients upgraded to high ROSE and 27% in those who remained in the intermediate ROSE group (fig. 4c). Of the three deaths observed among the patients with low ROSE at baseline, two subjects had advanced to intermediate ROSE at 6 months follow-up. Of the 17 deaths observed among the subjects with intermediate ROSE at baseline, six patients had advanced to high ROSE at 6 months follow-up. None the patients who had advanced to high ROSE survived. Three more patients in the intermediate risk group, who died before 3 yrs and did not advance, had an AE. Two more patients in this group died before the 6-month re-evaluation. An advancement of the ROSE predicted 3-yr mortality with 94% sensitivity and 40% specificity (fig. 4d). 6-month changes of single parameters are shown in the online supplementary depository.
Acute exacerbations: incidence and prediction
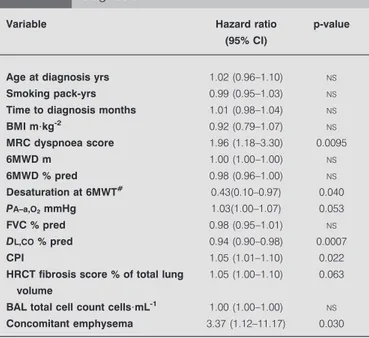
During the follow-up period, 13 AEs were observed (incidence 18.6%), mostly (11 out of 13) within the first 18 months after diagnosis (fig. 2b). Three AEs were immediately fatal and, in six more cases, exitus occurred within 3 months from the
occurrence of AE. Although univariate analysis showed a number of significant predictors of AE at the time of diagnosis (table 5), multivariate analysis showed that the only indepen-dent, significant predictors of AE were DL,COand the presence of CE (table 6). ROC analysis showed that a DL,COf47% was
the optimal cut-off to detect AE (online supplementary fig. S4). The incidence of AEs was indeed significantly higher in patients with CE than in those without CE (24% versus 11%, p50.022).
Comparative analysis in the retrospective cohort
The retrospective cohort consisted of relatively younger patients with more severe exercise impairment (table 1). A lower prevalence of smoking and CE could explain the higher DL,CO and, consequently, lower CPI values. During the 3-yr follow-up period after diagnosis, 19 patients died (28%) and seven had a LTx. Therefore, compared with the prospective cohort, 3-yr survival was better (62% versus 53%), although not significantly (online supplementary fig. S5a). According to the univariate analysis, 6MWD (% pred), PA–a,O2, FVC, DL,COand CPI at the time of diagnosis were significant predictors of 3-yr survival (online supplementary table S4). MRCDS was not available in this cohort. In the multivariate analysis, 6MWD f72% pred and CPI .41 were independent, significant predictors of survival (table 4). In this cohort, ROSE at baseline predicted 3-yr mortality with a 67% sensitivity and 91% specificity (online supplementary fig. S5b).
The incidence of AE in this cohort was 22% (online supplementary fig. S5c). In 86% of the cases, death occurred within 3 months from AE. DL,CO predicted the occurrence of AE (hazard ratio 0.91, CI 0.83–0.98; p50.013), while CE was only close to significance (p50.063).
DISCUSSION
This study demonstrates that, in a homogeneous cohort of patients newly diagnosed with IPF, the mean survival from the time of diagnosis was 30 months, and 3-yr survival could be predicted with high specificity based on a risk stratification score (ROSE) defined by MRCDS, 6MWD (% pred) and CPI. Furthermore, a 6-month deterioration with risk group advancement predicted mortality risk even in patients with only mild-to-moderate disease at presentation. Finally, AE mostly occurred in the first 18 months after diagnosis, more frequently in patients with CE and low DL,CO.
In this prospective study, patients newly diagnosed with IPF were followed from the time of diagnosis for at least 3 yrs. The mean survival after diagnosis was lower than that reported by previous prospective reports [7, 8], although retrospective studies reported a range of between 2 and 3 yrs [30–32]. The importance of studying survival prospectively is relevant, as, in retrospective studies, some patients who died quickly from aggressive disease might be excluded [8].
Although many studies on the prognostic factors in IPF have been published, there is a surprising lack of prospective studies conducted from the time of diagnosis. The disease extent and the severity of functional impairment of patients with IPF at the time of diagnosis are variable [2]. In this study, MRCDS .3, 6MWD f72% pred and CPI .41 were the independent predictors of 3-yr survival. A risk stratification
100 a) 75 50 25 0 Survival % 20 b) 15 10 5 0 Incidence %
Months after diagnosis
0 6 12 18 24 30 36
FIGURE 2. a) Prospective cohort: 3-yr survival form the time of diagnosis. b) Prospective cohort: 3-yr incidence of acute exacerbations.
score (ROSE) based on these three parameters predicted 3-yr survival with a 100% specificity, but with a sensitivity of only 39%. This can be explained by both the rapid progression of initially mild disease at presentation in some patients, and by the occurrence of AEs in some others. Therefore, identifying a rapidly progressing disease in patients with only mild-to-moderate impairment at diagnosis is also of pivotal impor-tance. 6-month changes of ROSE were considered, and an
advancement to high ROSE predicted mortality with a 94% sensitivity and a 41% specificity. If validated, our results suggest that these indicators are able to detect a clinically significant disease progression.
The use of dyspnoea scores in the evaluation of IPF is controversial. Retrospective reports pointed to a significant role for the MRCDS [33, 34], although concern has been raised
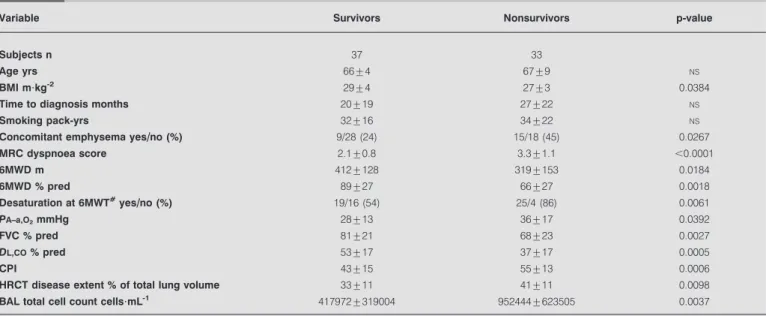
TABLE 2 Prospective cohort: demographic, clinical, functional and radiographic characteristics at the time of diagnosis of 3-yr
survivors and nonsurvivors
Variable Survivors Nonsurvivors p-value
Subjects n 37 33
Age yrs 66¡4 67¡9 NS
BMI m?kg-2 29¡4 27¡3 0.0384
Time to diagnosis months 20¡19 27¡22 NS
Smoking pack-yrs 32¡16 34¡22 NS
Concomitant emphysema yes//no (%) 9/28 (24) 15/18 (45) 0.0267
MRC dyspnoea score 2.1¡0.8 3.3¡1.1 ,0.0001 6MWD m 412¡128 319¡153 0.0184 6MWD % pred 89¡27 66¡27 0.0018 Desaturation at 6MWT#yes//no (%) 19/16 (54) 25/4 (86) 0.0061 PA–a,O2mmHg 28¡13 36¡17 0.0392 FVC % pred 81¡21 68¡23 0.0027 DL,CO% pred 53¡17 37¡17 0.0005 CPI 43¡15 55¡13 0.0006
HRCT disease extent % of total lung volume 33¡11 41¡11 0.0098
BAL total cell count cells?mL-1 417972¡319004 952444¡623505 0.0037
Data are presented as mean¡SD, unless otherwise stated. BMI: body mass index; MRC: Medical Research Council; 6MWD: 6-min walking distance; % pred: % predicted; 6MWT: 6-min walking test; PA–a,O2: alveolar–arterial oxygen tension difference; FVC: forced vital capacity; DL,CO: diffusing capacity of the lung for carbon monoxide; CPI:
composite physiologic index; HRCT: high-resolution computed tomography; BAL: bronchoalveolar lavage;NS: not significant. p-value: Chi-squared, unpaired t-test or Mann–Whitney U-test, where required.#
: arterial oxygen saturationf88%.
100 a) b) c) d) 80 60 40 20 0 Sensitivity 100-Specificity 20 40 0 60 80 100 100-Specificity 20 40 0 60 80 100 100-Specificity 20 40 0 60 80 100 100-Specificity 20 40 0 60 80 100 100-Specificity 20 40 0 60 80 100 e) 100 f) g h) i) 80 60 40 20 0 Sensitivity j)
FIGURE 3. Prospective cohort, receiver operating characteristics curve of different variables at the time of diagnosis versus 3-yr survival (see table S3 for more details). a) Body mass index; b) Medical Research Council dyspnoea score; c) 6-min walking distance (6MWD; m); d) 6MWD (% predicted); e) alveolar–arterial oxygen tension difference; f) forced vital capacity; g) diffusing capacity of the lung for carbon monoxide; h) composite physiologic index; i) high-resolution computed tomography fibrosis
due to the potential confounding factors in the determination of dyspnoea and its subjective perception [35]. Our study, with longitudinal evaluation, strongly supports the use of the MRCDS, which was in fact the most significant single predictor of survival. We also showed, for the first time, that a 6-month increase of the score from 0–3 to 4–5 predicted a poor prognosis, suggesting that the MRCDS is a sensitive tool in detecting IPF progression. Although this score is an objective evaluation based on precise questions, the patient’s perception of dyspnoea remains subjective, implying that the concomitant use of other validated tools is recommended.
The use of 6MWT has been validated in IPF [13] and it strongly correlated with maximum oxygen uptake results [36]. Our study provides further support to the use of this simple test in IPF, as 6MWD at the time of diagnosis was a significant predictor of survival (cut-off points at 350 m or 72% pred) and added independent prognostic information to the multivariate analy-sis. Another novel finding of this study is that 6MWD (% pred) based on the reference equations of ENRIGHTand SHERRILL[24] was a more reliable predictor of survival and disease progres-sion than 6MWD (m). This observation supports the develop-ment of new reference equations on a larger number of normal subjects. As a limiting factor, several patients with IPF are elderly, have mobility issues and may not perform an accurate 6MWT. This further underlines the importance of using a panel of different prognostic factors in IPF.
HRCT represents an integral part of the evaluation of patients with IIP [14, 17]. The importance of accurate assessment of
HRCT images has been highlighted by a recent study reporting a relevant quote of misdiagnosis [20]. When biopsy was not available, we relied on a panel of three experienced radiolo-gists to establish a confident diagnosis of IPF. The fibrosis score that we used provides an overall estimate of the disease extent [27, 28], which significantly correlated with the CPI. Interestingly, the CPI was a more significant prognostic factor (cut-off point 41) than HRCT disease extent. By taking into account the confounding factor of CE, CPI provides an estimate of disease extent [12] and added independent prognostic power to the multivariate model. A low DL,CO, which is part of CPI, may also reflect the presence of associated pulmonary hypertension, which is highly prevalent in IPF and has a negative impact on survival [37]. However, the presence and severity of pulmonary hypertension in IPF can be reliably assessed only with right heart catheterisation [38], which was not part of this study.
The use of FVC as a predictor of survival in IPF is also controversial. After initial supportive reports [39–42] based on retrospective data, enthusiasm was dampened by the data collected from clinical trials, which showed significant mortal-ity in patients with stable FVC [43]. In our cohort, both baseline FVC at the time of diagnosis (cut-off point 70%) and 6-month FVC deterioration predicted survival. While we considered only newly diagnosed cases, patients were enrolled in clinical trials at various time points of the natural history of IPF, and this may explain the discrepancy. Patients with advanced disease may not be able to perform an accurate DL,CO, and therefore FVC and also PA–a,O2(cut-off point 35 mmHg) may still have a prognostic role.
A relevant number of IPF patients has CE [44]. Studies from COTTIN and co-workers [44, 45] and SERGIACOMI et al. [46]
identified combined pulmonary fibrosis and emphysema (CPFE) as a relevant clinical entity, as mean survival is shorter than in other forms of IIP, the incidence of pulmonary hypertension is higher and PFTs are potentially confounding. Although CE was not an independent prognostic factor, our study showed that, in the long term, patients with CE have a worse prognosis than those without CE. This finding fits both with the previous observation that CE significantly contributes
TABLE 3 Prospective cohort: 3-yr survival, univariate
analysis of variables at the time of diagnosis
Variable Hazard ratio
(95% CI)
p-value
Age yrs 1.02 (0.98–1.07) NS
Smoking pack-yrs 0.99 (0.97–1.02) NS
Time to diagnosis months 1.01 (0.99–1.03) NS
BMI m?kg-2 0.89 (0.80–0.98) 0.0155 MRC dyspnoea score 2.52 (1.76–3.62) ,0.0001 6MWD m 1.00 (1.00–1.00) NS 6MWD % pred 0.98 (0.96–0.99) 0.0007 Desaturation at 6MWT# 0.54 (0.32–0.84) 0.0052 PA-a,O2mmHg 1.03 (1.01–1.05) 0.0063 FVC % pred 0.97 (0.95–0.99) 0.0039 DL,CO% pred 0.94 (0.92–0.97) ,0.0001 CPI 1.06 (1.03–1.10) ,0.0001
HRCT fibrosis score % of total lung volume
1.03 (1.00–1.07) 0.0497
BAL total cell count cells?mL-1 1.00 (1.00–1.00) 0.0009
Concomitant emphysema 1.82 (0.90–3.66) 0.096
BMI: body mass index; MRC: Medical Research Council; 6MWD: 6-min walking distance; % pred: % predicted; 6MWT: 6-min walking test; PA–a,O2: alveolar–arterial
oxygen tension difference; FVC: forced vital capacity; DL,CO: diffusing capacity of the lung for carbon monoxide; CPI: composite physiologic index; HRCT: high-resolution computed tomography; BAL: bronchoalveolar lavage;NS: not significant.
#
: no desaturation (arterial oxygen saturationf88%) during the 6MWT.
TABLE 4 Prospective and retrospective cohorts: 3-yr
survival Cox proportional hazard analysis of variables at the time of diagnosis
Variable Hazard ratio (95% CI) p-value
Prospective cohort# MRC dyspnoea score .3 6.77 (2.37–19.41) 0.0005 6MWD ,72% pred 3.27 (1.25–8.82) 0.0162 CPI .41 5.36 (1.50–34.15) 0.0071 Retrospective cohort" 6MWD ,72% pred 5.43 (1.35–36.17) 0.016 CPI .41 4.20 (1.05–27.93) 0.042
MRC: Medical Research Council; 6MWD: 6-min walking distance; % pred: % predicted; CPI: composite physiologic index.#
: p-value of the model ,0.0001;
"
to the functional impairment in patients with IPF [27, 44], and with the retrospective study of MEJIAet al. [47].
BAL-TCC at the time of diagnosis was significantly increased in nonsurvivors compared with survivors. Probably due to the limited amount of BAL-TCC data available, this was not an independent predictor of survival. While routine performance of BAL in the work-up of IPF is now being questioned [2], this and other reports [48] should encourage larger studies with systematic bronchoscopy to explore the hypothesis that BAL cellularity carries a prognostic value. This is most relevant, since BAL-TCC did not correlate with any other parameter consid-ered or smoking history, and might therefore capture a different phenomenon of the disease, such as active inflammation. The high mortality and the difficult prediction of AEs implies that a completely reliable system of survival prediction is nearly impossible to obtain at baseline. The 3-yr incidence of AE was 18.6%. Although the relatively limited number of patients precludes any definitive conclusion, this is the first prospective study to investigate the incidence of AE, which was highest in the first 18 months post-diagnosis, and carried
a high mortality (69% within 3 months from the AE occur-rence). While AEs are difficult to predict with the same parameters used to predict survival, it is important to note that AEs do not occur in patients with mild disease at presentation, classified as the low risk group. In a large retrospective study, the prevalence of AE was analogous [49]. Risk factors for AE were a low DL,CO(cut-off point 47%) and the presence of CE, which may not be completely indepen-dent from each other, as patients with CPFE generally have a very low DL,CO [44]. Risk factors were substantially con-firmed in the retrospective cohort. This observation is intri-guing, as it may identify a particular phenotype of patients. We previously showed a higher expression of metalloprotei-nases in the lungs of CPFE patients compared with those without CE, hypothesising that this could determine a more aggressive activation of fibroblasts, remodelling and tissue destruction and, consequently, a more precipitous course [50]. Whether this phenomenon is reflected by the severely impaired gas exchange commonly observed in CPFE, and whether this is implicated in the occurrence of AE, has to be further elucidated. 100 a) 75 50 25 0 Survival % 100 c) 75 50 25 0 Survival %
Time after diagnosis months
6 12 18 24 30 36
Low risk
High risk Intermediate risk
Increased risk
Remained intermediate risk
100 b) 80 60 20 40 0 Sensitivity Sensitivity: 39.4 Specificity: 100.0 Criterion: >2 100-Specificity 100 d) 80 60 20 40 0 Sensitivity Sensitivity: 94.4 Specificity: 40.5 Criterion: >1 0 20 40 60 80 100
FIGURE 4. a) Prospective cohort, Kaplan–Meier survival analysis grouped by Risk stratificatiOn ScorE (ROSE). Low risk: Medical Research Council dyspnoea score (MRCDS)f3, 6-min walking distance (6MWD) .72% predicted (% pred) and composite physiologic index (CPI) ,41; intermediate risk: MRCDS .3, 6MWD ,72% pred or CPI .41; and high risk: MRCDS .3, 6MWD ,72% pred and CPI .41. p,0.0001. b) Prospective cohort, receiver operating characteristics curve of ROSE at the time of diagnosis versus 3-yr survival. Refer to table S3 for more details. c) Prospective cohort, intermediate risk group, Kaplan–Meier survival analysis grouped by 6-month changes of ROSE. p,0.0001. d) Prospective cohort, intermediate risk group, receiver operating characteristics curve of 6-month change of ROSE versus 3-yr survival; area under the curve 0.77, standard error 0.055, sensitivity 94% (95% CI 73–100%), specificity 41% (95% CI 25–58%). p-value ,0.0001.
The analysis of this retrospective cohort confirmed that ROSE predicted 3-yr survival with high specificity (91%) and even improved sensitivity (67%). The incidence and predictors of AE were also similar.
This study has some limitations. First, the independent confirmation cohort was retrospective, which can limit the reliability of the results. Reassuringly, however, despite some demographic differences, the main findings were confirmed. Secondly, the assessment of pulmonary hypertension, an important determinant of survival, was not available. Thirdly, the diagnostic criteria for AE still lack specificity, which is also common to other studies. Lastly, the number of subjects included was relatively small, although the population was homogenous and carefully selected.
In conclusion, the three main factors determining high risk of mortality in newly diagnosed IPF are advanced disease at presentation, rapid progression and occurrence of AE. AEs are more frequent during the first 18 months after diagnosis and in patients with CE. Due to their multifactorial nature, MRCDS, 6MWD and CPI are able to capture clinically important domains of IPF, including ventilatory and gas exchange impairment, increased dead space ventilation, peripheral muscle dysfunction and associated pulmonary hypertension. Consequently, the multifactorial ROSE could be used to risk-stratify patients at the time of diagnosis and detect rapid disease progression, providing guidance for the management of this life-threatening condition. Prospective studies on larger populations of newly diagnosed patients are necessary to confirm or refute these findings, and could potentially define a comprehensive, multidimensional prognostic index.
SUPPORT STATEMENT
The study was funded by Scuole di Specializzazione in Malattie dell’Apparato Respiratorio, Universita` di Roma ‘‘Tor Vergata’’ and Universita` degli Studi di Siena.
STATEMENT OF INTEREST None declared.
ACKNOWLEDGEMENTS
The authors thank O. Ferro (U.O. Statistica, Ospedale Civile, Imola, Italy), who suddenly and unexpectedly passed away in March 2012, for his assistance with the statistical analysis.
REFERENCES
1 Martinez FJ, Safrin S, Weycker D, et al. The clinical course of patients with idiopathic pulmonary fibrosis. Ann Intern Med 2005; 142: 963–967.
2 Raghu G, Collard HR, Egan JJ, et al. An official ATS/ERS/JRS/ ALAT statement: idiopathic pulmonary fibrosis: evidence-based guidelines for diagnosis and management. Am J Respir Crit Care Med 2011; 183: 788–824.
3 Selman M, Carrillo G, Estrada A, et al. 2007. Accelerated variant of idiopathic pulmonary fibrosis: clinical behavior and gene expres-sion pattern. PLoS ONE 2007; 2: e482.
4 Kim DS, Collard HR, King TE Jr. Classification and natural history of the idiopathic interstitial pneumonias. Proc Am Thorac Soc 2006; 3: 285–292.
5 Ley B, Collard HR, King TE Jr. Clinical course and prediction of survival in idiopathic pulmonary fibrosis. Am J Respir Crit Care Med 2011; 183: 431–440.
6 Panos RJ, Mortenson RL, Niccoli SA, et al. Clinical deterioration in patients with idiopathic pulmonary fibrosis: causes and assess-ment. Am J Med 1990; 88: 396–404.
7 Schwartz DA, Van Fossen DS, Davis CS. Determinants of progression in idiopathic pulmonary fibrosis. Am J Respir Crit Care Med 194, 149: 444–449.
8 Hubbard R, Johnston I, Britton J. Survival in patients with cryptogenic fibrosing alveolitis: a population-based cohort study. Chest 1998; 113: 396–400.
9 King TE Jr, Tooze JA, Schwarz MI, et al. Predicting survival in idiopathic pulmonary fibrosis: scoring system and survival model. Am J Respir Crit Care Med 2001; 164: 1171–1181.
10 Flaherty KR, Toews GB, Lynch JP 3rd. Steroids in idiopathic pulmonary fibrosis: a prospective assessment of adverse reactions, response to therapy, and survival. Am J Med 2001; 110: 278–282.
TABLE 5 Prospective cohort: acute exacerbations,
univariate analysis of variables at the time of diagnosis
Variable Hazard ratio
(95% CI)
p-value
Age at diagnosis yrs 1.02 (0.96–1.10) NS
Smoking pack-yrs 0.99 (0.95–1.03) NS
Time to diagnosis months 1.01 (0.98–1.04) NS
BMI m?kg-2 0.92 (0.79–1.07) NS MRC dyspnoea score 1.96 (1.18–3.30) 0.0095 6MWD m 1.00 (1.00–1.00) NS 6MWD % pred 0.98 (0.96–1.00) NS Desaturation at 6MWT# 0.43(0.10–0.97) 0.040 PA–a,O2mmHg 1.03(1.00–1.07) 0.053 FVC % pred 0.98 (0.95–1.01) NS DL,CO% pred 0.94 (0.90–0.98) 0.0007 CPI 1.05 (1.01–1.10) 0.022
HRCT fibrosis score % of total lung volume
1.05 (1.00–1.10) 0.063
BAL total cell count cells?mL-1 1.00 (1.00–1.00) NS
Concomitant emphysema 3.37 (1.12–11.17) 0.030
BMI: body mass index; MRC: Medical Research Council; 6MWD: 6-min walking distance; % pred: % predicted; 6MWT: 6-min walking test; PA–a,O2: alveolar–
arterial oxygen tension difference; FVC: forced vital capacity; DL,CO: diffusing capacity of the lung for carbon monoxide; CPI: composite physiologic index; HRCT: high-resolution computed tomography; BAL: bronchoalveolar lavage; NS: not significant.#
: no desaturation (arterial oxygen saturationf88%) during the 6MWT.
TABLE 6 Prospective cohort: acute exacerbations, Cox
proportional hazard analysis of variables at the time of diagnosis
Variable Hazard ratio (95% CI) p-value
DL,CO% pred 0.93 (0.89–0.97) 0.0008
Concomitant emphysema 3.20 (1.06–10.67) 0.040
DL,CO: diffusing capacity of the lung for carbon monoxide; % pred: % predicted. Model 1 (cut-off), p-value of the model 0.0004.
11 Mogulkoc N, Brutsche MH, Bishop PW. Pulmonary function in idiopathic pulmonary fibrosis and referral for lung transplanta-tion. Am J Respir Crit Care Med 2001; 164: 103–108.
12 Wells AU, Desai SR, Rubens MB, et al. Idiopathic pulmonary fibrosis: a composite physiologic index derived from disease extent observed by computed tomography. Am J Respir Crit Care Med 2003; 167: 962–969.
13 du Bois RM, Weycker D, Albera C, et al. 6-minute walk test in idiopathic pulmonary fibrosis: test validation and minimal clinically important difference. Am J Respir Crit Care Med 2011; 183: 1231–1237.
14 Lynch DA, Godwin JD, Safrin S, et al. High-resolution computed tomography in idiopathic pulmonary fibrosis: diagnosis and prognosis. Am J Respir Crit Care Med 2005; 172: 488–493.
15 Gay SE, Kazerooni EA, Toews GB, et al. Idiopathic pulmonary fibrosis: predicting response to therapy and survival. Am J Respir Crit Care Med 1998; 157: 1063–1072.
16 Prasse A, Probst C, Bargagli E, et al. Serum CC-chemokine ligand 18 concentration predicts outcome in idiopathic pulmonary fibrosis. Am J Respir Crit Care Med 2009; 179: 717–723.
17 Best AC, Meng J, Lynch AM, et al. Idiopathic pulmonary fibrosis: physiologic tests, quantitative CT indexes, and CT visual scores as predictors of mortality. Radiology 2008; 246: 935–940.
18 American Thoracic Society, European Respiratory Society. Idiopathic pulmonary fibrosis: diagnosis and treatment. Inter-national consensus statement. Am J Respir Crit Care Med 2000; 161: 646–664.
19 American Thoracic Society, European Respiratory Society. International multidisciplinary consensus classification of the idiopathic interstitial pneumonias. Am J Respir Crit Care Med 2002; 165: 277–304.
20 Sverzellati N, Wells AU, Tomassetti S, et al. Biopsy-proved idiopathic pulmonary fibrosis: spectrum of nondiagnostic thin-section CT diagnoses. Radiology 2010; 254: 957–964.
21 Akira M, Hamada H, Sakatani M, et al. CT findings during phase of accelerated deterioration in patients with idiopathic pulmonary fibrosis. AJR Am J Roentgenol 1997; 168: 79–83.
22 American Thoracic Society. Standardization of spirometry, 1994 update. Am J Respir Crit Care Med 1995; 152: 1107–1136.
23 American Thoracic Society. Statement: guidelines for the six-minute walk test. Am J Respir Crit Care Med 2002; 166: 111–117. 24 Enright PL, Sherrill DL. Reference equations for the six-minute
walk in healthy adults. Am J Respir Crit Care Med 1998; 158: 1384–1387.
25 Murciano D, Pichot MH, Boczkowski J, et al. Expiratory flow limitation in COPD patients after single lung transplantation. Am J Respir Crit Care Med 1997; 155: 1036–1041.
26 Thomeer M, Demedts M, Behr J, et al. Multidisciplinary interobserver agreement in the diagnosis of idiopathic pulmonary fibrosis. Eur Respir J 2008; 31: 585–591.
27 Mura M, Zompatori M, Pacilli AM, et al. The presence of emphysema further impairs physiologic function in patients with idiopathic pulmonary fibrosis. Respir Care 2006; 51: 257–265. 28 Mura M, Ferretti A, Ferro O, et al. Functional predictors of exertional
dyspnea, 6-min walking distance and HRCT fibrosis score in idiopathic pulmonary fibrosis. Respiration 2006; 73: 495–502. 29 Mura M, Belmonte G, Fanti S, et al. Inflammatory activity is still
present in the advanced stages of idiopathic pulmonary fibrosis. Respirology 2005; 10: 609–614.
30 Flaherty KR, Toews GB, Travis WD, et al. Clinical significance of histological classification of idiopathic interstitial pneumonia. Eur Respir J 2002; 19: 275–283.
31 King TE Jr, Schwarz MI, Brown K, et al. Idiopathic pulmonary fibrosis: relationship between histopathologic features and mor-tality. Am J Respir Crit Care Med 2001; 164: 1025–1032.
32 Nicholson AG, Colby TV, du Bois RM, et al. The prognostic significance of the histologic pattern of interstitial pneumonia in patients presenting with the clinical entity of cryptogenic fibrosing alveolitis. Am J Respir Crit Care Med 2000; 162: 2213–2217. 33 Nishiyama O, Taniguchi H, Kondoh Y, et al. A simple assessment
of dyspnoea as a prognostic indicator in idiopathic pulmonary fibrosis. Eur Respir J 2010; 36: 1067–1072.
34 Manali ED, Stathopoulos GT, Kollintza A, et al. The Medical Research Council chronic dyspnea score predicts the survival of patients with idiopathic pulmonary fibrosis. Respir Med 2008; 102: 586–592. 35 Aggarwal D, Mohapatra PR. Dyspnoea: a prognostic marker for
idiopathic pulmonary fibrosis. Eur Respir J 2010; 37: 476. 36 Eaton T, Young P, Milne D, et al. Six-minute walk, maximal
exercise tests: reproducibility in fibrotic interstitial pneumonia. Am J Respir Crit Care Med 2005; 171: 1150–1157.
37 Shorr AF, Wainright JL, Cors CS, et al. Pulmonary hypertension in patients with pulmonary fibrosis awaiting lung transplant. Eur Respir J 2007; 30: 715–721.
38 Arcasoy SM, Christie JD, Ferrari VA, et al. Echocardiographic assessment of pulmonary hypertension in patients with advanced lung disease. Am J Respir Crit Care Med 2003; 167: 735–740. 39 Collard HR, King TE Jr, Bartelson BB, et al. Changes in clinical and
physiologic variables predict survival in idiopathic pulmonary fibrosis. Am J Respir Crit Care Med 2003; 168: 538–542.
40 Latsi PI, du Bois RM, Nicholson AG, et al. Fibrotic idiopathic interstitial pneumonia: the prognostic value of longitudinal functional trends. Am J Respir Crit Care Med 2003; 168: 531–537. 41 Flaherty KR, Mumford JA, Murray S, et al. Prognostic implications
of physiologic and radiographic changes in idiopathic interstitial pneumonia. Am J Respir Crit Care Med 2003; 168: 543–548. 42 Jegal Y, Kim DS, Shim TS, et al. Physiology is a stronger predictor
of survival than pathology in fibrotic interstitial pneumonia. Am J Respir Crit Care Med 2005; 171: 639–644.
43 King TE Jr, Safrin S, Starko KM, et al. Analyses of efficacy end points in a controlled trial of interferon-gamma1b for idiopathic pulmonary fibrosis. Chest 2005; 127: 171–177.
44 Cottin V, Nunes H, Brillet PY, et al. Combined pulmonary fibrosis and emphysema: a distinct underrecognised entity. Eur Respir J 2005; 26: 586–593.
45 Cottin V, Le Pavec J, Prevot G, et al. Pulmonary hypertension in patients with combined pulmonary fibrosis and emphysema syndrome. Eur Respir J 2010; 35: 105–111.
46 Sergiacomi G, Bolacchi F, Cadioli M, et al. Combined pulmonary fibrosis and emphysema: 3D time-resolved MR angiographic evaluation of pulmonary arterial mean transit time and time to peak enhancement. Radiology 2010; 254: 601–668.
47 Mejia M, Carrillo G, Rojas-Serrano J, et al. Idiopathic pulmonary fibrosis and emphysema: decreased survival associated with severe pulmonary arterial hypertension. Chest 2009; 136: 10–15. 48 Kinder BW, Brown KK, Schwarz MI, et al. Baseline BAL
neutrophilia predicts early mortality in idiopathic pulmonary fibrosis. Chest 2008; 133: 226–232.
49 Song JW, Hong SB, Lim CM, et al. Acute exacerbation of idiopathic pulmonary fibrosis: incidence, risk factors and outcome. Eur Respir J 2011; 37: 356–363.
50 Rogliani P, Mura M, Mattia P, et al. HRCT and histopathological evaluation of fibrosis and tissue destruction in IPF associated with pulmonary emphysema. Respir Med 2008; 102: 1753–1761.