ContentslistsavailableatSciVerseScienceDirect
Structural
Change
and
Economic
Dynamics
j o ur n a l ho m e p age :w w w . e l s e v i e r . c o m / l o c a t e / s c e d
Can
we
really
trust
offshoring
indices?
!
Davide
Castellani
a,b,e,∗,
Luca
De
Benedictis
c,
Daniel
Horgos
d,e aDepartmentofEconomics,FinanceandStatistics,UniversityofPerugia,ItalybIWH,Halle,Germany
cDepartmentofEconomicandFinancialInstitutions,UniversityofMacerata,Italy dDepartmentofEconomics,HelmutSchmidtUniversity,Hamburg,Germany eCentroStudiLucad’Agliano,Milan,Italy
a
r
t
i
c
l
e
i
n
f
o
Articlehistory: ReceivedMay2011
ReceivedinrevisedformOctober2012 AcceptedOctober2012 Available online xxx JELclassification: F14 F10 Keywords: Offshoring Structuralchange Input–outputindices
a
b
s
t
r
a
c
t
Thispaperarguesthatoffshoringindicesoftenmeasuresomethingdifferentthanwhatwe thinktheyare.Usingdatafrominput-outputtablesof21Europeancountriesfrom1995 to2006wedecomposeanoffshoringindex,distinguishingbetweenadomestic(structural change)andaninternationalcomponent(importedinputsratio).Regardingoffshoringof businessservices,alargeshareoftheindexvariationisdrivenbythedomesticcomponent. Thisisevenmorepronouncedforoverallserviceoffshoring.Inthecaseofmaterial off-shoring,bycontrast,theinternationalcomponentdrivesthemainvariationoftheindices. Ourresultsthereforeshowthat,regarding(business)services,thetypicalcalculationof offshoringindicestends tooverestimatetherole oftheimported inputscomponent, neglectingtheroleplayedbystructuralchangesintheeconomy.
© 2012 Elsevier B.V. All rights reserved.
1. Introduction
Offshoring is one of the main ingredients of con-temporary international trade. Its relevance is growing widely all over the world, and is both orienting the politicalagendaofcountriesaswellasshapingtheway ! TheauthorsthankthetwoanonymousrefereesofSCED,aswellasthe participantsoftheETSGConference(Lausanne2010)andtheWorkshop on‘TheRoleofBusinessServicesforInnovation,Internationalisationand Growth’(Rome2010),forhelpfulcomments.WealsothankRosarioCrinó, AlessiaLoTurco,andCeciliaJona-Lasinioforthehelpfuldiscussiononthe topicofthepaper.Theusualdisclaimerapplies.Financialsupportfromthe ItalianMinistryofUniversityandResearch,Prin2009‘Production,R&D andknowledgeoffshoring:economicanalysesandimplicationsforItaly’ (Castellani)and“Theinternationaltradenetwork:empiricalanalyses andtheoreticalmodels”(http://www.tradenetworks.it)(DeBenedictis) isgratefullyacknowledged.
∗ Correspondingauthorat:DepartmentofEconomics,Financeand Statistics,UniversityofPerugia,Italy.
E-mailaddresses:[email protected](D.Castellani),
[email protected](L.DeBenedictis),[email protected](D.Horgos).
economiststhinkaboutinternationaltradeandits conse-quences(FeenstraandHanson,1996a,b,1999;Arndt,1997, 1998a,b;GrossmanandRossi-Hansberg,2008).Parallelto itsrelevance,theuseofthetermissomehowfuzzyandits quantificationisproblematic.
Fromaterminologicalpointofview,offshoringcanbe broadlydefinedasafirm’sallocationofbusinessactivities toanothercountry,eitherbyobtaininggoodsandservices fromanunaffiliatedforeignsupplierorbyinvestingina foreignaffiliateorjointventure.Sincethereisno standard-izedtermyet,variousattemptshavebeenmadetogivethe phenomenonapropername.Thispaperusesthroughout thetermoffshoring.1
1 Whiletheterminternationaloutsourcingisalsoverycommon, off-shoringhasamuchlongerhistoryandcanbetracedbackto1895(Amiti
andWei,2005a;Horgos,2009b).Especiallyinrecentyears,with
numer-ouscontributionson(business)servicesandfirmleveltrade,theterm offshoringexperiencedarenaissance(Winkler,2010;Crinò,2009;Crinò,
2012;AmitiandWei,2005a,b;Wagner,2011;Schwörer,2012;Falzoni
0954-349X/$–seefrontmatter © 2012 Elsevier B.V. All rights reserved.
Since offshoring activities are usually difficult to be observedthroughfirm-levelinformation,direct compara-tiveevidenceandevaluationisactuallyhighlyimprobable. However,therelevanceofthephenomenonandits possi-bleconsequencesonthedomesticlaborandgoodsmarkets haveencouragedquantificationbasedonindirectevidence. Thus,variousproxiesforthemainunobservedvariableof interest,i.e. theoffshoringactivities ofa representative domesticfirm,havebeenproposedintheliterature.Since offshoringinvolvesasubstantialflowofimportsof inter-mediategoodsandservices(Feenstra,1998),input–output tableshavebeenextensivelyusedtocomputeindicesof offshoringatthesectoralandaggregatelevel.2
Mostoftheoffshoringindices relateimported inter-mediatesusedintheproductionofanindustrytosome kindofnormalization,ase.g.thetotalvalueofthe indus-try’sproduction.Thisincorporatestheidea,alongthelines of Feenstra (1998), that the share of imports of inter-mediate goodsand services over production should be associated with a higher relevance of offshoring. What mostoftheliteratureusingthesekindofindicesfor empir-icalexaminationsneglectsis thattheindicesaredriven bytwoverydifferentcomponents:theshareofimported todomesticallyproducedintermediates,whichisthetrue internationalcomponent, and theshare ofdomestically producedinputsintotalproductionoftheindustry,which insteadisrelatedtothestructuralchangeoftheeconomy (domesticcomponent).
Inthispaper,wecontributetothisdomesticvs. interna-tionaldimensiondebateonanempiricalground.Inorderto separatethetwocomponents,weapplyashift-and-share decompositionofacommonlyusedoffshoringindexover time.Inparticular,(i)thefirstcomponentmeasuresthe shareofimportedbusinessservicesrelativetotheuseof domesticallyproducedbusinessservices,andcanbethe resultofaprocessofoffshoring;(ii)thesecondcomponent measurestheshareofdomesticallyproducedbusiness ser-vicesusedin productionin themanufacturingindustry, whichisaproxyforthedegreeofdomesticoutsourcing, entailingtheprocessofstructuralchange.Forcomparison, wealsocomputethesamedecompositionforthecaseof overallservicesandmaterialinputs andweadditionally focusontheserviceindustryastheusingsector.
Themainresultofourcontributionisthattheincrease inimportofbusinessservicesinmanufacturingproduction, usedas anindicatorof therise in businessservice off-shoring,isgrosslyoverestimatingtheactualincreaseinthe relianceonforeignproducedservicesinmanycountries. Thesameistrueforoverallservicesandtoalessextent tomaterialinputs.Thus,theadvicethatweobtainfrom
andTajoli,2010;Jona-Lasinio,2010;OECD,2006).Inthecontributionat
handwesticktothistradition,evenwhenbeingawareofthatseveralcited papersuseinternationaloutsourcinginstead.Itisimportanttonotethat whenusingoffshoringwedonotdistinguishiftheimportedintermediate isproducedinhouseorboughtfromanunaffiliatedsupplier.
2 SeeHorgos(2009a)foranoverviewofdifferentindicesusedasproxies
foroffshoringactivities,theirquality,andtheirperformancewhenbeing usedinestimatinglabormarketeffects.Themainadvantagesand limi-tationsofusinginput–outputtableshavebeenhighlightedinChenetal.
(2005),Feenstraetal.(2010).
thispaper’sanalysisisthatweshouldnotreallytrust off-shoringindices,whenbeingcalculatedinatraditionalway (especiallywhenassessingserviceoffshoring).
Therestofthepaperisorganizedasfollows.Section2 discussestherelevantliterature,whileSection3provides theformaldetailsofindexcalculationanddecomposition intothedomesticandinternationalcomponent.Our empir-icalanalysisalongwiththeresultsobtainedispresentedin Section4.Section5concludes.
2. Abriefsketchoftherelevantliterature
Empirical contributions using offshoring indices presentstrongevidenceofanincreasingoffshoring activ-ity for a large set of different economies. Concerning materialoffshoring,CampaandGoldberg(1997)calculate theoffshoringactivityfortheUS,Canada,UK,andJapan, whereasStrauss-Kahn(2003)presentsstatisticsforFrance. Geishecker and Görg(2005) or Horgos (2011) examine offshoringinGermanyandDaveriandJona-Lasinio(2008) aswellasFalzoniandTajoli(2010)dothesameforthe Italian economy. Withrespecttoservice offshoring,see e.g. Winkler (2010) for evidence on Germany or Crinò (2009), Crinò (2012) for a comparative overview. Liu et al. (2011) examine location determinants of service offshoring.Theevidenceputforwardbyallthisliterature is highlyconsensual:offshoringis strongandishereto stay.
Atthesametime,afterasetbackduringthe1980s, struc-turaltransformationinthemanufacturingsectorhasbeen accelerating both in advanced and newly industrialized economies(MemedovicandIapadre,2009).
In thetraditionof Cheneryetal.(1986)a numberof studieslookatthelongtermandpersistentshiftsinthe sectoral composition of economic systems. Among oth-ers, McMillan and Rodrik (2011) emphasize that when, in developing countries, resourcesmove fromless pro-ductivetomoreproductiveactivitiestheeconomygrows even if there is no productivity growth within sectors. Accordingly, they show that a reshuffling of resources (e.g.labor)fromlowtohigh-productivitysectors,andthe consequent change in the composition of value added sharesintheeconomy,arekeydriversofdevelopmentand economicgrowth.Inadvancedeconomies,ithasbeen doc-umentedthatthedecreaseintheshareofmanufacturing activitieshascoexistedwithanincreasingimportanceof serviceactivitiesrelatedtoproductionandwitha grow-inginterdependencebetweenmanufacturingandservices. Forexample,MontresorandVittucciMarzetti(2011)apply asubsystemapproachoriginallydevelopedbyMomigliano andSiniscalco(1982)andshowthattheintegrationof busi-nessservicesintothemanufacturingsubsystemincreased (intermsof employment)in 7OECDcountries(Canada, Denmark,Germany,France,Japan,UKandUSA)from19.9% intheearly80sto25.9%inthemid-90s.Thisexplainsmost (althoughnotall)ofthedeclineintheshareofemployment inthemanufacturingsubsystemoverthesameperiod.3The
3SimilarresultshavebeenfoundforItalybyMomiglianoandSiniscalco
processoftertiarizationthattakesplaceinmost industri-alizedeconomiesresultsmainlyfromtheoutsourcingof serviceactivitiesthatwerepreviouslycarriedoutwithin manufacturingfirms.Thereasonswhythemanufacturing industryincreasestheuseofexternalservicesaremanifold. Inmodern,specializedeconomies,thecomplexityofnew productionprocessesdemandsforadditionalcoordination andcontrol(Greenfield,1996).Especiallywithregardto anincreasein(vertical)specialization,demandfor addi-tionalservicelinkstoorganizeproductionrises(Jonesand Kierzkowski,1990;Francois,1990a,b).Also,product differ-entiationmayincreasetheneedforadditionalservicetasks. Thesupply ofmodern,innovativeservicesthat comple-mentcorecompetenciesofmanufacturingfirmsmayalso increaseoutsourcingactivitiesinthemanufacturingsector (MacPhersonandVanchan,2010;GreenhalghandGregory, 2001).Thisprocessofoutsourcingnon-coreservice activi-tiesallowsmanufacturingfirmstofocusmoreontheircore competenciesenhancingfirms’productivity(Prahaladand Hamel,1990).4
Thequestionthatimmediatelyfollowsfromthe obser-vationoftherecentcoevolutionofoffshoringandstructural changeisifthestrongincreaseoftheoffshoringofservices that hasbeenreportedinthe lastdecadesis capturing, somehowspuriously,thewidespreadincreaseinservice inputs demanded by the manufacturing industry more thananactualincreaseintheshareofimportedservices usedbythemanufacturingindustry.Wesubmitthatthe commonly used indices of service offshoring based on input–outputtables,whichcalculatetheshareofimported serviceintermediates intotal production(orinputuse), are not separating,as theyshoulddo, theinternational dimensionofoffshoringfromthedomesticdimensionof technologicaland/orstructuralchange,i.e.forexamplethe increasinguseofservicesinmanufacturingproduction.A prevalenceofthesecondcomponentandaminorroleof thefirstonewouldindicatethatwhatiscapturedbythe offshoringindicesmayhavelittletodowithoffshoring.
Inthisperspective,ourpaperconnectstoanimportant debateonwhetherthedeclineinvalueaddedinthe man-ufacturingindustryinindustrializedeconomiesisdueto anincreaseinimportedintermediatesortoamore inten-siveuseofdomesticallyproducedservicesinstead.Inthis respect,Sinn(2005)reportedthatinthelasttwodecades thegrowthofvalueaddedintheGermanmanufacturing sector didprogressively fall behind thegrowth in pro-ductionand,becauseofthispattern,labeledtheGerman economy withthenicknameofa “BazaarEconomy”.He arguedthatfirmsin themanufacturingsectorwere act-ingasawheel,importingintermediatesfromabroadand (afterafewminorchanges)sellingthefinalcommodities onthedomesticandespeciallytheworldmarket.The crit-icsofthisthesis(e.g.MorganStanley,2004a,b;Financial TimesGermany,2004a,b,c)opposedthatthegapbetween output and value added could be explained by simple
4Inthebusinessliterature,theincreasedlinkagebetween manufac-turingandservicesandthesoresultingrisingserviceintensityisalso denotedasservitizationofbusiness(VandermerweandRada,1988;Pilat
andWölfl,2005).
tertiarization,withmanufacturingfirmssourcingservice tasks from the domestic service sector. The domestic dimensionwasconsideredtobeprevalentwithrespect totheinternationaloneassociatedwiththe“Bazaar Econ-omy”hypothesis.
3. Theoffshoringindex
In order to illuminate why and how the offshoring indicesaredrivenbythesetwodifferentcomponents,we discusstheformaldetailsonindexcalculationinthis sec-tionbeforepresentingourempiricalresultsinSection4. Thevastmajorityofcontributionsmeasuringoffshoringat thesectoralandaggregatelevelreliesonindicatorsbased onimportsofintermediategoodsnormalizedbythesize oftheindustry.5 We followthis traditionand focusour
analysisonthefollowingindex: OffW jt =
!
w∈Wmwjt pjt . (1)TheindexinEq.(1)relatesthesumofimportedinputs mw
jtsuppliedbyindustriesw∈Wandusedinindustryjto
thetotalvalueofproduction,pjt,inindustryjattimet.In ouranalysisweconsiderthreedifferentsetsofinputsW:all serviceinputs(W=ser),thesubsetofbusinessservice activ-ities(W=bs),andintermediatematerialinputs(W=mat). Asforthelevelofdisaggregationoftheusingindustry,we mainlyfocusontheaggregateofmanufacturingindustries (j=man),butwealsoperformacomparativecheckforthe serviceindustry(j=ser).Itisworthmentioningthat,as dis-cussedin Horgos(2009a),onecouldimplementvarious alternative normalizations. In particular, one frequently usedalternativetototalproductionpjtistotalimportsor grossoutput(Yeats,2001;Egger andEgger,2002;Chen etal.,2005;GeisheckerandGörg,2005).Othershaveused theamountoftotalnon-energyintermediateinputs( Jona-Lasinio,2010).Itcanbeeasilyshownthatouranalysiscan beextendedtoanyotherpossiblenormalization,sincethe import-relatedpart(thenumeratorinEq.(1))wouldnot changeunderalternativenormalizations(thedenominator inEq.(1)).Therefore,anyalternativenormalizationfactor, ajt,willberelated totheoneusedinequation1bythe proportionalityratiopjt
ajt.
6
5 Seee.g.FeenstraandHanson(1996a,b),Hummelsetal.(2001),Yeats
(2001),EggerandEgger(2002),Strauss-Kahn(2003),Hijzenetal.(2004),
AmitiandWei(2005a,b),GeisheckerandGörg(2005),Geisheckerand
Görg(2008),Hijzen(2007),orHorgos(2011).
6 Authorswhouseinput–outputindicesoftencalculatethemat differ-entlevelsofaggregation:a“broad”anda“narrow”versionoftheindex
(seee.g.FeenstraandHanson,1996a,b,1999;Olsen,2006;Horgos,2011).
Whilethe“broad”variantconsidersallpossibleimportedinputs,the “narrow”versionconsidersonlyimportedinputsofthesametwo-digit industryj.Often,bothformsarepresentedinordertotestrobustness oftheresults.Evenwhenthenarrowmeasuremayexhibitsome advan-tages,e.g.tobeinlinewiththeWTOmode1definitionofoffshoring(Olsen, 2006),itisnotpossibletocalculatethisindexforthecontributionathand: anarrowindexcanperdefinitionnotbecalculatedwhenfocusingon (business)serviceoffshoringofmanufacturingindustries.Notehowever thatallthreevariantscalculatedinthiscontribution(businessservice, service,andmaterialoffshoring)arealsonotofthe“broad”form.They includenotallbutspecificsubsetsofinputs.Whilecomparingservice
TheindexinEq.(1)canbedecomposedintotwoparts: OffW jt =
!
wmwjt pjt =" !
wmwjt!
wuwjt −mwjt# " !
wuwjt−mwjt pjt#
=" !
wmwjt!
wdwjt#
" !
wdwjt pjt#
=MW jt ·OWjt, (2) whereuwjt anddwjt denotethevalueoftotalanddomestic
inputw(respectively),usedbysectorjattimet.
Eq.(2)highlightsthattheoffshoringindexusedinthe literatureisinfactcomposedoftwoparts:MW
jt andOWjt.
Ontheone hand,there isthevalue ofimported inputs inthesetWasashareofthevalueofdomestically pro-ducedinputs(inthesameset)usedintheproductionof sectorjattimet,whichreflectstheextenttowhichagiven setofinputsisimportedratherthansourceddomestically. Forexample,whenWdenotesthesetofbusinessservices inputs(W=bs),thiswilltellushowmuchbusinessservices usedinproductionofagivengoodisboughtfromforeign suppliers(i.e.imported),ratherthanbeingpurchasedfrom domesticcompanies.Werefertothisratioastheimported inputsratio(MW
jt ).Ontheotherhand,theindexincludesthe
shareofdomesticinputsinthesetWusedinthetotalvalue ofproductionofgoodjattimet.Thiscanbethoughtasa measureofthedegreeofstructuralchangeordomestic out-sourcingofinputsWinindustryjattimet(OW
jt),thatishow
muchafirmbuys,forexample,businessservicesfromother domesticfirmsratherthanproducingthemwithinthefirm. WhileMW
jt reflectsthecontributionofinternational
trans-actions,OW
jt dependsondomesticactivitiesonly.7
The contribution of international transactions, as opposedtothedomesticcomponent,tothedynamicsofthe offshoringindexcanbeexaminedapplyinga shift-share analysistoEq.(2).Thechange(denotedby!)intheindex overtimeisthesumofchangeofthedifferentcomponents, whenkeepingtheothercomponentfix(denotedbya“bar” overthevariables).8
!OffWj =!(O·M)Wj =(!O·M)Wj +(O·!M)Wj , (3) Thus,foranyW=bs,serv,mat,anincreaseinOffW
j from
ttot+rcanbedrivenbyeitherincreasingimportedinputs (e.g.business services if W=bs)as a share of domesti-callyproducedones,(O · !M)W
j ,whichisconsistentwith
amoreintenseuseofoffshoring,orbydeepeningtheshare ofthesetofinputsboughtfromdomesticsuppliersand offshoringwiththespecificcaseofbusinessserviceoffshoring,wetryto beasconservativeaspossible.
7 It is worth noting, that our index can be fur-ther decomposed into the following expression: OffW
jt = [(
!
wmw jt)/(!
wd w jt)][(!
wd w jt)/(!
wu w jt][(!
wu w jt)/(pjt)].While differ-entiatingbetweentheuseofimportedinputsvs.domesticinputs(the firstpartoftheexpression),theuseofdomesticinputsinpercent(the secondpart),andtheuseofinputsinproduction(thethirdpart),aforeign componentwouldbepartofanyofthethreepartsofthedecomposition (remember: mwjt=u w jt−d
w
jt).Thus, it would beimpossible to clearly separatetheinfluencesofchangeshappeningatthedomesticandatthe foreignlevel.
8 Inordertofixoneofthecomponents,weusethemeanvalueofthe firstandthelastyearofobservation.
usedinproduction,(M·!O)Wj .Welabelthefirstonethe internationalcomponentandthesecondonethedomestic component.
Todistinguishbetweenthesetwocomponentsisone ofthecoreexerciseinthisanalysis.Sincemostprevious contributions thatuseinput–outputbased indicesshow anincreaseinoffshoringactivities,itisimportantto iden-tifytowhatextentsuchreportedpatternisactuallydriven byamoreintensiveuseofimportedinputs,orbya(more general)risein outsourcingofintermediates.Inthe lat-ter case, theindices arenot revealinganyinternational activity, however, theymay still capture some specific sourcing strategy, namelyan increase in domestic out-sourcing,whichinthecaseof(business)servicessuggests sometertiarizationandstructuralchangeoftheeconomy. 4. OffshoringinEuropeaneconomies
Inordertoshedlightonthecontributionofthedomestic andinternationalcomponentstothevariationofoffshoring indices we use data from the Eurostat’s input–output tables, combininginformation from21EU countries.As mentionedbyFeenstraetal.(2010),amajordrawbackof moststudiescalculatingoffshoringindicesonthebaseof input–outputdataisthat,duetothelackofimporttables forthevariousinputs,theyneedtoassumethattheshareof importofagivenintermediateinputisequaltotheshareof importoffinalgoods(importproportionalityassumption). Forthe21Europeancountriesconsideredinthisanalysis, Eurostatprovidesaspecificimportmatrixforintermediate inputsthatallowsustoovercometheimport proportion-alityassumptionandtotrackdomesticandinternational inter-sectorallinkages.9
Sincedifferentcountriesprovidedatafordifferenttime periods(from1995to2006),withyearlydatanotalways available,wecompute!OffWj foreachcountry,usingthe firstandlastyearofavailabledata.Wefocusonthe man-ufacturing industry as the using industry (j=man) and computethedecompositioninEq.(3)forthesubsetof busi-nessserviceinputs(w=NACE71–74andW=bs).Thechoice ofthislevelofanalysisisduetotheincreasedrelevanceof theinterlinkagesbetweenbusinessservicesand manufac-turingforthecountries’economicgrowth(Guerrieriand Meliciani,2005),asdiscussedintheintroductionabove.For comparison,weextendouranalysisalsotooffshoringofall serviceinputs(w=NACE01–37,exceptforNACE10–12and W=serv)aswellasintermediatematerialinputs(w=NACE 50–74andW=mat)bythemanufacturingindustry.Finally, asacomparativecheck,wereplicateourdecomposition focusingontheserviceindustryastheusingsector(j=serv). Thisallowsustoinvestigatetowhatextentoffshoringof servicetaskshasalsocharacterizedtheserviceindustry. 4.1. Degreeandtrendsinoffshoring
InTable1wereportthevaluesoftheOffW
man,t indices
forthe21EUcountries,consideringthefirstperiodt0 of
9SeeFeenstraandJensen(2012)forarecentattempttoovercome
thelimitsimposedbytheimportproportionalityassumptiontotheUS input–outputoffshoringindices.
Table1
Degree ofoffshoring inthe manufacturingindustryin21European countries. Country Offbs man,t0 Off ser man,t0 Off mat man,t0 WesternEurope Austria 0.27% 0.87% 21.9% Belgium 0.53% 2.12% 31.8% Denmark 0.45% 0.52% 19.6% Finland 1.53% 2.58% 15.7% France 0.32% 0.81% 13.7% Germany 0.21% 0.53% 13.6% Greece 0.21% 0.47% 13.6% Ireland 10.26% 12.24% 29.2% Italy 0.44% 1.34% 14.6% Netherlands 0.75% 1.69% 25.2% Norway 0.72% 1.54% 17.6% Portugal 0.24% 0.51% 22.8% Spain 0.75% 1.04% 15.5% Sweden 0.85% 1.88% 18.8% Median 0.49% 1.19% 18.2% Inter-quartilerange (0.46%) (1.23%) (7.8%) EasternEurope Estonia 0.41% 1.41% 38.4% Hungary 2.43% 2.55% 34.3% Lithuania 0.11% 1.50% 17.7% Poland 0.20% 0.53% 20.4% Romania 0.72% 1.05% 13.2% Slovakia 1.40% 2.75% 35.2% Slovenia 0.27% 1.27% 26.2% Median 0.41% 1.41% 26.2% Inter-quartilerange (0.82%) (0.86%) (15.7%) CorrelationwithGDP −0.164 −0.192 −0.310
availabledata.ThevalueofOffmat
man,t0isclearlyhigherthan for Offser
man,t0 (asshowne.g. byAmitiand Wei(2005a,b)
fortheUSandtheUK,aswellasbyWinkler(2010)for Germany),whichinturnishigherthanOffbs
man,t0.However,
remarkabledifferencesemergeacrosscountries.Offmat man,t0
rangesfromover30%inEstoniaandHungary,tolessthan 15%inFrance,Germany,Greece,ItalyandRomania.Import ofservice(Offser
man,t0)andbusinessservice(Off
bs
man,t0)inputs
accountforabout2%and1%,respectively,butagainwith strikingdifferencesacrosscountries.Themedianvalueof Offser
man,t0 and Off
bs
man,t0 is surprisingly similar in Eastern
and WesternEuropeancountries, whileOffmat
man,t0 is
sub-stantially higherin theformergroup.Thisis somewhat consistentwiththeideathattheshareofimported inter-mediatesintotalproductionmaybeinflatedbytheactivity ofincomingmultinationals,whichhavebeenveryactivein EasternEuropeancountriesoverthelastdecades(wewill getbacktothisissueingreaterdetailbelow).Inthethree casesconsidered,thelevelofOffW
man,t0 isalsonegatively
correlatedwiththesizeofcountries(measuredbyGDP), suggestingthatsmallercountriesmaybemoreinvolvedin offshoring,althoughthiscorrelationisrelativelymild.
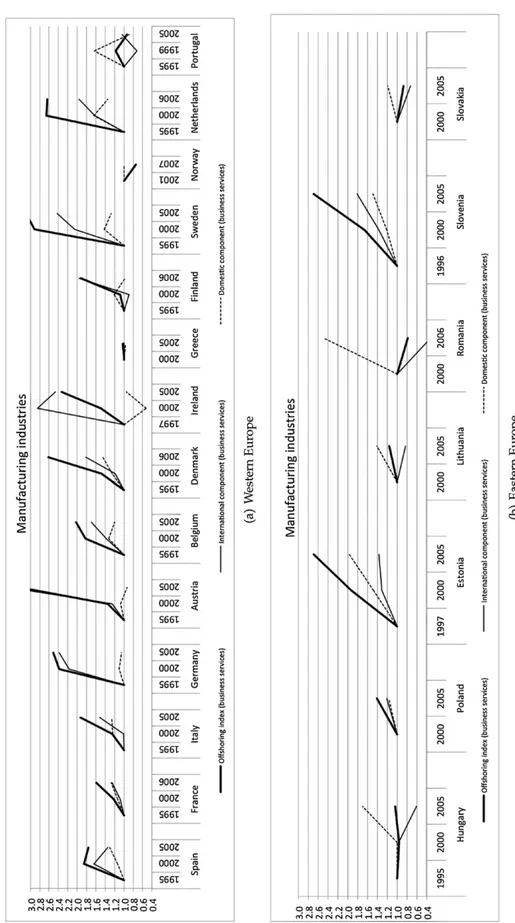
In Fig. 1we plot Offbs
man,t,as wellas theMman,tbs and
Obs
man,tcomponents,overtime,normalizingthemtoonein
thefirstyearofobservation.Resultsshowthattheshare ofimportedbusinessservicesintotalmanufacturing pro-duction(Offbs
man,t)rosesubstantially overthe1995–2006
period in most countries. However, while in countries suchasGermanyandAustria,thegrowthintheshareof
domesticallypurchasedbusinessservicesintotal produc-tion(Obs
man,t)isnegligible,inothercountries,suchasFrance,
Spain,Italy,Denmark,Estonia, Hungaryand Slovenia,is not.Asaresult,inthislattergroupofcountriesthegrowth intheratioofimportedoverdomesticallyproduced busi-nessservicesusedinmanufacturingproduction(Mbs
man,t)
islowerthanthegrowthinimportedbusinessservicesin totalmanufacturingproduction.
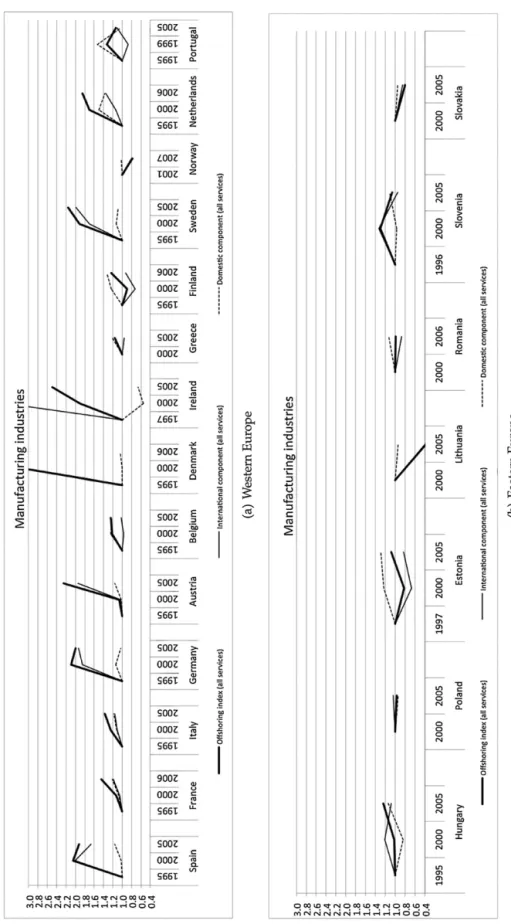
Thispatternisevenmorepronouncedforserviceinputs as a whole. As depicted in Fig. 2, Oser
man,t grew at the
same(oranevenhigher)ratethanMser
man,tinItaly,France,
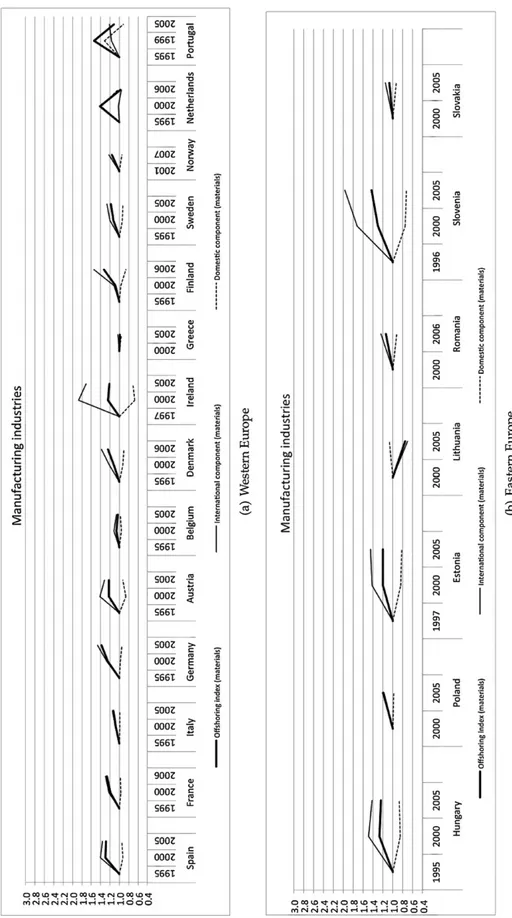
Belgium,Greece, Finland,Netherlands, Portugal, Estonia andRomania.Conversely,inthecaseofmaterial interme-diateinputs,Fig.3showsthatOmat
man,t hasbeendeclining
inmostcountries,whileMmat
man,thasincreased.To
summa-rize,theevidencesuggeststhatinthecaseoftheaggregate ofserviceinputsand(toalesserextent)forthesubsetof businessservices,structuralchangemayhaveplayeda sig-nificantroleininflatingthemeasuresofoffshoringusedin theliterature.Wewillexplorethisaspectingreaterdetail usingtheshift-sharedecompositionproposedinequation 3.
4.2. Shift-shareanalysis
Thissectionanalyzesthedifferentcontributionsofthe imported inputs ratio(MW)and structural change(OW)
to the change of import of inputs W in total produc-tion(!OffW
man)ingreaterdetail. Inparticular,we report
the shift-share decomposition proposed in Eq. (3). For each ofthe21 EUcountriesconsideredinthis analysis, Tables 2 and 3report !OffW, theinternational
compo-nent,(O·!M)Wman,thedomesticcomponent,(M·!O)Wman, aswellasthepercentagecontributionoftheinternational componenttotheoverallchangeoftheoffshoringindex, ((O·!M)Wman/!OffWman).
4.2.1. (Business)serviceinputs
ResultsinTable2revealsthattheshareofimported business services in total manufacturing production (!Offbs
man)increasedin17 outof21countries. Withthe
exceptionofIreland(whereitincreasedby13.6%points), Sweden(1.79%points),Finland(1.41)andtheNetherlands (1.22),!Offbsman rose byless than 1 percentagepoint in mostcountries. However, given thelow level of Offbs
man
documentedinTable1,thegrowthrateisoftencloseor above100%,asshown inFig.1.Thisgrowthwouldlead toconclude,in linewith existing literature,that in the 1995–2005period,businessserviceshavebeen substan-tiallyoffshored.Theshift-sharedecomposition,allowsto appreciatethatthispatternistheresultofthejoint contri-butionofboththeinternationalanddomesticcomponents. Onlyinfivecountries(Austria,Finland,Germany,Greece andIreland)apositivecontributionof(O·!M)Wmanhasnot beenaccompaniedbyasignificantsubstantial(M·!O)Wman. Themedianfor(O·!M)bsman
!Offbsman
isbelow70%inWesternEurope, suggestingthatinhalfofthesecountries,thecontribution ofthedomesticcomponent,(M·!O)bsman,to!Offbsman has
Fig.1.ImportedintermediatesratioandoutsourcinginEurope:businessserviceinputs.Numbersarenormalizedto1forthefirstyear. Datasource:Eurostatinput–outputtables.
Fig.2. ImportedintermediatesratioandoutsourcinginEurope:serviceinputs.Numbersarenormalizedto1forthefirstyear. Datasource:Eurostatinput–outputtables.
Fig.3. ImportedintermediatesratioandoutsourcinginEurope:materialinputs.Numbersarenormalizedto1forthefirstyear. Datasource:Eurostatinput–outputtables.
Table2
Shift-sharedecompositionofoffshoringindicesforEuropeancountries:businessservicesinputs.
Country(timeperiod) Manufacturing(15–37)(percentagepointschange)
!Offbsman (O·!M) bs man (M·!O) bs man ((O·!M) bs man)/(!Off bs man) WesternEurope Austria(1995–2005) 0.60 0.64 −0.04 107% Belgium(1995–2005) 0.54 0.41 0.14 75% Denmark(1995–2006) 0.73 0.44 0.28 61% Finland(1995–2006) 1.41 1.45 −0.05 103% France(1995–2006) 0.19 0.09 0.10 49% Germany(1995–2005) 0.31 0.30 0.02 94% Greece(2000–2005) 0.00 0.01 −0.01 – Ireland(1997–2005) 13.60 14.60 −1.00 107% Italy(1995–2005) 0.40 0.26 0.15 64% Netherlands(1995–2006) 1.22 0.84 0.38 69% Norway(2001–2007) −0.18 −0.18 −0.01 −97% Portugal(1995–2005) −0.02 0.01 −0.03 62% Spain(1995–2005) 0.56 0.30 0.26 53% Sweden(1995–2005) 1.79 1.38 0.40 77% Median 0.555 0.353 0.058 68.89% Inter-quartilerange (0.875) (0.657) (0.256) (33.13%) EasternEurope Hungary(1995–2005) 0.09 −1.28 1.37 – Lithuania(2000–2005) 0.02 −0.02 0.04 −135% Poland(2000–2005) 0.08 0.04 0.04 55% Romania(2000–2006) −0.16 −0.86 0.70 −544% Slovakia(2000–2005) −0.19 −0.42 0.23 −220% Slovenia(1996–2005) 0.45 0.27 0.18 59% Estonia(1997–2005) 0.69 0.22 0.47 32% Median 0.080 −0.023 0.227 −51.44% Inter-quartilerange (0.339) (0.771) (0.472) (247.69%) CorrelationwithGDP −0.082 −0.063 −0.087 0.207
itisstrikingtonoticethat,whiletheinternational compo-nentispositiveonlyin3outof7countries,thedomestic componentisalwayspositiveand(withtheexceptionof Slovenia)biggerthantheinternationalcomponent.10This
isconsistentwiththeideathat,whileatrendtowardsthe increaseinbusinessservicecontentofmanufacturing pro-ductionhasbeencharacterizingtheadvancedeconomies inthe70sthroughthe90s,ithasreachedEasternEuropean countriesbetweentheendofthe20thandthebeginning ofthe21stcentury.
To summarize, ourdecomposition suggests that the usualindices of business service offshoringwould tend tooverestimatetheactualincreaseinthedependenceon importedinputs,duetoaconcurrentsignificantchangein theorganizationofproductionofbusinessservicesusedin themanufacturingindustriesofmostEuropeancountries. Thisisevenmoreevidentinthecaseofoverallservices. Table3(leftpanel)showsthat!Offserman ispositiveinall butfivecountries(Lithuania,Norway,Poland,Romaniaand Slovakia),butonlyin8countriestheinternational compo-nentcontributes tomorethan 50%ofthechangeinthe offshoringindex.Themedianfor((O·!M)serman)/(!Offser
man)
is 61.5% in Western Europe and −83.4% in Eastern Europe.Insomecountries,includingBelgium,France,Italy, NetherlandsandHungary,thecontributionof(M·!O)bsman
10Itisworthnotingthat!Offbs
manand((O·!M) bs man/!Off
bs
man)areonly mildlycorrelatedwithGDPandwithoppositesigns.
wasevenlargerthanthecontributionof(O·!M)bsman.For example,inthecaseoflargeEUcountriessuchasItalyand France,theserviceoffshoringindexroseby0.49and0.36 percentagepointsrespectively,butthecontributionofthe growthofimportedservicesisjustabout0.23and0.17% points,respectively.Inafewcases,suchasFinland,Greece, Norway,Estonia,RomaniaandSlovenia,theinternational componentisevennegative,whilethedomestic compo-nentispositive.Thispatternmayevenbeconsistentwith asubstitution offoreignservice producerswith domes-ticones.Inotherwords,inmanycountriestheobserved growthintheshareofimportedservicesintotalproduction dependscruciallyonthegrowthofservicesusedin pro-duction,mostlikelyduetothefactthatfirmsoutsourced servicesthatwerepreviouslyproducedinternally. 4.2.2. Materialinputs
Ratherdifferentconsiderationsemergewhenwe con-sider the subset of material inputs: Offmat
man,t has been
growing in all but five countries(Table 3, right panel) andthischangecanbeattributedentirelytoan increas-ingimportanceofimportedintermediategoodsasashare ofthoseproduceddomestically,(O·!M)matman.Asamatter offact,inparallelwiththisrisingtrendofimported inter-mediatematerials,in allbuttwo countries(Polandand Romania)theshareofdomesticinputsintotal manufactur-ingproduction,(M·!O)matman,hasactuallydecreased.This mayrevealeitherthat firmshave internalizedactivities previouslyoutsourcedtodomesticsuppliers,orthatthese
this article in press as: Castellani, D., et al., Can we really trust offshoring indices? Struct. Change Econ. Dyn.
ARTICLE IN PRESS
No. of Pages 14 D. Castellani et al. / Structural Change and Economic Dynamics xxx (2013) xxx– xxx Table3Shift-sharedecompositionofoffshoringindicesforEuropeancountries:serviceandmaterialintermediateinputs. Country(timeperiod) Manufacturing(15–37)
Serviceinputs(percentagepointschange) Materialinputs(percentagepointschange)
!Offser
man (O·!M)serman (M·!O)manser ((O·!M)serman)/!Offserman) !Offmatman (O·!M)matman (M·!O)manmat ((O·!M)matman)/!Offmatman)
WesternEurope Austria(1995–2005) 1.09 0.89 0.20 82% 3.94 9.85 −5.91 250% Belgium(1995–2005) 0.51 0.04 0.47 8% −0.15 5.65 −5.80 – Denmark(1995–2006) 2.34 2.27 0.07 97% 2.63 6.53 −3.90 249% Finland(1995–2006) 0.60 −0.22 0.82 −37% 5.30 11.03 −5.74 208% France(1995–2006) 0.36 0.17 0.19 48% 3.47 5.99 −2.52 173% Germany(1995–2005) 0.53 0.50 0.03 95% 4.96 6.39 −1.43 129% Greece(2000–2005) 0.08 −0.02 0.10 −27% −0.32 2.74 −3.06 867% Ireland(1997–2005) 18.33 28.14 −9.81 154% −9.36 −2.73 −6.63 −29% Italy(1995–2005) 0.49 0.23 0.27 46% 1.60 3.90 −2.30 244% Netherlands(1995–2006) 1.44 0.70 0.74 49% −2.05 1.39 −3.45 68% Norway(2001–2007) −0.33 −0.36 0.03 −109% 3.57 5.52 −1.96 155% Portugal(1995–2005) 0.07 0.05 0.02 74% 2.59 6.77 −4.18 262% Spain(1995–2005) 0.96 0.75 0.22 77% 3.87 6.40 −2.53 166% Sweden(1995–2005) 2.17 1.93 0.25 89% 1.46 5.33 −3.87 365% Median 0.563 0.363 0.192 61.47% 2.606 5.821 −3.658 208.29% Inter-quartilerange (0.960) (0.811) (0.222) (69.71%) (3.535) (2.237) (2.826) (95.13%) EastermEurope Estonia(1997–2005) 0.12 −0.26 0.38 −229% 7.82 24.94 −17.12 319% Hungary(1995–2005) 0.62 0.23 0.38 38% 8.00 19.82 −11.82 248% Lithuania(2000–2005) −0.95 −0.88 −0.06 −94% −3.87 −5.14 1.26 −133% Poland(2000–2005) −0.01 0.02 −0.03 175% 3.88 3.60 0.28 93% Romania(1995–2006) −0.01 −0.15 0.13 – 2.04 4.68 −2.65 230% Slovakia(2000–2005) −0.53 −0.40 −0.13 −76% 3.39 6.92 −3.53 204% Slovenia(1996–2005) 0.08 −0.07 0.15 −91% 11.39 29.92 −18.53 263% Median −0.011 −0.146 0.134 −83.36% 3.876 6.920 −3.525 229.94% Inter-quartilerange (0.369) (0.310) (0.310) (102.22%) (5.196) (18.239) (13.284) (106.86%) CorrelationwithGDP −0.067 −0.084 0.112 0.042 −0.175 −0.216 0.203 0.549
activitieshavebeensubstitutedbyforeignones.Thelatter interpretationisparticularlyconsistentwiththe observa-tionthatanincreasein(O·!M)matman isassociatedwitha decreasein(M·!O)matman.
To summarize, the share of intermediate business services,servicesandmaterialsintotalmanufacturing pro-ductionhasbeenontheriseinalargenumberofEuropean countries,butinthecaseofbusinessservices(andeven morefortheaggregateofallservices)thegrowthinimports istheresultofbothahigherintensityintheuseofsuch inputs bythemanufacturingindustry(due to outsourc-ing and structural change) and a higher propensity to importthem(relativetobuyingthemfromdomestic pro-ducers),whichisconsistentwithaprocessofoffshoring thosetasksabroad.Conversely,theevidencesuggeststhat the manufacturing industry is indeed increasingly buy-ingintermediate materialinputs fromforeignsuppliers, consistentwiththeidea thattheseactivities havebeen offshored.However,acloserlookatthedatacastssome generaldoubtsonthisinterpretationaswell.Infact,the medianvaluesofboth!Offmatmanandaresimilarin
West-ern and EasternEuropean countries. This suggests that the extent of material offshoring is similar in the two groups ofcountries. On thecontrary,onewould expect thatoffshoringhascharacterizedrelativelymoreadvanced economies. Instead, EasternEuropean countriesare not expectedtobeoffshoring, but,eventually,receiving off-shoredproduction.Thisisconfirmedbydataonindividual countries.Infact,thelargestincreaseintheratiobetween importedanddomesticallyproducedintermediate mate-rialshave beenregisteredin countries, suchasEstonia, HungaryandSlovenia,whichhavebeencharacterizedby amassiveflowofinwardforeigndirectinvestments(FDIs) overthelastdecade.Thisreflectsthefactthattheimport ofintermediatesoccursnotonlywhendomesticfirms off-shoreproductionabroad,butalsowhenforeignfirmslocate plants in a country and sourceintermediates from the headquartersorotherplantswithinthemultinational sup-plynetwork.
4.3. Serviceindustry
ResultsobtainedwhenweuseNACE50–74(services) as the using industries (j=ser), reported in Table 4 are qualitatively similar and reinforceour conclusions. Not surprisinglythevaluesofOffbs
ser,t0 andOff
ser
ser,t0 arelarger
(twiceasmuch)thanthesameindicesforthe manufactur-ingindustry,whileOffmat
ser,t0isnegligible,sincethematerial
inputsplay obviouslyaminorrolewhenproducing ser-vices.Similarly,!OffWserispositiveformostcountriesand itislargerfor(business)serviceinputs.However,inthe caseoftheserviceindustry,thecontributionofthe domes-ticcomponent(M·!O)Wserseemsevenmorerelevantthan inthecaseofmanufacturing.Asamatteroffact,themedian contributionoftheimported(business)servicesratiotothe overallchangeintheoffshoringmeasureisbelow50%in WesternEuropeancountries,suggestingthatinmorethan halfofthesecountries,theincreasein!Offbsserand!Offserser ismainlyduetotherisingshareofservicesexternalizedto domesticproducers.
5. Concludingremarks
Empiricalliteraturehasprovidedratherstrongevidence ofincreasingoffshoringactivities,bothforservice (includ-ing business service) and material inputs for different economiesinthelastdecades.Mostofthesecontributions haveusedindicesbasedonimportsofintermediatesfrom input-output tables. In this paper we investigate these indicesin greaterdetailand showthattheirvarianceis drivenbydifferentcomponents.Usingshift-share analy-siswedecomposethevariationoftheseindicesovertime intotwocomponents:(i)onecapturingthecontributionof achangeintheimportedinputsratioand(ii)one reflect-ingstructuralshiftsintheeconomy.Whiletheformermay actuallycaptureoffshoringofsometasks,thelatterresults fromachangeintheorganizationofproductionwithinthe nationalboundaries.
Inthisempiricalanalysisweusedatafor21European countriesoverthe1995–2006periodandshowthatthe shareofimportedinputsintotalproductionhasgrownin mostofthecountries.Inthecaseofbusinessserviceinputs, thisincreaseissignificantlyaffectedbytheraisingshare of(domesticallyproduced)servicesusedinmanufacturing production. This is particularly true for Eastern Euro-peancountries,wheretheimportedinputsratiohaseven decreased.AlsoinWesternEuropeancountries,however, thecontributionofstructuralshiftsindomestic produc-tionisquiterelevant:itsmedianvalueaccountsforabove 30%ofthetotalvariationofthebusinessoffshoringindex, reachingalmost40%inthecaseofaggregateservices.This findingprovidessupportingevidenceofanongoing ter-tiarizationprocess,which maywronglybeattributedto offshoringwhen trustingthecommonly appliedindices. Instead,inthecaseofmaterialoffshoringthereisevidence that theimported inputs ratio hasincreased,while the degreeofdomesticshiftsinproductionhasdecreased.This isconsistentwiththefactthatforeignsuppliershave sub-stituteddomesticones,whatcouldbeinterpretedatfirst sightthatoffshoringindicesmightbereliableinthiscase. However,thispatternismostpronouncedincountriessuch asEstonia,HungaryandSlovenia,whereincoming multi-nationals,ratherthantheoffshoringprocessofdomestic firmsmaybethedrivingforce.
Insum,ouranalysisraisesseriousconcernsaboutthe useofdataonimportsofintermediateinputstomeasure offshoringofbusinessservices,servicesormaterials.We submitthatitiscrucialtodistinguishtowhatextenthigher importsarerelatedtoamoreintensiveuseofsuchinputs intomanufacturingproduction,whichwouldresultfrom aprocessof(domestic)outsourcing,orwhetherthey actu-allyderivefromahigherpropensitytoimportrathersource thoseinputs domesticallyand thusreflecting offshoring ofsuchtasks.Forfutureeconometricanalysesthiswould suggestthatoneshouldadditionallycontrolfora struc-tural changeor domestic outsourcingcomponent when usingthediscussedindicestoestimatetheeffectsof off-shoring.Furthermore,itis necessarytobeaware ofthe factthatimporting intermediatesmaynot berelated to aprocessofoffshoringperse.Rather,ourevidence sug-geststhatinsomecountries,anincreaseinthepropensity toimportintermediatematerialgoodsmaybeduetothe
this article in press as: Castellani, D., et al., Can we really trust offshoring indices? Struct. Change Econ. Dyn.
ARTICLE IN PRESS
No. of Pages 14 D. Castellani et al. / Structural Change and Economic Dynamics xxx (2013) xxx– xxx Table4OffshoringindicesforEuropeancountries:serviceindustries. Country(timeperiod) Services(50–74)
Businessserviceinputs(percentagepointschange) Serviceinputs(percentagepointschange) Materialinputs(percentagepointschange) Offbs
ser !Offbsser ((O · !M)bsser)/(!Offserbs) Offserser !Offserser ((O · !M)serser)/(!Offserser) Offmatser !Offmatser ((O ·!M)matser)/(!Offmatser)
WesternEurope Austria(1995–2005) 1.17% 0.42 −77% 3.61% 1.06 −53% 2.36% 0.58 176% Belgium(1995–2005) 1.68% 1.12 69% 5.50% 2.26 72% 2.67% 0.76 239% Denmark(1995–2006) 0.09% 1.50 87% 4.12% 7.72 89% 2.51% 2.52 149% Finland(1995–2006) 0.73% 1.30 13% 2.36% 1.57 48% 2.25% 1.32 169% France(1995–2006) 0.63% 0.25 43% 1.68% 0.09 −210% 1.71% 0.40 190% Germany(1995–2005) 0.38% 0.54 87% 1.78% 1.77 69% 1.01% 0.33 196% Greece(2000–2005) 0.30% −0.02 −169% 3.47% 0.20 −3% 3.17% 0.15 568% Ireland(1997–2005) 5.28% 1.87 −611% 9.43% 6.68 43% 4.87% −1.32 −206% Italy(1995–2005) 0.42% 0.30 54% 1.66% 0.27 −31% 1.65% −0.14 7% Netherlands(1995–2006) 1.97% 0.32 −125% 4.74% 2.79 43% 3.42% −0.75 −45% Norway(2001–2007) 1.39% 0.30 118% 6.86% −0.72 −156% 4.23% 1.30 26% Portugal(1995–2005) 0.99% −0.17 −290% 2.71% −0.76 −188% 2.63% 0.53 315% Spain(1995–2005) 0.51% 0.71 65% 1.36% 1.31 44% 1.26% 0.29 125% Sweden(1995–2005) 1.15% 1.16 76% 3.13% 1.64 79% 3.83% 0.30 427% Median 0.86% 0.48 48.73% 3.30% 1.44 42.96% 2.57% 0.36 172.76% Inter-quartilerange (0.89%) (0.85) (187.77%) (2.66%) (1.92) (111.87%) (1.51%) (0.53) (178.09%) EasternEurope Estonia(1997–2005) 2.63% −0.51 −159% 6.96% 0.00 – 9.42% −2.66 214% Hungary(1995–2005) 2.64% −0.76 −118% 3.81% −0.07 −539% 3.04% 1.90 86% Lithuania(2000–2005) 0.69% −0.17 −230% 2.89% −1.38 −110% 3.98% 0.19 535% Poland(2000–2005) 0.34% 0.27 85% 2.23% −0.48 −129% 2.49% 0.63 124% Romania(2000–2006) 0.58% 0.36 −234% 1.17% 0.50 4% 6.67% 0.08 – Slovakia(2000–2005) 2.40% −0.73 −88% 4.05% 0.60 253% 3.01% −0.64 −238% Slovenia(1996–2005) 1.15% 0.80 112% 2.13% 1.40 64% 3.64% 1.33 695% Median 1.15% −0.17 −117.56% 2.89% 0.00 −53.03% 3.64% 0.19 169.12% Inter-quartilerange (1.88%) (0.94) (193.03%) (1.75%) (0.82) (173.01%) (2.30%) (1.27) (359.08%) CorrelationwithGDP −0.322 0.071 0.358 −38.28% −0.014 0.023 −0.518 −0.018 −0.114
entryandexpansionofforeignmultinationalsinthe coun-try,whichimportintermediategoodsfromtheiraffiliates orsuppliersworldwide.Thisisrelevantifweusethe off-shoring indices toassess theeffects onproductivity or employment.Forexample,whiledomesticfirmsshutting downproductionactivitiesathomeandoffshoringthem abroad(substitutingitwithimportedintermediates)may havenegativeemploymenteffects,foreignfirms increas-ingproductioninthecountry(andthusimportingmore intermediates)mayhavepositiveemploymenteffects.In otherwords,thesameoffshoringindexmaycapture dif-ferent phenomenaunderdifferentcircumstances,which makesaninterpretationoftheeffectsquestionable.Asthe titleofourcontributionsuggest,thetake-homemessage ofouranalysisisthatweshouldnotreallytrustoffshoring indicesbasedoninput–outputdata.
Thesadsideofthestoryisthateveniftheseindices provideadistortedimageofoffshoring,westillhavetolive withthem.Themostnaturalalternative,whichismoving fromindirectevidenceofoffshoringtoadirectoneisstill farfrombeingsystematicallyavailabletoresearchers. Fea-siblealternativesrelyingonfirm-leveldataarescarceand mustbehandledwithcare.AsshowninWagner(2011), alsotheresearchpotentialofhithertoexistingfirm-level dataislimited:inordertoachieve informationbothon offshoringactivitiesandonthecharacteristicsoffirmsand theirperformance,itisstillnecessarytocombinedifferent datasources,someofthemexpresslymadeforthe pur-poseoftheresearch.11Moregenerally,thefundamental
questionintheuseofsurveydata,exacerbatedbythe com-monpracticeofmergingdifferentdatasetscomingfrom differentsurveyswithdifferentsurveydesigns,isthatoften thepopulationofreferenceis,orbecomes,unclearandthe representativenessoftheresultsdoubtful.Moreover,since firm-leveldataareoftenavailableatthenationallevel,the questionoftheexternalvalidityoftheresultsatthe inter-national level mustbe alwaystakeninto consideration. Othersourcesoffirm-levelinformationonoffshoring,such as thefact-sheet data fromthe EuropeanRestructuring Monitor12mayyieldsupplementalinsightsbut,asclearly
mentionedontheERMwebsite,thesedata,whicharebased oncompany announcements,are indicative rather than comprehensive.
Thehappysideofthestoryisthat,inspiteofthe ques-tionableinterpretationofoffshoringindices,input–output datastillrepresentafundamentalsourceofinformationon theextentofnationalandinternationallinkagesin produc-tionofmanufacturingandservicegoods.Wemightnotcall itoffshoring(always),butitstillshowssomethingthat can-notbeignored.Payingattentiontothedistinctionbetween internationaloffshoringandstructuralchangeindomestic activitiesmaystillprovideinterestinginsights.Moreover, thepossibilitiesofferedby multivariateanalysisto con-trolforpossibleconfoundersassociatedtooffshoring(e.g.
11Specifically,Wagner(2011)drawsonthe“relocationofeconomic activities”special-purposesurveyfromtheGermanFederalStatistical Office.
12ConsulttheEurofoundwebpagehttp://www.eurofound.europa.eu/
emcc/erm/index.htmforfurtherinformation.
therelevanceofMNEsactivities)canhelpinterpretingthe effectassociatedtoinput–outputoffshoringindices. References
Amiti,M.,Wei,S.-J.,2005a.Fearofserviceoutsourcing:isitjustified? EconomicPolicy20,308–347.
Amiti,M.,Wei,S.-J.,2005b.Serviceoffshoring,productivity,and employ-ment:evidencefromtheUnitedStates.IMFWorkingPaperWP05 238.
Arndt,S.W.,1997.Globalizationandtheopeneconomy.NorthAmerican JournalofEconomicsandFinance8(1),71–79.
Arndt,S.W.,1998a.Globalizationandthegainsfromtrade.In:Koch, K.-J.,Jaeger,K.(Eds.),Trade,Growth,andEconomicPolicyinOpen Economies:EssaysinHonorofHans-JürgenVosgerau.Springer,Berlin, Heidelberg,pp.3–12.
Arndt,S.W.,1998b.Super-specializationandthegainsfromtrade. Con-temporaryEconomicPolicy16(4),480–485.
Campa,J.,Goldberg,L.S.1997.Theevolvingexternalorientationof man-ufaturingindustries:evidencefromfourcountries.NBERWorking Paper5919.
Chen,H.,Kondratowicz,M.,Yi,K.-M.,2005.Verticalspecializationand threefactsaboutU.S.internationaltrade.NorthAmericanJournalof EconomicsandFinance16,33–59.
Chenery,H.,Robinson,S.,Syrquin,M.,1986.IndustrializationandGrowth, AComparativeStudy.OxfordUniversityPress.,Oxford.
Crinò,R.,2009.Offshoring,multinationalsandlabormarket:areviewof theempiricalliterature.JournalofEconomicSurveys23(2),197–249. Crinò,R.,2012.ServiceOffshoringandLaborDemandinEurope, Vol-umeOxfordHandbookofGlobalEmploymentandOffshoring.Oxford UniversityPress,Oxford.
Daveri,F.,Jona-Lasinio,C.,2008.Off-shoringandproductivitygrowthin theitalianmanufacturingindustries.CESifoEconomicStudies54(3), 414–450.
Egger,H.,Egger,P.,2002.HowinternationaloutsourcingdrivesupEastern Europeanwages.WeltwirtschaftlichesArchiv138,83–96.
Falzoni,A.M.,Tajoli,L.,2010.Theeffectsofoffshoringonthecomposition ofemploymentinitaly.In:Stern,R.M.(Ed.),QuantitativeAnalysis ofNewlyEvolvingPatternsofInternationalTrade:Fragmentation; OffshoringofActivities;andVerticalIntra-IndustryTrade.World Sci-entific,StudiesinInternationalEconomics,Singapore.
Feenstra,R.,Jensen,B.J.,2012.Evaluatingestimatesofmaterialsoffshoring fromU.S.manufacturing.NBERworkingpaper17916.
Feenstra,R.C.,1998.Integrationoftradeanddisintegrationofproduction intheglobaleconomy.JournalofEconomicPerspectives12(4),31–50. Feenstra,R.C.,Hanson,G.H.,1996a.Foreigninvestmentoutsourcingand relativewages.In:Feenstra,R.C.,Grossman,G.M.,Irwin,D.A.(Eds.), ThePoliticalEconomyofTradePolicy,EssaysinHonorofJagdisch Bhagwati,MITPress;Cambridge,Massachusetts,pp.89–127. Feenstra,R.C.,Hanson,G.H.,1996b.Globalization,outsourcing,andwage
inequality.AmericanEconomicReview86,240–245.
Feenstra, R.C., Hanson, G.H., 1999. The impact of outsourcing and high-technologycapitalonwageestimatesfortheUnitedStates, 1979–1990.QuarterlyJournalofEconomics114,907–940. Feenstra,R.C.,Lipsey,R.E.,Branstetter,L.G.,Foley,C.F.,Harrigan,J.,Jensen,
J.B.,Kletzer,L.,Mann,C.,Schott,P.K.,Wright,G.C.,2010.Reportonthe stateofavailabledataforthestudyofinternationaltradeandforeign directinvestment.NBERworkingpaper16254.
FinancialTimesGermany(Ed.)(2004a).ausreisserderwoche:Banken zweifelnanBasar-Ökonomie.16.07.2004,p.16.
Financial Times Germany. (Ed.),2004b. DeutscherWeltmeister Titel kommtmanchenungelegen(06.07.04),p.18.
FinancialTimesGermany.(Ed.),2004c.SchöneneueIndustrie(20.02.04), p.26.
Foresti, G., Guelpa, F., Trenti, S., 2007, July. La terziarizzazione dell’economiaeuropea:èveradeindustrializzazione.Technicalreport, CollanaRicerche,ServizioStudi,Intesa-SanPaolo.
Francois,J.F.,1990a.Producerservices,scale,andthedivisionoflabor. OxfordEconomicPapers42,715–729.
Francois, J.F.,1990b. Tradein producerservicesand returnsdueto specializationundermonopolisticcompetition.CanadianJournalof Economics23,109–124.
Geishecker,I.,Görg,H.,2005.Dounskilledworkersalwayslosefrom fragmentation.NorthAmericanJournalofEconomicsandFinance16, 81–92.
Geishecker,I.,Görg,H.,2008.Winnersandlosers:amicro-levelanalysisof internationaloutsourcingandwages.CanadianJournalofEconomics 41(1),243–270.
Greenfield,H.I.,1996.ManpowerandtheGrowthofProducerServices. ColumbiaUniversityPress,London.
Greenhalgh,C.,Gregory,M.,2001.Structuralchangeandtheemergenceof thenewserviceeconomy.OxfordBulletinofEconomicsandStatistics 63,629–646.
Grossman,G.M.,Rossi-Hansberg,E.,2008.Tradingtasks:asimpletheory ofoffshoring.AmericanEconomicReview98(5),1978–1997. Guerrieri,P.,Meliciani,V.,2005.Technologyandinternational
competi-tiveness:theinterdependencebetweenmanufacturingandproducer services”.StructuralChangeandEconomicDynamics16,489–502. Hijzen,A.,2007.Internationaloutsourcing,technologicalchange,and
wageinequality.ReviewofInternationalEconomics15(1),188–205. Hijzen,A.,Görg,H.,Hine,R.C.,2004.Internationaloutsourcingandtheskill structureoflabourdemandintheUnitedKingdom.IZAdiscussion paper1249.
Horgos,D.,2009a. Labormarketeffectsofinternationaloutsourcing: Howmeasurementmatters.InternationalReviewofEconomicsand Finance(18),611–623.
Horgos, D., 2009b. The sector bias of international outsourcing – implicationsforindustrialeconomies.Dissertation,HelmutSchmidt University,Hamburg.
Horgos,D.,2011.Internationaloutsourcingandthesectorbias:new empirical evidence. Review of International Economics 19 (2), 232–244.
Hummels,D.,Ishii,J.,Yi,K.-M.,2001.Thenatureandgrowthofvertical specializationinworldtrade.JournalofInternationalEconomics54, 75–96.
Jona-Lasinio,C.,2010.Serviceoff-shoringandproductivitygrowthinthe EUeconomies,mimeo.
Jones,R.W.,Kierzkowski,H.,1990.Theroleofservicesinproductionand internationaltrade:atheoreticalframework.In:Jones,R.W.,Krueger, A.O.(Eds.),ThePoliticalEconomyofInternationalTrade,Essaysin HonorofRobertE.Baldwin,Blackwell,Cambridge,MA,pp.31–48. Liu,R.,Feils,D.J.,Scholnick,B.,2011.Whyaredifferentservicesoutsourced
todifferentcountries?JournalofInternationalBusinessStudies42(4), 558–571.
MacPherson,A.,Vanchan,V.,2010.Theoutsourcingofindustrialdesign servicesbylargeUSmanufacturingcompanies.InternationalRegional ScienceJournal33(1),3–30.
McMillan,M.,Rodrik,D.,2011.Globalization,structuralchangeand pro-ductivitygrowth.NBERworkingpaper17143.
Memedovic,O.,Iapadre,L.,2009.Structuralchangeintheworld econ-omy:mainfeaturesandtrends.UNIDOresearchandstatisticsworking paper24.
Momigliano,F.,Siniscalco,D.,1982.Thegrowthofserviceemployment: areappraisal.BNLQuarterlyReview142,269–306.
Montresor, S., Vittucci Marzetti, G., 2011. The deindustriali-sation/tertiarisation hypothesis reconsidered: a subsystem applicationtotheoecd7.CambridgeJournalofEconomics35(2), 401–421.
MorganStanley(Ed.)(2004a).Germany:Offshoring:MoreaMyththana Matter?MorganStanleyGlobalEconomicForum(04.08.04). MorganStanley(Ed.)(2004b).Germany:TurningintoaBazaar?Morgan
StanleyGlobalEconomicForum(15.07.04).
OECD(2006).OffshoringandEmployment:TrendsandImpact. Olsen,K.B.(2006).Productivityimpactsofoffshoringandoutsourcing:
areview.OECDscience,technologyandindustryworkingpapers 2006/01.
Pilat,D.andA.Wölfl(2005).Measuringtheinteractionbetween manu-facturingandservices.OECDSTIworkingpaper2005/5.
Prahalad,C.K.,Hamel,G.,1990.Thecorecompetenceofthecorporation. HarvardBusinessReview68(3),79–93.
Schwörer,T.,2012.Offshoring,domesticoutsourcing,andproductivity: evidenceforanumberofeuropeancountries.Kielworkingpapers 1786,KielInstitutefortheWorldEconomy.
Sinn,H.-W.,2005.BasarÖkonomieDeutschland:Exportweltmeisteroder Schlusslicht.ifoSonderausgabe,Schnelldienst.
Strauss-Kahn,V.,2003.Theroleofglobalizationinthewithin-industry shiftawayfromunskilledworkersinFrance.NBERworkingpapers 9716.
Vandermerwe, S., Rada, J., 1988. Servitization of business: Adding value by adding services. European Management Journal 6 (4), 314–324.
Wagner, J., 2011. Offshoring and firm performance: self-selection, effectsonperformance,orboth?ReviewofWorldEconomics147, 217–247.
Winkler,D.,2010.Servicesoffshoringanditsimpactonproductivityand employment:EvidencefromGermany,1995–2006.WorldEconomy 33(12),1672–1701.
Yeats,A.J.,2001.Justhowbigisglobalproductionsharing?In:Arndt,S.W., Kierzkowski,H.(Eds.),Fragmentation,NewProductionPatternsinthe WorldEconomy.OxfordUniversityPress,Oxford,pp.108–143.