Analysis of embodied energy and product lifespan: the potential embodied power sustainability indicator
Julian Fernando Ordoñez Duran1, Josep M. Chimenos2, Mercè Segarra2, Paola Andrea de Antonio Boada1, Joao Carlos Espindola Ferreira1,*
1Universidade Federal de Santa Catarina, Florianópolis, Brazil, 2Department of Materials Science and Physical Chemistry, Universitat de Barcelona, Marti i Franquès, 1, 08028 Barcelona, Spain.
*corresponding author: [email protected]
Abstract
In the context of life cycle assessment sustainability indicators, this article proposes a new indicator that is related to the embodied energy, in order to assess the lifespan of products based on their components. The indicator, called “potential embodied power” (PEP), considers that a non-replaceable component with a shorter lifespan will determine the lifetime of the product. The PEP indicator can be considered as an inherent property of the product, and it can be optimized by using a material selection method based on the concept of annualized embodied energy. This indicator can be used for product design decision making, since it determines the impact of product disposal in relation to the lifespan for which the product was designed. Also, a methodology is proposed to contribute to evaluating the environmental impact caused by the energy discarded resulting from the design decisions. A case study was performed on smartphones, and the results show that the variation of factors such as module lifespan or embodied energy allows achieving a lower value of the embodied power.
Keywords: embodied energy; Life cycle assessment; product lifespan; potential embodied power; sustainable manufacturing; smartphones.
Introduction
Life cycle assessment (LCA) is a tool that seeks to evaluate environmental burdens associated with a product, process or service (Cherubini et al. 2009). It helps identify energy and materials used and emissions released to the environment and allows finding opportunities for environmental improvements (Kasulaitis et al. 2015).
Methodologies like LCA provide screening scenarios, but the awareness of completeness in scope comes at the price of simplifications and uncertainties (Mendoza Beltran et al. 2018). Herva et al. (2011) pointed out that sustainable development as a concept is vague and ambiguous to provide useful guidelines, which leads to the need to create indicators that express metrics applicable at the action level. This leads the researcher or designer to make different decisions depending on geographic, economic and environmental contexts (Reap et al. 2008).
An interesting way to assess the environmental impact of processes was proposed by Da Silva et al. (2019), who analyzed the economic value and environmental impact of promising pretreatment technologies for producing ethanol in order to identify possible bottlenecks and indicate means for
more economical and cleaner production. They considered two indicators: ethanol yield and the total environmental impacts of a certain cogeneration area. They achieved good results, but the problem they considered related to continuous processes, instead of the types of products studied in this work.
Suckling and Lee (2015) carried out a literature survey on the environmental impact of mobile phones and the consequences of moving from the model of selling, using and discarding phones to a product service system (PSS) based upon a cloud service. They inferred from the literature that customers are far more integrated with the internet, and a PSS based upon a cloud service requires the need for improved energy efficiency to reduce significantly the emission of greenhouse gases (GHG) during product use and provides a mechanism to exploit their residual value by timely return of the phones, their components and recovery of materials.
Product design decisions such as material selection may cause environmental impact (Sofia et al., 2019), and, therefore, it is important to permanently ponder about design improvement in the context of the environment (Vyhmeister et al. 2018). Parameter-based tools have been used to evaluate the environmental performance of companies (De Benedetto and Klemeš 2009), allowing the visualization of different scenarios. The possibilities of specifying the scope based on the needs of the stakeholder in methodologies such as life cycle assessment could be very useful, despite being subjective according to the interpretation of the analyst (Heijungs et al. 2010).
The production of goods that require low energy consumption for their manufacture may be considered as environmentally friendly, but such behavior may not be effectively sustainable. Also, the manufacture of a product with a short lifespan and low energy consumption may not be sustainable as well (Bakker et al. 2014).
The concept of determining the energy consumed in the manufacture of products and distributing such energy along the product lifespan (Smil 2016) may enable evaluating the efficiency of material use. Parameters such as the annualized embodied energy (Hernandez and Kenny 2010) allow proposing equations of energy interaction in the context of LCA.
In this context, considering the methodology for formulating the environmental impacts used by life cycle assessment (Azapagic and Perdan 2000), this work seeks to analyze the relationship between the lifespan of products and their embodied energy during their first life cycle, aiming to propose an intrinsic property of the product that can be used as an environmental indicator.
It is expected that this property, which is called the potential embodied power (PEP) of the product, can be used in decision making both in the scientific and industrial scopes in order to improve and provide improvements to the product in the design phase. In the context of this indicator, it is possible to choose between projecting a short lifespan desired by the manufacturer and a selection of materials with less embodied energy or, conversely, a longer lifespan linked with the use of materials with greater embodied energy.
Previous related works
Some previous works developed in order to estimate the energy in products based on their materials are presented in Table 1, with their respective contributions.
presented in the following subsections.
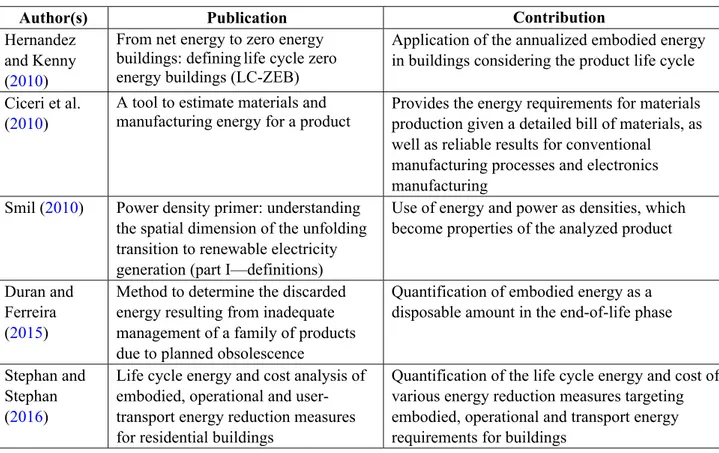
Table 1. Some previous related works and their contributions.
Author(s) Publication Contribution
Hernandez and Kenny (2010)
From net energy to zero energy buildings: defining life cycle zero energy buildings (LC-ZEB)
Application of the annualized embodied energy in buildings considering the product life cycle Ciceri et al.
(2010)
A tool to estimate materials and
manufacturing energy for a product Provides the energy requirements for materials production given a detailed bill of materials, as well as reliable results for conventional
manufacturing processes and electronics manufacturing
Smil (2010) Power density primer: understanding the spatial dimension of the unfolding transition to renewable electricity generation (part I—definitions)
Use of energy and power as densities, which become properties of the analyzed product
Duran and Ferreira (2015)
Method to determine the discarded energy resulting from inadequate management of a family of products due to planned obsolescence
Quantification of embodied energy as a disposable amount in the end-of-life phase
Stephan and Stephan (2016)
Life cycle energy and cost analysis of embodied, operational and user-transport energy reduction measures for residential buildings
Quantification of the life cycle energy and cost of various energy reduction measures targeting embodied, operational and transport energy requirements for buildings
Life cycle assessment (LCA)
Life cycle assessment (LCA) is a tool for systematic evaluation of the environmental aspects of a product through all stages of its life cycle (ISO 2006a, 2006b). It studies the goals and scope of interactions from material extraction to disposal through the material, energy, and information flows in the system (Heidrich and Tiwary, 2013).
LCA considers the environmental aspects and impact of services, products, or processes (Jeswani et al. 2010), and some of the possible impacts include climate change, ozone depletion and ecotoxicity (Nouri et al. 2012). The impacts are quantified according to their influence in different areas: economic, institutional, social and the one considered in the present work, the environmental area (Spangenberg, 2002). The influence of parameters can be verified using indicators such as those proposed, for example, by Pastare et al. (2014).
LCA enables determining the amount of energy needed in different stages of the product life cycle, and these stages are the following:
a) Material production: Embodied energy is the energy per unit mass consumed to make a material from its ores and feedstock, in MJ/kg (Ciceri et al. 2010). This concept covers raw materials, primary transportation and, if necessary, the process to prepare the materials to be used.
b) Product manufacture: Manufacturing energy refers to the energy consumed by product manufacturing processes (Seow and Rahimifard 2011). This includes processes such as machining, forging and welding (Ingarao 2017).
c) Product use: Use energy encompasses the consumed energy during installation, utilization and maintenance (Chatzisideris et al. 2016).
d) Product disposal: At the end of its useful life, the product is discarded, and it may undergo recycling, refurbishment, reuse or incineration. The energy associated with these activities (including transportation) should be taken into account, but a fraction of the materials in the product that enter a loop (e.g., recycling) contributes to reducing the energy (Ashby 2009).
This work seeks to identify the consumption parameters in order to propose the best practices, better designs, better use of the products, reducing its negative impact on the environment. Depending on the product, the energy distribution in LCA varies along the stages (i.e., material production, product manufacture, product use and product disposal) and can be analyzed separately when necessary. Valuable information can be obtained from sustainability reports (e.g., European Energy Commission 2017).
As pointed out above, the energy related to the use phase of the product can be determined, which includes charging batteries (Zink et al. 2014) and the energy consumption during its use (Ercan et al. 2016). The comparison of two products with equal consumption during use requires the determination of some parameters to identify which product has the better performance, seeking to use more appropriate materials (Evers and Nazar 2012), and improve product architecture (Wang et al. 2009) and other properties, as explained below.
Energy density
According to Zu and Li (2011), energy density is the amount of energy per unit weight (referred to as gravimetric energy density - J/kg) or per unit volume (called volumetric energy density - J/m3). Similarly, power density is defined as a gravimetric or volumetric density that can be assigned to energy converters. For example, in the case of batteries, power density refers to the rate of energy delivered per unit of battery weight (gravimetric energy power - W/kg) or volume (volumetric energy power - W/m3).
In this context, the energy and power values to be delivered by the products can be determined as a function of their mass or volume, considering the relation between energy and the analyzed variable as a distribution or density. It should be pointed out that there is another area of knowledge that has used this principle to analyze the embodied energy throughout the product life cycle as a distribution, which corresponds to the design of buildings (Hernandez and Kenny 2010).
Annualized embodied energy (AEE)
Selection of materials is often performed via intuition, based on experience and inspiration of designers (Mitchell and Walinga 2017). It begins by studying the properties and the costs of candidate materials using databases (Morales et al. 2014). Material charts can be developed to present material property data (Shah 2014), which are used to compare different characteristics such as cost, strength, toughness and elasticity, seeking to help the designer in choosing the materials that satisfy the requirements of different stakeholders (Jahan et al. 2010). Such material choice decisions certainly affect product use (Jahan et al. 2016).
The embodied energy during the use phase is considered by building construction research (e.g., Ramesh et al. 2010), but it can be applied to any product. An important element in this context is the annualized embodied energy (AEE), which considers the relationship between the projected lifespan of a product (e.g., a building), one of its parameters (e.g., its area or volume), and the energy required for its maintenance throughout its life expectancy (Hernandez and Kenny 2010).
The AEE value corresponds to the embodied energy for constructing a square meter of the analyzed structure taking its life cycle assessment into account, depending on its projected lifespan. This suggests that the lower the rate of the parameter, the more sustainable the construction.
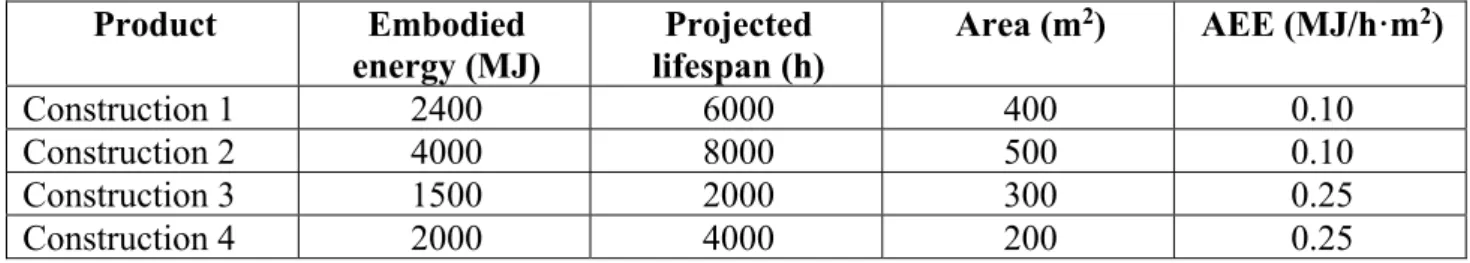
Using the methodology described by Padgett et al. (2008), Table 2 presents four examples of construction structures with the following parameters: embodied energy, projected lifespan and occupied area. It is observed that AEE values of products 1 and 2, as well as products 3 and 4, are equal, although they have different values of EE, projected lifespan and area during design decision making. Therefore, it is inferred that, from the point of view of AEE, constructions 1 and 2 are equally sustainable, similarly to constructions 3 and 4. This premise can be extended to other products besides civil construction.
Table 2 Examples of AEE calculation for construction structures. Product Embodied
energy (MJ) lifespan (h) Projected Area (m
2) AEE (MJ/hꞏm2)
Construction 1 2400 6000 400 0.10
Construction 2 4000 8000 500 0.10
Construction 3 1500 2000 300 0.25
Construction 4 2000 4000 200 0.25
When considering zero energy building analysis, the unit of AEE is megajoule (MJ) per square meter per year. However, when the analysis requires a mass-based approach, the unit is megajoule per kg per year. It can be noticed that AEE encompasses three parameters: the energy invested per square meter during the product lifespan.
According to Hernandez and Kenny (2010), AEE is determined in order to compare the energy investment during the construction phase of a building with the energy required for its heating and maintenance during the projected lifespan. A larger initial investment can achieve better results regarding energy savings at the end of the building’s life (Sartori et al. 2012).
Modularity of products
According to Cooper et al. (2014), modular design separates a product into distinct components/sub-assemblies with standardized interfaces. Ulrich and Tung (1991) point out that the presence of modularity in products leads to simplified assembly and disassembly, improved service- ability and easier maintenance.
As Bonvoisin et al. (2016) point out, product architecture is the way the product components and their functions are randomly or modularly distributed, and this significantly influences the performance of the product over its useful life. According to Nepal et al. (2007), modular architecture significantly enhances product development.
Usually, a module is composed of different types of materials and components (Collado-Ruiz and Capuz Rizo 2010), which have different lifespans and sources of failure (Mascle 2017). It is desirable that design allows product disassembly into modules that encompass the functions that satisfy customer requirements (Hanafy and ElMaraghy 2017).
Figure 1. Load L applied to a product with modules with different reliabilities. Adapted from O’Connor and Kleyner (2012).
Reliability of devices
Reliability is defined as the probability of a component, product or system to perform a required function without failure under controlled and defined conditions, for a stated period of time (Kapur and Pecht 2014).
During the use of an electronic device, its components are strained by factors such as temperature and vibration, causing them to undergo breakage, interrupting its projected function (Nasser and Curtin 2006). Power devices encompass many different materials characterized by different physical parameters such as thermal expansion coefficients. For instance, thermal cycling creates repetitive stresses, which can cause fatigue and eventually failure (Musallam et al. 2008).
Failure occurs when the forces affecting the product overcome the strength limits defined by the material and structure. For example, the lifespan of a battery is determined based on the number of complete cycles (approximately 500 cycles by current technology) and for an average user. This results in a 2-3-year lifespan (Dimitrijevic 2011).
Many modules compose a product, and each module has its own reliability. The interaction between the modules’ reliabilities dictates the lifespan of the product, which is determined by the module with the shorter lifespan (or lower strength limit). For instance, Figure 1 shows an applied load (L) and the strength limit specifications projected for two different modules in a product (SM1 and SM2), and they are distributed statistically (O’Connor and Kleyner 2012). In this figure, module 1 has a lower strength limit than module 2 and, therefore, the first failure of the product will occur when module 1 fails, which is highlighted by the overlapped distributions of the applied load and the strength limit of module 1.
In this context, if the design decision indicates that modules SM1 and SM2 are assembled in a way that prevents their separation without being damaged, when module SM1 enters the failure state, module SM2 must also be discarded, which takes place before the end of its lifespan, as a consequence of a choice made by the designer (Duran and Ferreira 2015).
Opportunity cost
Opportunity cost corresponds to the opportunity that is lost when the choice of a course of action requires that an alternative course of action be given up (Spiller 2011). Knauf (2015) points out that the opportunity cost is related to the loss of potential gain. Lu and Liu (2015) point out that an example of opportunity cost would be the cost of averted GHG emissions.
Any product design requirement entails a certain number of consequences associated with the materials, processes and use. When chosen, materials have properties with different values, such as cost, density and embodied energy.
To make a profitable investment, the benefits must be at least as high as the opportunity cost. The use of this concept in this work is related to considering the energy required during mining, transportation and processes to produce a product as an investment, and the lower the evaluation of this environmental impact as profit.
Proposed methodology
The proposed methodology integrates tools in order to evaluate the environmental impact caused by the energy discarded resulting from the design decisions that involve, for example, the choice of geometry and materials (Amaral and Rozenfeld 2007). Figure 2shows the flowchart with the steps developed in the proposed methodology.
In this work, the embodied energy is used to determine the energy flows required during a product life cycle. The methodology is guided by ISO 14040 (2006a) and ISO 14044 (2006b) standards, following four stages: goal and scope definition, inventory analysis, impact assessment and interpretation (Vinodh et al. 2016).
The data used in the construction of the methodology were obtained from the following sources: (a) The embodied energy in each component was calculated using computational tools for life cycle assessment, material property charts (Ashby 2009) and databases (Ashby and Johnson 2013); (b) previous academic works for determining the discarded energy, such as, for example, Ciceri et al. (2010).
Lifespan data are obtained from studies of specialized laboratories for this purpose, as well as from reports provided by manufacturing companies and submitted to global environmental commissions (for example, LG 2015).
Chosen product and its bill of materials
The product to which the proposed methodology will be applied requires easy access and manipulation. Smartphones were the products chosen, and there are several models and modular compositions, in addition to having relatively easy disassembly, enabling identifying components and modules. Many models of smartphones manufactured between 2013 and 2018 were analyzed in search of one that provided information on the bill of materials, disassembly and component lifespans.
Once the product used in the case study was defined, the method used by Carlon (2016) allowed access to the bill of materials of the product and the identification of its modules. Figure 3 shows the four basic modules of a smartphone, which are: (1) printed wiring board; (2) screen; (3) plastic body; and (4) battery.
Semiconductors are located in module 1, whereas the materials used to manufacture the screen are in module 2. The modular separation of the chosen product facilitates identifying the four independent main modules, allowing quantifying the energy embodied in each, and this is done without damaging the integrity of each module.
Energy calculation
Applying the steps in life cycle assessment (LCA), and considering the embodied energy as the functional unit for impact quantification, the energy consumption required for the life cycle of the analyzed smartphone was determined. The analysis performed is described below.
Once the designer defines the module specifications, and the bill of materials is obtained, every component is listed and the nature of these materials is classified (Tao et al. 2014). From the bill of materials, the parts and their respective weights were obtained, and they were used to calculate their embodied energy. Since many major housing parts are marked with ISO 11469 codes (ISO 2016), it is often possible to disassemble and inspect samples to identify their compositions (McLaren et al. 1999). As shown in Figure 4, the detailed part of module 3 (cover) marked with letters PC (polycarbonate), ABS (acrylonitrile butadiene styrene) and rubber can also be found.
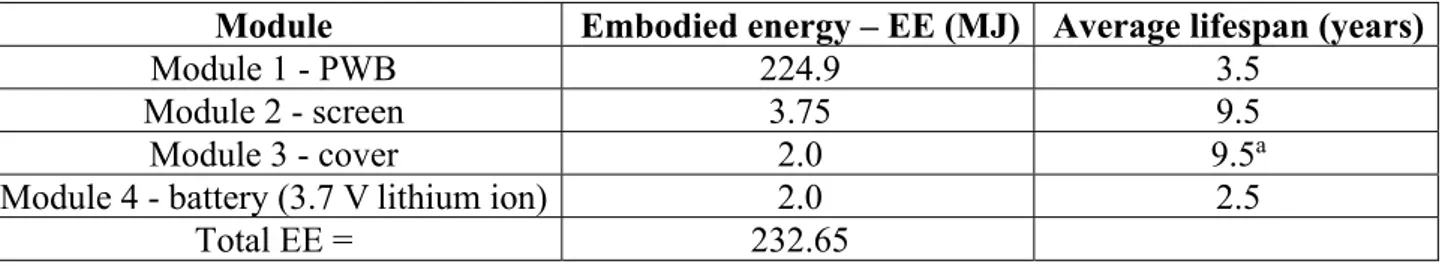
Using the tool called SEDOP (Duran and Ferreira 2015), the embodied energies in the product modules were determined, and they are shown in Table 2. The total amount of energy in module 1 (PWB) is equal to 224.9 MJ (equal to 96% of the embodied energy in the product), corresponding to the materials and transformation for the module to become ready to manufacture.
The average lifespan values per module in smartphones were analyzed according to some sources (for example, Ercan et al. 2016; Andrae and Vaija 2014). For module 1, the average user activity per day results in a lifespan of 3.5 years (equal to 1277.5 days). The average lifespan of modules 2 and 3 is also shown in Table 3.
The status of function delivery in the expected conditions for each module varies according to the specifications defined by the designer, which influence directly its lifespan. Here is the importance of decision making during the design phase, as this will influence directly the amount of energy discarded (Pereira et al. 2018).
Figure 3. Modules in a smartphone.
Figure 4. ISO 11469 polymeric codification (ISO 2016).
Table 3. Embodied energy and lifespan of each module of the studied smartphone.
Module Embodied energy – EE (MJ) Average lifespan (years)
Module 1 - PWB 224.9 3.5
Module 2 - screen 3.75 9.5
Module 3 - cover 2.0 9.5a
Module 4 - battery (3.7 Vlithium ion) 2.0 2.5
Total EE = 232.65
In the scope of this work, the analysis is focused on material composition. One way to determine the embodied energy was according to the dimensional and capacity characteristics of the modules. For example, the lithium-ion battery lifespan was classified according to the capability of completing the number of projected charge and discharge cycles of use that the user expects, as well as the weight of the module package (Dimitrijevic 2011).
With the information available up to this point, the total embodied energy in the product can be determined, as well as the partial embodied energy in each of the modules. There are also the lifespans of each module and, among them, the one with the lowest lifespan (LLM - lowest lifespan module). This module is of great importance in the proposed methodology, since, depending on the type of its fastening to the product, it will be responsible for the total lifespan of the product. In the case of the studied smartphone, the battery (module 4) is the one with lowest lifespan.
Embodied energy distribution
The main difference between the proposed methodology and the annualized embodied energy (AEE) that is traditionally applied to buildings (e.g., Hernandez and Kenny 2010) is dimensionally limited to the energy embodied per square meter constructed, as seen in Section 2. In the case of smartphones, following the guidelines of Smil (2010), energy is considered as a distribution that can be expressed in terms of density in relation to mass or the volume of the product. It could also be expressed in terms of gravimetric energy, volumetric energy or even, when calculated as the accumulated cost during its useful life, as embodied economic energy (Simões et al. 2013). In this way, it is explained the need to redefine the relationship between embodied energy and the useful life to be used as a function of an additional variable, which will result in the determination of the impact to be analyzed.
Equation (1) shows the energy density δE for factor Y1 (e.g., mass, volume) (Smil 2010), whereas Equation (2) presents the power density δP for the same factor Y1 (e.g., gravimetric, volumetric) (Smil 2010). Equation (3) is used to calculate the annualized embodied energy (AEE) density by dividing the embodied energy by time T and constructed area A (Hernandez and Kenny 2010), while Equation (4) defines the annualized embodied power (AEP) (a function of the constructed area), which was obtained by multiplying AEE of Eq. (3) by time T. Equation (5) represents the embodied power, which can be evaluated as a function of factor Y1. The relationship between the embodied power and the useful life is defined as the potential embodied power (PEP) when independent of another variable Y1.
𝛿𝐸 𝑌 (1)
𝛿𝑃 𝑌 (2)
𝐴𝐸𝐸 (3)
𝐴𝐸𝑃 𝐴𝐸𝐸 𝑇 (4)
The methodology presents three scenarios to determine the discarded energy:
a) The first (current) scenario defines the lifespan of the product based on the lower lifespan module and calculates the discarded energy when the product needs to be discarded considering the type of fastening of the module to the product and is not replaceable if it affects product integrity.
b) The second (optimized) scenario solves the limiting factor of scenario (a), allowing the replacement of those modules with a lifespan lower than the lifespan of module 3 (called “central module”), and the lifespan of the product becomes equal to the lifespan of the module with higher embodied energy by weight in the product. In the case of smartphones, this is the central module, which has 97% of the total embodied energy, becoming the constraining module of the product. This points to an appropriate means of reducing the discarded energy in a new product design.
c) The third (ideal) scenario considers an average lifespan, in which the design solutions can achieve similar lifespans for each module, which would optimize the amount of discarded energy by the occurrence of failure simultaneously in any component of the product.
The cases are presented in the next section, which have different opportunity costs resulting from material or design decisions that modify the rate between embodied energy and time of use. The concept of opportunity cost is used to compare different scenarios. The resulting variation allows determining the weight of the choice made in relation to a different choice, and the value obtained is considered an indicator for design decision making in the context of discarded energy.
Results and discussion
This section starts with the calculation of the potential embodied power (PEP) for the three proposed cases.
Case 1: calculation using lower lifespan module values (current state).
PEP for module 1: 224.9 MJ/3.5 years = 64.25 MJ/year = 5.35 MJ/month = 2.04 W
PEP for the product: In order to calculate PEP for the product, which corresponds to the embodied energy distribution during the time that the product is in use, the lowest lifespan is considered as the lifespan of the module that cannot be replaced with shorter life expectancy. PEP is calculated by dividing the sum of the embodied energies of the modules by the lowest module lifespan, as shown in Equation (6):
𝑃𝐸𝑃 ∑ (6)
where EE is the embodied energy, and n is the number of modules. In the current state, the product data are as follows:
Lowest lifespan = 2.5 years (30 months), limited by module 4 (battery) Total embodied energy = 232.65 MJ
Thus,
PEP = 232.65 MJ/2.5 years = 93.06 MJ/year = 7.76 MJ/month = 3.00 W
The value of 3.00 W corresponds to the PEP at the beginning of the product lifespan, which is higher than the PEP for module 1 only (equal to 2.04 W). This reveals the presence of a constraint to a higher embodied power, using the same materials and processes. In order to clarify this, these values were compared with two alternative scenarios, which are described below.
Case 2: change in limiting module lifespan (optimized state).
If the battery module in this electronic device could not be replaced because it is attached to the product body, when the battery reaches its lifespan expectation, the whole device will have to be disposed. However, in the case of a separated and replaceable battery, when the battery reaches its end of life (2.5 years), the lowest product lifespan becomes the PWB lifespan (3.5 years), and the new PEP is calculated as follows:
Lowest lifespan = 3.5 years (42 months) limited by module 1 (PWB)
Total embodied energy = 234.65 MJ (resulting from the addition of a new battery with embodied energy equal to 2.0 = MJ)
Thus,
PEP = 234.65 MJ/3.5 years = 67.04 MJ/year = 5.59 MJ/month = 2.13 W
When adding a new module (i.e., the new battery), PEP is lower than maintaining the original battery attached to the product (equal to 3.00 W). It can be noticed that PEP values may be used to infer the impact generated by the product.
Case 3: consider average lifespan of the modules (ideal state).
Case 3 would be a scenario in which the lifespan of all modules would be approximately the same. In this context, a likely design decision would be to have modules with materials and components with similar lifespans. So, if a failure occurs in any module, it does not matter which module fails because every module is close to its end of life. This could be considered as an ideal disposable product, since its end of life is reached approximately at the same time as the lifespan of all its modules.
In this case, the total embodied energy is considered as being the same as in case 1, and the lifespan is considered as being equal to the average of the lifespan projections of the modules. This average value is equal to 6.25 years. PEP for this case is calculated as shown below:
Lifespan = 6.25 years (75 months)
New AEE = 232.65 MJ/6.25 years = 37.22 MJ/year (3.10 MJ/month) PEP = 1.18 W.
Opportunity cost
When comparing the results obtained in the three scenarios, it is evident that the variation in the values obtained allows an opportunity cost analysis to be carried out in order to evaluate the difference in the resulting impacts. The potential embodied power (PEP) can be considered as an indicator that allows assessing the relationship between the energy investment and the useful life of the product. Thus, each product has a current value of PEP, and this value can be used during product design to make available design choices so as to reduce the environmental impact, in the same way as a property map of materials (Ashby 2009) is used.
A reduction in the value of PEP means that the impact of the product on the environment is reduced through the improved use of energy and/or the increase in lifespan. The obtained values of PEP for the three cases are shown in Table 4.
The opportunity cost will be referred to as “opportunity power,” which the power obtained with the chosen option minus the power is obtained with the best option. In order to calculate the opportunity power, the lowest value of PEP among the cases is considered as the reference value, and the PEP values for the cases are subtracted from the PEP of case 3. The values of opportunity power for the three cases are also shown in Table 4.
Table 4. PEP and opportunity power values obtained for the three cases. Cases Total embodied energy
(MJ) Lowest lifespan (months) PEP (W) Opportunity power (W) 1 232.65 30 (battery module) 3.00 1.82 2 234.65 42 (PWB module) 2.13 0.95 3 232.65 75 (average lifespan) 1.18 0.00
As pointed out in case 2 in Table 4, the design of an electronic device with an attached battery, which has less than 1% of the total amount of embodied energy in the product, results in an opportunity power of 0.87 W (i.e., 3.00 W − 2.13 W) when compared with a device with a replaceable battery.
This is an unnecessary increase in power, which represents the unnecessary energy consumed during usage time of the modules, when compared with the situation in which the modules had been discarded.
The use of a quotient to determine the opportunity power allows the use of other variables such as currency and number of workers. This permits the use of PEP to estimate the profit or loss resulting from the decisions during the design phase, and it may be considered as a property of the product.
At this moment, as shown in Table 4, the product may have an opportunity cost value of 0.00 W, 0.95 W or 1.82 W. In order to make a decision, a chart is created, which is described below.
Analysis of the PEP table
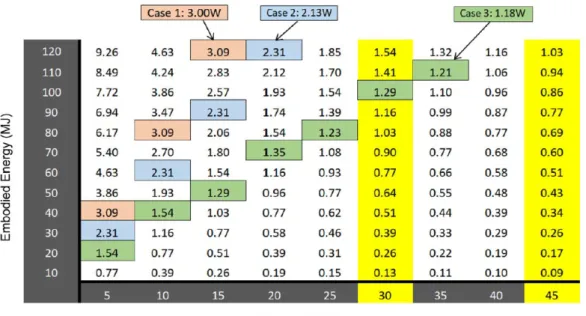
The results obtained in the previous section were used to build a table, using Equation (6) to evaluate the behavior of PEP for the three analyzed cases. Table 5 contains the results, in which the columns represent the useful life (in months), whereas the rows correspond to the embodied energy in
the manufacture of the product (in MJ). In Table 5, the power values immediately above the power obtained in case 1 (3.0 W), case 2 (2.18 W) and case 3 (1.18 W) are marked with different colors.
The purpose of marking the values for different months in Table 5 is to compare the limiting PEP values with the values of embodied energy and product lifespan. The exact lifespan values for a PEP value can be calculated from the table. For example, for case 2 (PEP = 2.13 W), for the embodied energy of 120 MJ, the product lifespan is equal to 22.0 months.
Table 5. PEP (in Watt) for different values of embodied energy (EE) (rows in MJ) and the lowest lifespan (LLM) (columns in months).
The yellow columns in months 30 and 45 correspond to the points at which the end of product life is reached from the LLM point of view (cases 1 and 2, respectively).
In Figure 5, the embodied energy was extended to 310 MJ (rows) and the product lifespan was extended to 80 months (columns), allowing to visualize the regions that correspond to product breakdown, which take place in values close to 230 MJ, as shown in Table 4. For the ideal case (which is case 3, with PEP = 1.18 W), the useful life of the product is equal to 75 months.
Figure 5. PEP (in Watt) for different values of embodied energy (EE) (extended to 310 MJ) in the rows and the lowest lifespan (LLM) (extended to 80 months) in the columns.
Basically, the values in Table 5 and Figure 5show that a constant value of PEP can be achieved considering the embodied energy or the product lifespan. In this context, the lifespan of the product may vary depending on the lifespan of the non-replaceable element with the shortest lifetime, which allows changing the configuration of the product layout to control the lower lifespan. At the same time, the embodied energy can be changed depending on the choice of materials, processes and suppliers.
As shown in Table 5and Figure 5, the value of the energy densities can be the same at different points. For example, a product with 40 MJ of embodied energy and lifespan of five months, and another product with 230 MJ of embodied energy and lifespan of thirty months will have the same value of PEP (equal to 3.0 W). This means that by setting the PEP value to 3.0 W, the designer’s decisions allow modifying the materials and parts of the product, as well as influencing the transportation of the product, so that the increase in the lifespan allows maintaining the value of PEP equal to 3.0 W.
The results allow comparing two or more versions of the same product (in this case, smartphones) and assess how a design decision can positively or negatively change the environmental impact of the product. When a choice is made and the PEP calculation determines that the result is non-beneficial to the environment, the methodology presents a reference value to which it can be returned by analyzing the variables available in the LCA.
For example, finding suppliers near the product’s assembly location decreases the value of the embodied energy required to transport parts. Using more efficient manufacturing processes and decreasing consumption (selecting, for example, lighter materials) are actions that result in an appropriate contribution that can be calculated in relation to the initial state of the product. Embodied power enhancement allows making decisions regarding the lifespan of the modules that compose the product, including the type of module fastening to the product.
In this context, Table 6shows how setting one of the variables can contribute to optimizing the value of PEP, moving from the value in case 1 (3.0 W) to the value in case 3 (1.18 W), which is the ideal case.
Table 6. Changing variables in order to move from case 1 to case 3. Embodied energy
during the product lifespan - EE (MJ) Lower lifespan module -LLM (months) Potential embodied power - PEP (W) Reference value (ideal case) (W) Opportunity power (W) 232.65 30 3.00 1.18 1.82 230.65 76 1.18 1.18 0 91.7 30 1.18 1.18 0
By keeping the embodied energy constant, equal to 232.65 MJ, but extending the lifespan of the product to 76 months, by changing the modules as well as their means of fastening to the product, the designer can change the PEP value of the current state to the ideal state (case 3). On the other hand, based on the values in Table 6, if the manufacturer’s intention is to limit the product usage time to 30 months, the design choices cannot lead to an embodied energy greater than 91.7 MJ over the entire product lifespan.
Considering that the potential embodied power was defined using more than one variable, the proposed methodology provides versatility combined with simplicity, since, as described in this article, the values of the impact indicator allow its visualization in a table, indicating which values of the variables should be chosen to minimize environmental impact.
Conclusions
In this work, a new sustainability indicator was proposed, which comprises the embodied energy and the lifespan of the components present in a product. No indicator has been found in the literature that encompasses these variables in the manner proposed in this article. This indicator can be used for product design decision making.
One of the conclusions of this work is that, using the proposed methodology, it is verified that a reduced value of embodied energy during the first life cycle of a product is not a guarantee of an environmentally friendly process, in case a product is discarded quickly, being deposited in a landfill after a short time of use. Similarly, developing a product with an extended lifespan does not guarantee that it will be more sustainable than those with a shorter lifespan, if the embodied energy for its manufacture and use is significantly higher.
The PEP indicator can be used to compare two different products (or the same product before and after a design modification) in order to determine which is more sustainable. This is because the indicator delivers a quantitative result on the factor in the relationship between the resources used and the duration of the first product life cycle, allowing determining the product with the least environmental impact.
Since PEP calculation uses a methodology as a tool, it manifests the responsibility of the designer regarding the product lifespan and how this decision will affect the environment. This information also allows the consumer the chance to know the consequences of his/her choices and an additional view of his/her own participation in the sustainable chain.
The PEP indicator can be used for the formulation of new indicators, according to, for example, the chosen material chart. It is possible to represent composed variables, as in the case of strength
versus toughness. This allows the comparison with other LCA parameters, expanding the lack of potential analysis, and this can be explored in future studies.
This article aims to demonstrate the importance of a dynamic scenario, extending the possibility of comparisons beyond the energy invested in the product. By definition, the PEP indicator opens the possibility to develop new equations, which may consider other variables such as the GHG emissions per product, the hazard generated when the product is disposed and the energy returned by components reentry in the consumption chain.
Industry can use a composed variable such as PEP to contemplate improvements in the level of impact of environmental factors such as CO2 emission or acidification, when related to the product lifespan. This can be done by grouping the impact factors in order to analyze them as a weighted composition of the use of, for example, a type of material.
One limitation of the proposed methodology occurs if there is lack of technical knowledge over technological development, resulting in reduced reliability during the lifespan of the product components. In this case, the product may fail at any time for different reasons, and this prevents the calculation of the lowest lifespan, as well as disabling a projection of the first product life cycle. Another limitation corresponds to the lack of quality control of the components from the suppliers that are used in the manufacture of the product. The lack of information about the energy embodied in the production and transportation of these components prevents determining the total embodied energy in the product.
It is suggested as future work carrying out an economic analysis in order to compare design modifications that influence the choice of suppliers and types of transportation, keeping the manufacturing cost and the cost of the product (for example, using graphs that relate the cost per volume as a function of the Young modulus) (Ashby 2009), seeking to improve the values of the embodied power in the product, which should result in more sustainable products.
Funding
This study was supported by Conselho Nacional de Desenvolvimento Científico e Tecnológico and Coordenação de Aperfeiçoamento de Pessoal de Nível Superior (BR).
References
Amaral DC, Rozenfeld H (2007) Integrating new product development process references with maturity and change management models. In: Proceedings of the international conference on engineering design (ICED), Paris, France.
Andrae A, Vaija M (2014) To which degree does sector specific standardization make life cycle assessments comparable? - The case of global warming potential of smartphones. Challenges 5(2):409-429.
Ashby MF (2009) Materials and the environment: eco-informed material choice. Elsevier, Burlington, MA.
Ashby MF, Johnson K (2013) Materials and design: the art and science of material selection in product design. Butterworth- Heinemann, Oxford.
Azapagic A, Perdan S (2000) Indicators of sustainable development for industry: a general framework. Process Saf Environ Prot 78(4):243-261.
Bakker C, Wang F, Huisman J, Den Hollander M (2014) Products that go round: exploring product life extension through design. J Clean Prod 69:10-16.
Bonvoisin J, Halstenberg F, Buchert T, Stark R (2016) A systematic literature review on modular product design. J Eng Des 27(7):488-514.
Carlon K (2016) Galaxy Note 7 teardown reveals another not-easy- to-fix Samsung phone. www.androidauthority.com/samsung- galaxy-note-7-teardown-results-710951. Accessed 10 Mar 2019.
Chatzisideris MD, Espinosa N, Laurent A, Krebs FC (2016) Ecodesign perspectives of thin-film photovoltaic technologies: A review of life cycle assessment studies. Sol Energy Mater Sol Cells 156:2-10.
Cherubini F, Bargigli S, Ulgiati S (2009) Life cycle assessment (LCA) of waste management strategies: landfilling, sorting plant and incineration. Energy 34(12):2116-2123.
Ciceri ND, Gutowski TG, Garetti M (2010) A tool to estimate mate- rials and manufacturing energy for a product. In: Proceedings of the 2010 IEEE international symposium on sustainable systems and technology, pp 1-6.
Collado-Ruiz D, Capuz-Rizo SF (2010) Modularity and ease of dis- assembly: study of electrical and electronic equipment. J Mech Des 132(1):014502.
Cooper DR, Skelton AC, Moynihan MC, Allwood JM (2014) Com- ponent level strategies for exploiting the lifespan of steel in products. Resour Conserv Recycl 84:24-34.
Da Silva AR, Giuliano A, Errico M, Rong BG, Barletta D (2019) Economic value and environmental impact analysis of lignocel- lulosic ethanol production: assessment of different pretreatment processes. Clean Technol Environ Policy 21(3):637-654.
De Benedetto L, Klemeš J (2009) The environmental performance strategy map: an integrated LCA approach to support the stra- tegic decision-making process. J Clean Prod 17(10):900-906.
Dimitrijevic M (2011) Lithium ion battery assembly challenges. https://www.ecnmag.com/article/2011/01/lithium-ion-battery- assembly-challenges. Accessed 23 Jan 2019.
Duran JFO, Ferreira JCE (2015) Method to determine the discarded energy resulting from inadequate management of a family of products due to planned obsolescence. In: Proceedings of the 25th FAIM-international conference flexible automation and intelligent manufacturing. June 23-26, Wolverhampton, UK.
smartphone. In: ICT for sustainability. Atlantis Press.
European Energy Commission (2017) European Commission. https://ec.europa.eu/energy/en/topics/energy-efficiency/energy-efficient-products. Accessed 12
Feb 2019.
Evers S, Nazar LF (2012) New approaches for high energy density lithium–sulfur battery cathodes. Acc Chem Res 46(5):1135-1143.
Hanafy M, ElMaraghy H (2017) Modular product platform configuration and co-planning of assembly lines using assembly and disassembly. J Manuf Syst 42:289-305.
Heidrich O, Tiwary A (2013) Environmental appraisal of green production systems: challenges faced by small companies using life cycle assessment. Int J Prod Res 51(19):5884-5896.
Heijungs R, Huppes G, Guinée JB (2010) Life cycle assessment and sustainability analysis of products, materials and technologies. Toward a scientific framework for sustainability life cycle analysis. Polym Degrad Stab 95(3):422-428.
Hernandez P, Kenny P (2010) From net energy to zero energy buildings: defining life cycle zero energy buildings (LC-ZEB). Energy Build 42(6):815-821.
Herva M, Franco A, Carrasco EF, Roca E (2011) Review of corporate environmental indicators. J Clean Prod 19(15):1687-1699
Ingarao G (2017) Manufacturing strategies for efficiency in energy and resources use: the role of metal shaping processes. J Clean Prod 142:2872-2886.
International Standards Organization (2006a) International standard ISO 14040: environmental management-life cycle assessment-principles and framework. International Standards Organization, Geneva.
International Standards Organization (2006b) International standard ISO 14044: environmental management-life cycle assessment-requirements and guidelines. International Standards Organization, Geneva.
International Standards Organization (2016) International standard ISO 11469: plastics-generic identification and marking of plastics products. International Standards Organization, Geneva. Jahan A, Edwards KL, Bahraminasab M (2016) Multi-criteria decision analysis for supporting the
selection of engineering materials in product design, 2nd ed. Butterworth-Heinemann, Oxford.
Jahan A, Ismail MY, Sapuan SM, Mustapha F (2010) Material screening and choosing methods-a review. Mater Des31(2):696-705.
Jeswani HK, Azapagic A, Schepelmann P, Ritthoff M (2010) Options for broadening and deepening the LCA approaches. J Clean Prod 18(2):120-127.
Kasulaitis BV, Babbitt CW, Kahhat R, Williams E, Ryen EG (2015) Evolving materials, attributes, and functionality in consumer electronics: case study of laptop computers. Resour Conserv Recycl 100:1-10.
Knauf M (2015) Applying opportunity costs to correctly interpret resource efficiency in LCA studies and environmental product declarations. Eur J Wood Wood Prod 73(2):251-257.
LG (2015) 2014–2015 LG Electronics sustainability report. Seoul, South Korea: CSR Team.
https://www.lg.com/global/pdf/Sustainability-Report/2014-2015%20Sustainability-Report.pdf. Accessed 19 Nov 2018.
Lu H, Liu G (2015) Opportunity costs of carbon emissions stemming from changes in land use. Sustainability 7(4):3665-3682.
Mascle C (2017) Design for complex product rebirth or how to protect resources. In: DS 87-1 Proceedings of the 21st international conference on engineering design (ICED 17), vol 1: resource sensitive design, design research applications and case studies, Vancouver, Canada, August 21-25, pp 31-40.
McLaren J, Wright L, Parkinson S, Jackson T (1999) A dynamic life-cycle energy model of mobile phone take-back and recycling. J Ind Ecol 3(1):77-91.
Mendoza Beltran A, Prado V, Font Vivanco D, Henriksson PJ, Guine’e JB, Heijungs R (2018) Quantified uncertainties in comparative life cycle assessment: what can be concluded? Environ Sci Technol 52(4):2152-2161.
Mitchell IK, Walinga J (2017) The creative imperative: the role of creativity, creative problem solving and insight as key drivers for sustainability. J Clean Prod 140:1872-1884.
Morales M, Chimenos JM, Fernández AI, Segarra M (2014) Materials selection for superheater tubes in municipal solid waste incineration plants. J Mater Eng Perform 23(9):3207-3214.
Musallam M, Johnson CM, Yin C, Lu H, Bailey C (2008) Real-time life expectancy estimation in power modules. In: Proceedings of the 2nd electronics system-integration technology conference, London, UK, September, pp 231-236.
Nasser L, Curtin M (2006) Electronics reliability prognosis through material modeling and simulation. In: Proceedings of the IEEE aerospace conference, Big Sky, MT, USA.
Nepal B, Monplaisir L, Singh N (2007) A framework to integrate design for reliability and maintainability in modular product design. Int J Prod Dev 4(5):459-484.
Nouri J, Nouri N, Moeeni M (2012) Development of industrial waste disposal scenarios using life-cycle assessment approach. Int J Environ Sci Technol 9(3):417-424.
O’Connor P, Kleyner A (2012) Practical reliability engineering, 5th ed. Wiley, Chichester.
Padgett JP, Steinemann AC, Clarke JH, Vandenbergh MP (2008) A comparison of carbon calculators. Environ Impact Assess Rev 28(2-3):106-115.
Pastare L, Romagnoli F, Lauka D, Dzene I, Kuznecova T (2014) Sustainable use of macro-algae for biogas production in Latvian conditions: a preliminary study through an integrated MCA and LCA approach. Environ Clim Technol 13(1):44-56.
Pereira SM, Ferreira JCE, Duran JFO (2018) Discarded energy and CO2 emission during the life cycle of laptops in the context of planned obsolescence. In: Proceeding of the 48th international conference on computers and industrial engineering (CIE 48), Auckland, New Zealand, December 2-5.
Ramesh T, Prakash R, Shukla KK (2010) Life cycle energy analysis of buildings: an overview. Energy Build 42(10):1592-1600.
Reap J, Roman F, Duncan S, Bras B (2008) A survey of unresolved problems in life cycle assessment. Int J Life Cycle Assess 13(5):374.
Sartori I, Napolitano A, Voss K (2012) Net zero energy buildings: a consistent definition framework. Energy Build 48:220-232.
Seow Y, Rahimifard S (2011) A framework for modelling energy consumption within manufacturing systems. CIRP J Manuf Sci Technol 4(3):258-264.
Shah DU (2014) Natural fibre composites: comprehensive Ashby-type materials selection charts. Mater Des 1980-2015(62):21-31.
Simões CL, Pinto LMC, Simões R, Bernardo CA (2013) Integrating environmental and economic life cycle analysis in product development: a material selection case study. Int J Life Cycle Assess 18(9):1734-1746.
Smil V (2010) Power density primer: understanding the spatial dimension of the unfolding transition to renewable electricity generation (part I-definitions). Master resource, a free market energy blog. https://vaclavsmil.com/wp-content/uploads/docs/smil-artic le-power-density-primer.pdf. Accessed 25 Feb 2019.
Smil V (2016) Embodied energy: mobile devices and cars [numbers don’t lie]. IEEE Spectr 53(5):26. Sofia D, Gioiella F, Lotrecchiano N, Giuliano A (2019) Cost-benefit analysis to support
decarbonization scenario for 2030: a case study in Italy. Energy Policy 137:111137.
Spangenberg JH (2002) Environmental space and the prism of sustain- ability: frameworks for indicators measuring sustainable development. Ecol Indic 2(3):295-309.
Spiller SA (2011) Opportunity cost consideration. J Consum Res 38(4):595-610.
Stephan A, Stephan L (2016) Life cycle energy and cost analysis of embodied, operational and user-transport energy reduction measures for residential buildings. Appl Energy 161:445-464. Suckling J, Lee J (2015) Redefining scope: the true environmental impact of smartphones? Int J Life
Cycle Assess 20(8):1181-1196.
of energy-saving and emission- reduction of products. IEEE Trans Ind Inf 10(2):1252-1261. Ulrich K, Tung K (1991) Fundamentals of product modularity, In: Proceedings of ASME winter annual
meeting conference, Atlanta, USA, vol 39, pp 73-80.
Vinodh S, Ruben RB, Asokan P (2016) Life cycle assessment integrated value stream mapping framework to ensure sustain- able manufacturing: a case study. Clean Technol Environ Policy 18(1):279-295.
Vyhmeister E, Ruiz-Mercado GJ, Torres AI, Posada JÁ (2018) Optimization of multi-pathway production chains and multi- criteria decision-making through sustainability evaluation: a biojet fuel production case study. Clean Technol Environ Policy 20(7):1697–1719.
Wang G, Wang B, Wang X, Park J, Dou S, Ahn H, Kim K (2009) Sn/graphene nanocomposite with 3D architecture for enhanced reversible lithium storage in lithium ion batteries. J Mater Chem 19(44):8378-8384.
Zink T, Maker F, Geyer R, Amirtharajah R, Akella V (2014) Compara- tive life cycle assessment of smartphone reuse: repurposing vs. refurbishment. Int J Life Cycle Assess 19(5):1099-1109. Zu CX, Li H (2011) Thermodynamic analysis on energy densities of batteries. Energy Environ Sci