1Program in Neurogenetics, Department of Neurology, David Geffen School of Medicine, University of California, Los Angeles, Los Angeles, CA, USA. 2CNS Drug Discovery Unit, Pharmaceutical Research Division, Takeda Pharmaceutical Company Limited, Fujisawa, Kanagawa, Japan. 3Department of Biochemistry, Emory University School of Medicine, Atlanta, GA, USA. 4Alzheimer’s Disease Research Center and Department of Neurology, Emory University School of Medicine, Atlanta, GA, USA. 5Chemical Neurobiology Laboratory, Center for Genomic Medicine, Massachusetts General Hospital and Harvard Medical School, Boston, MA, USA. 6A full list of members and affiliations appears at the end of this paper. 7Center for Neurodegenerative Disease Research, Department of Pathology and Laboratory Medicine, Perelman School of Medicine at the University of Pennsylvania, Philadelphia, PA, USA. 8The Penn FTD Center, Department of Neurology, Perelman School of Medicine at the University of Pennsylvania, Philadelphia, PA, USA. 9Department of Human Genetics, David Geffen School of Medicine, University of California, Los Angeles, Los Angeles, CA, USA. 10Institute of Precision Health, University of California, Los Angeles, Los Angeles, CA, USA. 11These authors contributed equally to this work: Vivek Swarup, Flora I. Hinz. *e-mail: [email protected]
F
rontotemporal dementia (FTD) is a highly heritable and
com-mon cause of presenile dementia often caused by dominantly
acting mutations in the microtubule-associated protein tau
(MAPT; tau) and in two other genes, granulin precursor (GRN) and
chromosome 9 open reading frame 72 (C9orf72)
1. Tau pathology
is also a core feature of numerous other neurodegenerative
syn-dromes, including Alzheimer’s disease (AD) and progressive
supra-nuclear palsy (PSP), and is associated with the pattern of cognitive
decline in AD (PSP; for a review see refs
2–4). Thus, identifying the
mechanisms by which tau and other dementia-causing mutations
lead to neurodegeneration is of foremost importance in developing
new therapies for dementia.
Translating mechanistic studies in mouse models of
demen-tia to human clinical trials has proved challenging
5,6. We reasoned
that one contributing factor, aside from the evolutionary distance
between mouse and humans
7, is that common laboratory mouse
strains are highly inbred. Although genetic background profoundly
affects the biochemical and behavioral repertoires of mouse models
of AD
8,9, virtually all studies of neurodegeneration in mice rely on a
single inbred strain
10,11.
In this study, we took a multistep systems biology approach
to identify robust, human disease-relevant gene networks. To
minimize the likelihood that findings were dependent on a single
genetic background, we crossed transgenic (Tg) mice
harbor-ing the FTD-causharbor-ing P301S mutation onto three distinct
back-grounds and identified early transcriptomic changes observed
across mutant F1 progeny, comparing vulnerable regions, such as
the cortex and brain stem, to regions less affected in the human
tauopathies, such as the cerebellar hemispheres
12. Through gene
network analysis, we identified two major coexpression modules
that are conserved across genetic backgrounds and in humans.
These modules delineate key pathways deregulated in disease and
are differentially enriched for genetic drivers of human FTD, AD
and PSP. Using an unbiased integrative genomics approach, we
uncovered genome-wide relationships between miRNAs and their
biological targets; we experimentally validated these relationships
by demonstrating that overexpression of a predicted driver,
miR-203, recapitulates the mRNA expression patterns observed with
disease and promotes neurodegenerative pathways. As a proof
of principle, we also showed that one can leverage these highly
conserved coexpression modules to identify tool compounds that
mitigate the neurodegeneration induced by miR-203.
Results
We analyzed the F1 offspring resulting from crosses of TPR50 mice
expressing the human tau
P301Stransgene
13onto FVB, DBA and parent
Identification of evolutionarily conserved gene
networks mediating neurodegenerative dementia
Vivek Swarup
1,11, Flora I. Hinz
1,11, Jessica E. Rexach
1, Ken-ichi Noguchi
2, Hiroyoshi Toyoshiba
2,
Akira Oda
2, Keisuke Hirai
2, Arjun Sarkar
1, Nicholas T. Seyfried
3,4, Chialin Cheng
5, Stephen J. Haggarty
5,
International Frontotemporal Dementia Genomics Consortium
6, Murray Grossman
7,
Vivianna M. Van Deerlin
8, John Q. Trojanowski
8, James J. Lah
4, Allan I. Levey
4, Shinichi Kondou
2and
Daniel H. Geschwind
1,9,10*
Identifying the mechanisms through which genetic risk causes dementia is an imperative for new therapeutic development.
Here, we apply a multistage, systems biology approach to elucidate the disease mechanisms in frontotemporal dementia. We
identify two gene coexpression modules that are preserved in mice harboring mutations in MAPT, GRN and other dementia
mutations on diverse genetic backgrounds. We bridge the species divide via integration with proteomic and transcriptomic
data from the human brain to identify evolutionarily conserved, disease-relevant networks. We find that overexpression of
miR-203, a hub of a putative regulatory microRNA (miRNA) module, recapitulates mRNA coexpression patterns associated
with disease state and induces neuronal cell death, establishing this miRNA as a regulator of neurodegeneration. Using a
data-base of drug-mediated gene expression changes, we identify small molecules that can normalize the disease-associated
mod-ules and validate this experimentally. Our results highlight the utility of an integrative, cross-species network approach to
drug discovery.
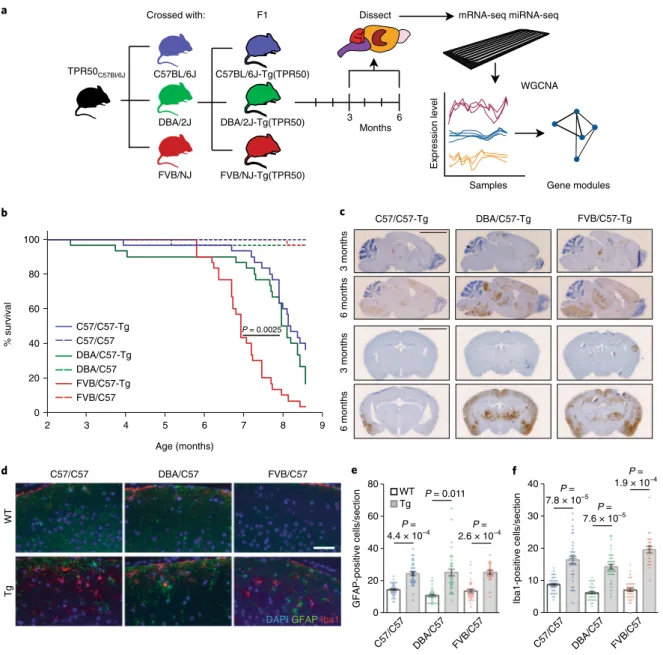
C57BL/6 lines (Fig.
1a
). All three F1 crosses share key features of the
disease
13,14, including decreased survival (Fig.
1b
) and body weight
(Supplementary Fig. 1a,b), progressive accumulation of
hyper-phosphorylated tau in the cortex and hippocampus (AT8 staining;
Fig.
1c
), and prominent astrogliosis and microgliosis (Fig.
1d–f
).
We observed that, consistent with previous reports that FVB mice
can be more vulnerable to neurodegeneration, F1 tau
P301STg mice
on the FVB/C57 (TPR50
× FVB/NJ) background had decreased
survival and increased pathological tau compared with the C57/C57
(TPR50 × C57BL/6J) and DBA/C57 (TPR50 × DBA/2J) progeny
(Fig.
1b
and Supplementary Fig. 1c–h). Importantly, no significant
decrease in the weight of any of the affected brain areas was detected
in Tg animals at 6 months (Supplementary Fig. 1i), consistent with
previous data showing no cell loss at this stage
13.
We next investigated whether we could identify a robust,
disease-specific transcriptional signature by sampling brain regions
vary-ing in disease vulnerability, reasonvary-ing that key disease-related gene
expression patterns would overlap across affected areas (cortex,
hippocampus, brain stem) but would be absent in the cerebellum,
which is unaffected
12. We performed RNA sequencing (RNA-seq)
of four brain regions at two time points across the three genetic
backgrounds (36 samples per region per time point for a total of
a d C57/C57 DBA/C57 FVB/C57 WT Tg 0 20 40 60 80 e GFAP-positive cells/section 0 10 20 30 40 Iba1-positive cells/section f
DAPI GFAP Iba1
FVB/C57 C57/C57 DBA/C57 C57/C57 DBA/C57 FVB/C57 TPR50C57Bl/6J FVB/NJ C57BL/6J DBA/2J F1 Crossed with: 3 6
Dissect mRNA-seq miRNA-seq
Months Gene modules Samples Expression level WGCNA FVB/NJ-Tg(TPR50) C57BL/6J-Tg(TPR50) DBA/2J-Tg(TPR50) % survival 0 20 40 60 80 100 2 3 4 5 6 7 8 9 Age (months) FVB/C57-Tg C57/C57-Tg DBA/C57-Tg 3 months 6 months 3 months 6 months b c FVB/C57 FVB/C57-Tg C57/C57 C57/C57-Tg DBA/C57-Tg DBA/C57 P = 0.0025 WT Tg P = 4.4 × 10⁻⁴ P = 0.011 P = 2.6 × 10⁻⁴ P = 7.8 × 10⁻⁵ P = 7.6 × 10⁻⁵ P = 1.9 × 10⁻⁴
Fig. 1 | Experimental design and characterization of TPR50 tau Tg mice in divergent genetic backgrounds. a, Schematic of the experimental design highlighting that TPR50 mice were crossed with three genetically divergent mouse strains and that tissue from the cortex, hippocampus, brain stem and cerebellum from the resulting F1 crosses was isolated at 3 and 6 months for mRNA-seq, miRNA-seq and downstream WGCNA. b, Kaplan–Meier survival curve showing significantly decreased survival of all Tg mice compared to their WT littermates, as well as decreased survival of the FVB/C57-Tg mice compared to DBA/C57-Tg and C57/C57-Tg mice (two-sided log rank test, P = 0.0025; n = 180, 15 males and 15 females per condition). c, Representative images from three independent experiments of phospho-tau-specific AT8 staining and hematoxylin counterstaining in coronal and sagittal brain sections of 3- and 6-month-old Tg mice of all three strains (n = 4 mice per group). Sagittal scale bar, 4 μ m; coronal scale bar, 3 μ m. d, Representative images from three independent experiments showing cortical sections of 6-month-old WT and Tg mice of all three strains stained against Iba1 (red) and GFAP (green) and the nuclear counterstain DAPI (blue). Scale bar, 50 μ m. e,f, Quantification of GFAP-positive (e) and Iba1-positive (f) cells from the cortical slices of 6-month-old mice (unpaired two-tailed t-test; n = 6 images per mouse, 3 mice per genotype). The center line represents the mean, and error bars show s.e.m.
288 RNA-seq samples; Fig.
1a
and Methods). The differentially
expressed genes from Tg and wild-type (WT) mice clearly separate
the tau mutant from WT genotypes within the affected brain regions
(Supplementary Fig. 2a–c), but not in the cerebellum (Supplementary
Fig. 2a), and are consistent across strains (Supplementary Fig. 2d,e).
There was significant overlap in differential expression (Methods
and Supplementary Fig. 3a) between the cortex and
hippocam-pus, and there was significant correlation between fold changes
in differentially expressed genes (Rank–rank hypergeometric test;
P
= 1.0 × 10
–409) from these two regions (R
2= 0.76, slope = 0.92;
Supplementary Fig. 3a). We found lesser, but significant correlation
in gene expression between the cortex and brain stem (R
2= 0.33,
slope
= 0.82; Supplementary Fig. 3a). Consistent with the absence of
significant cell loss at 6 months in this model
13, positive regulators of
apoptosis (
GO:0043065
) did not show significant changes across all
three strains (Supplementary Fig. 3b–e) and negative regulators of
apoptosis (
GO:0043066
) showed modest, more significant changes
(Supplementary Fig. 3f–i). Although we did not observe frank
apop-tosis, we saw evidence for initial activation of the cellular pathways
associated with inflammation in the cerebral cortex by 6 months,
including increases in glial fibrillary acidic protein (GFAP) and
ion-ized calcium-binding adapter molecule 1 immunoreactivity in the
cortex (Fig.
1d–f
).
We observed no significant overlap in gene expression between
the cortex and cerebellum (Supplementary Fig. 3j,k) and no
cor-relation between differentially expressed genes in the cortex and
cerebellum (R
2= 0.01, slope = 0.14; Supplementary Fig. 3a). Even
more striking is that the expression changes of the top upregulated
genes in the cerebellum were reversed in the cortex (Supplementary
Fig. 3l), implying that protective changes may potentially occur in
the cerebellum, as has been previously suggested
12.
Identification of disease-relevant mRNA modules. To place gene
exp-ression changes in a systems-level framework, we performed consensus-
weighted gene coexpression network analysis (WGCNA
15,16) across
all three heterozygous F1 mouse strains to identify relationships not
observed in only a single background (Supplementary Fig. 4a and
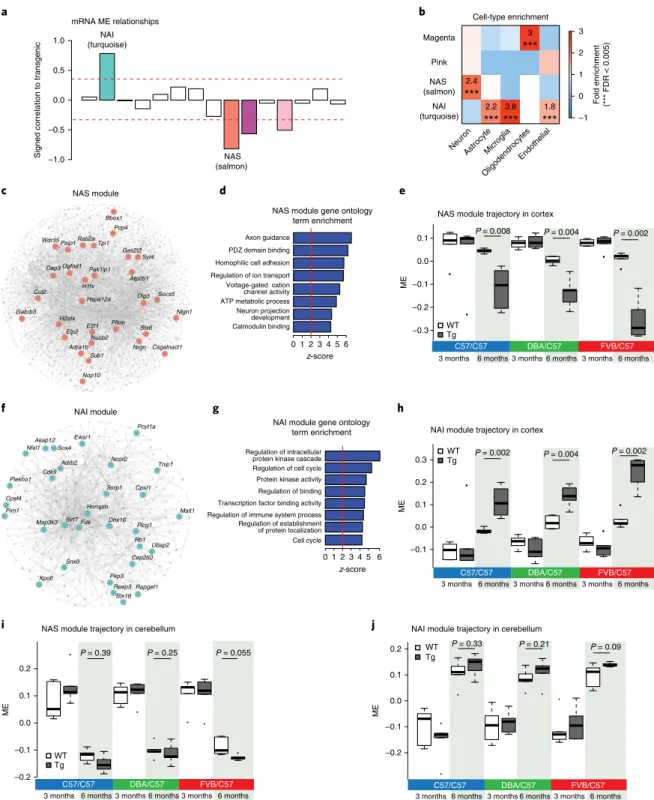
Supplementary Table 1). We identified four mRNA modules
signifi-cantly correlated with the transgenic condition in the cortex, which
we initially labeled the salmon, turquoise, magenta and pink
mod-ules according to the WGCNA conventions (Bonferroni-corrected
P
< 0.05; Fig.
2a
). Three of these modules are downregulated
(salmon, magenta and pink) and one module is upregulated
(tur-quoise) in Tg mice (Fig.
2a
). Cell-type enrichment analysis
dem-onstrated that the salmon module is enriched in neuronal markers,
the magenta module in oligodendrocyte markers and the turquoise
module in microglial, astrocyte and endothelial markers (Fig.
2b
)
across multiple different cell-type-specific gene expression
datas-ets (Supplementary Fig. 4b). Gene ontology analyses are consistent
with the cell-type enrichments, showing that the salmon module is
enriched for synaptic pathways and magenta for DNA repair and
transcription, while the turquoise module is enriched for immune
and inflammatory categories (Supplementary Fig. 4c,d).
We next calculated the correlation between expression changes
and an established early disease marker, the burden of
hyperphos-phorylated tau, which has been shown to correlate with disease
pro-gression in human FTD and AD
17,18. Genes that correlated highly
with phosphorylated (phospho)-tau levels (R
2> 0.6; Methods) were
found to be significantly enriched in the salmon (42-fold) and
tur-quoise modules (9.5-fold), but not in the magenta and pink
mod-ules (Supplementary Fig. 4e) we therefore focused our subsequent
analysis on the salmon and turquoise modules. Given the consistent
cell-type enrichments and strong gene ontology enrichments (Fig.
2b,d–g
and Supplementary Fig. 4b–d) and to provide more intuitive
names for these core disease-associated modules, we relabeled the
salmon module, the neurodegeneration-associated synaptic (NAS)
module, and the turquoise module as the
neurodegeneration-asso-ciated inflammatory (NAI) module.
To further investigate whether the expression changes were
dependent on changes in type composition or reflected
cell-intrinsic signaling changes, we applied a multivariate linear
regres-sion model using the top 100 cell-type-specific marker genes for five
major cell types
19,20(Methods). Both modules retained their
signifi-cant association with the transgenic condition (salmon, r = − 0.73,
P
= 8.6 × 10
−7; turquoise, r = 0.71, P = 3 × 10
−6), indicating that they
are independent of changes in cell-type composition caused by
neuronal loss or gliosis. Moreover, both the NAI and NAS module
eigengenes (MEs) showed changes across the affected brain regions
(cortex, Fig.
2e,h
; hippocampus, Supplementary Fig. 4f,g; brain
stem, Supplementary Fig. 4h,i), but not the cerebellum (Fig.
2i,j
),
prior to decreases in brain weight that would be indicative of cell
loss (Supplementary Fig. 1i). This is further supported by analysis
of expression profiles from sorted neurons and glia from the Tg4510
and PS2APP AD models, which showed cell-intrinsic changes in
the NAI and NAS module trajectories (Supplementary Fig. 5a–d).
The NAI module was highly preserved in both microglia and
astro-cytes and significantly upregulated in these populations in Tg mice
(Supplementary Fig. 5a,c,d–l), while the neuronal NAS module was
highly preserved in sorted neurons and downregulated in Tg mice
(Supplementary Fig. 5b,e–l).
We next used experimentally derived databases of human
pro-tein–protein interactions (PPI) from Inweb
21and BioGRID
22to
create an integrated coexpression-PPI network
23to functionally
annotate network edges and provide independent validation
24(Fig.
2c,f
). One of the hubs of the NAS module, STX6, a SNARE protein
25,
is also one of the few known genetic risk factors for tauopathy,
hav-ing been previously implicated by genome-wide association studies
(GWAS) and expression quantitative trait loci analyses in PSP. Other
hub proteins, such as Syt4, Nlgn1 and Nrgn, also play important
roles in synaptic maintenance and function
26,27. Functional
annota-tion of the NAS module with gene ontology and Kyoto Encyclopedia
of Genes and Genomes terms confirms its broader relationship to
synaptic function (Fig.
2d
and Supplementary Fig. 4c). In contrast,
functional annotation of the NAI module highlights pathways
asso-ciated with astrogliosis and inflammatory changes
28, including T
cell activation and Toll-like receptor signaling pathways (Fig.
2g
and
Supplementary Fig. 4d). Among the most central hub genes of the
NAI module are Tnip1 and Malt1, important inflammatory
signal-ing genes
29. The integrated coexpression-PPI network derived from
the NAI module also contains the gene Fus. Mutations in this gene
account for approximately 4% of familial amyotrophic lateral
sclero-sis (ALS), and it forms aggregates in ALS and FTD
30.
Reproducibility of disease-specific modules across mouse models
and human disease. Further analysis of four independent datasets
from mouse models harboring pathological tau mutations,
includ-ing a replication dataset usinclud-ing the Tg4510 tau model (Methods and
Supplementary Fig. 5f), confirms the preservation of the NAI and
NAS modules (Supplementary Fig. 5e) and the expected changes
in gene expression early in the disease course (Supplementary
Fig. 5f–h,l). Comparison of the NAS and NAI modules in mice
harboring four different AD and FTD risk mutations (PS2APP,
CRND8, APP/PS1 and GRN; see Methods) was also performed
to assess to what extent these modules represent convergent
path-ways across models harboring different pathological proteins. The
NAS and NAI models are highly preserved and their disease
asso-ciations are maintained; both NAI and NAS module expression
changes occur with similar temporal profiles across each of these
models (Supplementary Fig. 5e,i–l).
Considering this cross-mouse model conservation, we next
assessed module preservation in human disease models and
post-mortem tissue samples to validate their human relevance (see
−0.3 −0.2 −0.1 0.0 0.1 −0.1 0.0 0.1 0.2 0.3 ME
NAS module gene ontology term enrichment
z-score
z-score
NAS module trajectory in cortex
NAI module gene ontology
term enrichment NAI module trajectory in cortex
ME
Signed correlation to transgenic
−1 0 1 2 3 Pink NAS (salmon) NAI (turquoise) 3 *** 2.4 *** 2.2 *** 3.8 *** 1.8 *** Magenta Cell-type enrichment mRNA ME relationships –1.0 –0.5 0.0 0.5 1.0 a b c d e Fold enrichment (*** FDR < 0.005) f g h P = 0.008 –0.2 –0.1 0.0 0.1 0.2 ME
NAS module trajectory in cerebellum
P = 0.39 P = 0.25 P = 0.055 −0.2 −0.1 0.0 0.1 0.2
NAI module trajectory in cerebellum
j
P = 0.33 P = 0.21 P = 0.09
ME
WT Tg
3 months 6 months3 months6 months3 months 6 months
C57/C57 DBA/C57 FVB/C57
WT Tg
3 months 6 months3 months6 months3 months6 months
C57/C57 DBA/C57 FVB/C57
3 months 6 months3 months6 months3 months 6 months
C57/C57 DBA/C57 FVB/C57
3 months6 months3 months6 months3 months 6 months
C57/C57 DBA/C57 FVB/C57 WT Tg WT Tg i Calmodulin binding Neuron projection development ATP metabolic process Voltage-gated cation channel activity Regulation of ion transport Homophilic cell adhesion PDZ domain binding Axon guidance 0 1 2 3 4 5 6 Cell cycle Regulation of establishment of protein localization Regulation of immune system process Transcription factor binding activity Regulation of binding Protein kinase activity Regulation of cell cycle Regulation of intracellular protein kinase cascade
0 1 2 3 4 5 6 NAS (salmon) NAI (turquoise) P = 0.004 P = 0.002 P = 0.002 P = 0.004 P = 0.002 NAS module Adra1b Bbox1 Csgalnact1 Dap3 E2f1 Elp2 Gas2l2 H1fx H2afx Nlgn1 Nop10 Nrgn Nucb2 Ogfod1 Paip1 Pak1ip1 Pcp4 Pfkm Rab2a Socs5 Stx6 Sub1 Syt4 Tpi1 Wdr35 Hspa12a Cul2 Dlg3 Atp2b1 Gabrb3 NAI module Adrb2 Akap12 Cep250 Cpsf4 Dhx16 Hnrnpm Malt1 Map3k3 Ncor2 Nfxl1 Pcyt1a Pim1 Pkp3 Plcg1 Plekho1 Rapgef1 Reep3 Sirt7 Snx9 Sox4 Ssrp1 Stx16 Tnip1 Ubap2 Xpo6 Cdk9 Fus Ewsr1 Cpsf1 Rb1 Endothelial Oligodendrocytes Microglia Astrocyte Neuron
Fig. 2 | mRNA consensus coexpression network analysis. a, Signed association (Pearson correlation) of the mRNA MEs with transgenic condition. Modules with positive values indicate increased expression in transgenic mice; modules with negative values indicate decreased expression in transgenic mice. The red dotted lines indicate Bonferroni-corrected P < 0.05 for multiple comparisons (n = 15 modules, n = 36 mice per region) using P values obtained from two-tailed test for Pearson correlation. b, Cell-type enrichment of modules (average n = 200 genes) using mouse genes in mRNA modules (Fisher’s two-tailed exact test, ***FDR < 0.005). c, Coexpression PPI network plot of the NAS module. The top 30 hub genes are indicated by name. The edges between nodes represent both gene coexpression and PPI, permitting us to focus on the hub genes observed at both the RNA and protein level. d, Gene ontology term enrichment of the NAS module using 794 NAS modules genes (permutation test z-score). e, Trajectory of the NAS ME in the cortex of TPR50 mice across different strains (unpaired two-sided Wilcox rank test; n = 6 mice per group). f, Coexpression PPI network plot of the NAI module. The top 30 hub genes are indicated by gene name. g, GO term enrichment of the NAI module using 1,833 NAI module genes. h, Trajectory of the NAI ME in the cortex of TPR50 mice across different strains (unpaired two-sided Wilcox rank test; n = 6 mice per group). i, Trajectory of the NAS module eigengene in the cerebellum of TPR50 mice across different strains (unpaired two-sided Wilcox rank test; n = 6 mice per group). j, Trajectory of the NAI module eigengene in the cerebellum of TPR50 mice across different strains (unpaired two-sided Wilcox rank test; n = 6 mice per group). In the boxplots in e and h–j, the upper and lower lines represent the 75th and 25th percentiles, respectively. The center line represents the median.
Human FTD, frontal cortex
P = 0.03 P = 0.002
Protein levels of module genes human FTD Human FTD, cerebellum P = 0.32 NAS ME NAS ME P = 1 × 10⁻⁴ P = 0.002 −0.4 −0.20.0 0.2 0.4 b d −2 0 2 COL6A2 CDC42EP4 BAG3 UTRN PGM2 CPT2 LRP1 HNRNPH1 S100B LMAN1 HEBP1 LLGL1 HNRNPA2B1 GSTP1 ZMPSTE24 LMNB1 HNRNPU SNRNP200 PGLS TPR ATPAF 1 PGP
EPM2AIP1CAMK4 NDUFS1 FBXO41 KCNA2SH3BGRL2
FSD1
PPME1 CISD1HPCACKMT1APLCB1 STXBP1NEFH ITPKA CAP2 PAK1RAB27B mRNA
Protein
NAS module genes NAI module genes
log 2 fold change c e Zsummary module preservation Module preservation in human FTD data TPR50 mRNA modules a 0.6 −0.20.0 0.2 0.4 −0.4 −0.2 0.0 0.2 0.4
Control Tau pos. Tau neg.
Control GRN pos. GRN neg. Control FTD tau pos.
FTD FTD 50 100 200 5001,000 2,000 −5 0 5 10 15 20 NAS NAI Mean scale d enrichment score 0 1 2 3 4 5 Control AD −0.15 0.15 Human AD, temporal cortex NAS ME −0.10 0.0 0.05 P < 2 × 10–16 P < 2 × 10–16 Human AD, frontal cortex P = 1.1 × 10⁻⁵ P = 1.6 × 10⁻⁵ Control AD −0.2 −0.1 0.0 0.1 Control AD Human AD, proteomics −0.2 0.0 0.2 Control PSP P = 2 × 10⁻⁵ PSP −0.2 −0.1 0.0 0.1 Control Pathologicalaging Pathological aging P = 0.77 −0.10 0.0 0.10 Control Schizophrenia Schizophrenia P = 0.59 NAINASBrownBlackGreen Magenta Tan Purple Light cyan Yellow
Green-yellowLight green Pink Midnight blue Grey 60 f p g h i k l
FTD GWAS (Ferrari et al. 2014) PSP GWAS (Hoglinger et al. 2011) AD GWAS (Lambert et al. 2013)
−0.3 −0.1 0.0 Control Bipolar disorder NAS ME P = 0.31 j m Bipolar disorder −0.2 0.0 0.2 NAI ME −0.6 0.0 0.6 NAI ME −0.4 −0.20.0 0.2 0.4 NAS ME NAI ME 0.0 −0.15 0.15 0.0 NAI ME −0.10 0.0 0.10 −0.2 0.0 0.2 −0.2 0.0 0.2 NAI ME −0.1 0.0 0.1 0.2 −0.10 0.0 0.10 −0.1 0.0 0.1 0.2 NAS ME NAI ME NAS ME NAI ME P = 1.2 × 10⁻⁴ P = 0.62 P = 0.55 P = 0.23 P = 1.4 × 10⁻⁵ P = 1.3 × 10⁻⁵ P = 0.43 P = 0.003 P = 0.03 P = 0.002 P = 0.001 NAS ME NAI ME NAS ME NAI ME NAS ME NAI ME Control MDD P = 0.69 MDD −0.2 0.0 0.2 −0.2 0.0 0.2 P = 0.76 NAS ME NAI ME FDR < 0.1 −0.2 0.2 0.6 −0.3
Control sporadicALS C9orf72-ALS
−0.1 0.1 0.3
R2= 0.92, P = 1.3 × 10–73
log2 fold change discovery set
log
2
fold change replication set
−2 −1 0 1 2 −2 −1 0 1 2 ALS NAS ME NAI ME P = 0.001 P = 0.003 P = 0.001 P = 1.1 × 10⁻⁴ n o
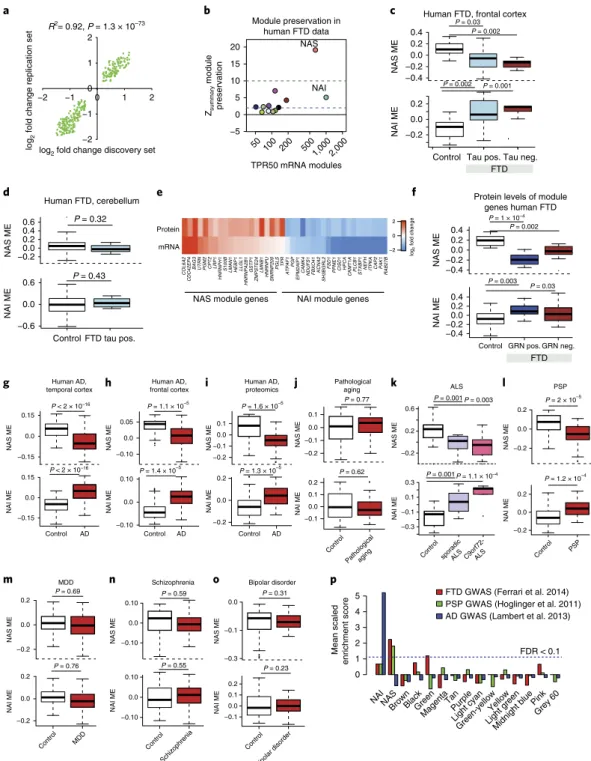
Fig. 3 | Transcriptomic and proteomic analyses in human FTD samples. a, Scatterplot showing Pearson correlation of subsampled discovery (control
n = 7, tau-positive FTD n = 5) and replication FTD (control n = 7, tau-positive FTD n = 5) datasets. The P values obtained from two-sided tests for Pearson correlation are shown. b, Module preservation in human FTD (cortex) using module definitions from strain-independent transgenic mouse network analysis. c,d, NAS and NAI ME expression in human FTD and control samples in the cortex (c, control n = 14, tau-positive FTD n = 10, tau-negative FTD
n = 6) and cerebellum (d, control n = 10, tau-positive FTD n = 7). Tau-positive FTD (FTD-tau pos.) and tau-negative FTD (FTD-tau neg.) are shown (unpaired two-sample Wilcoxon rank-sum test). e, log2 fold change of the top 20 NAS and NAI module genes at the mRNA and protein level. f, NAS and NAI ME in human FTD and control protein samples from the cortex. GRN-positive FTD (FTD GRN pos.) and GRN-negative FTD (FTD GRN neg.) are shown (unpaired two-sample Wilcoxon rank-sum test; control n = 8, GRN-Pos. n = 6, GRN-Neg. n = 10). g–o, NAS and NAI MEs in various neurological diseases: human AD temporal cortex (g, control n = 52, AD n = 52)44; human AD frontal cortex (h, control n = 308, AD n = 157)36; human AD frontal cortex
proteomics (i, control n = 15, AD n = 20)45; human pathological aging temporal cortex (j, control n = 70, pathological aging n = 30)44; human ALS frontal
cortex (k, control n = 9, C9orf ALS n = 8, Sporadic ALS n = 10)46; human PSP temporal cortex (l, control n = 73, PSP n = 83)44; human major depressive
disorder (MDD) (m, control n = 67, MDD n = 66)47; human schizophrenia (n, control n = 167, schizophrenia n = 131)48; and bipolar disorder (o, control
n = 65, bipolar disorder n = 40)48. Unpaired two-sample Wilcoxon rank-sum test. In all the boxplots, the upper and lower lines represent the 75th and 25th
percentiles, respectively. The center line represents the median. p, Mean scaled enrichment of GWAS hits (calculated P value < 0.05) from FTD GWAS49,
PSP GWAS50 and AD GWAS51 in various TPR50 modules (n = 15 modules). NAI module enrichment for AD risk genes was still significant after omitting
−1.0 −0.5 0.0 0.5 1.0
Signed correlation with transgenic
miRNA MEs miR−100−3p
miR−10a−5p miR−142−3p miR−142−5p miR−146a−5p miR−147−3p miR−155−5p miR−15a−3p miR−15b−3p miR−15b−5p miR−17−3p miR−17−5p miR−185−3p miR−18a−5p miR−1955−5p miR−203−3p miR−20a−5p miR−20b−5p miR−210−3p miR−215−5p miR−219a−5p miR−21a−3pmiR−21a−5p miR−222−5p miR−22−3p NAI NAS Pink miM12 miM16 Magenta miM13 miM15 PC 2 PC1 Signed-log 10 (FDR P value) −1 −0.5 0 0.5 1 a b c d 6.0 6.5 7.0 7.5
miR203 expression in cortex
P = 0.01 P = 0.002 miM16 miM12 Magenta Pink NAS NAI −5 0 5 10 2.4 *** ****** ********* *** *** *** *** 3.12.8 Biweighted midcorrelatio n −0.2 −0.1 0.0 0.1 0.2 0.3 ME
miM16 module trajectory in cortex
P = 0.01 P = 0.02 P = 0.002
f 3 months 6 months 3 months 6 months 3 months 6 months
C57/C57 DBA/C57 FVB/C57
3 months 6 months 3 months 6 months 3 months 6 months
C57/C57 DBA/C57 FVB/C57 log 2 expression WT Tg WT Tg miM13 miM15 e miR203 expression
Human FTD, frontal cortex Protein level of miR203 targetsHuman FTD
log 2 normalized expression 56 7 8 9 10 11 P = 0.003
Control Tau pos. Tau neg.
P = 2 × 10⁻⁴ P = 0.002 −0.4 −0.2 0.0 0.2 ME
Control GRN pos. GRN neg.
g h i 11 12 13 14 15 miR203 expression Human FTD, cerebellum
Control FTD tau pos.
P = 0.67 log 2 normalized expression FTD FTD P = 0.02 P = 0.03 miR−10a
miR−142−3pmiR−142−5pmiR−146amiR−15a/bmiR−155−5pmiR−17−5pmiR−93−5pmiR−185-5pmiR−20amiR−203−3pmiR−21amiR−210−3pmiR−215−5pmiR−219a
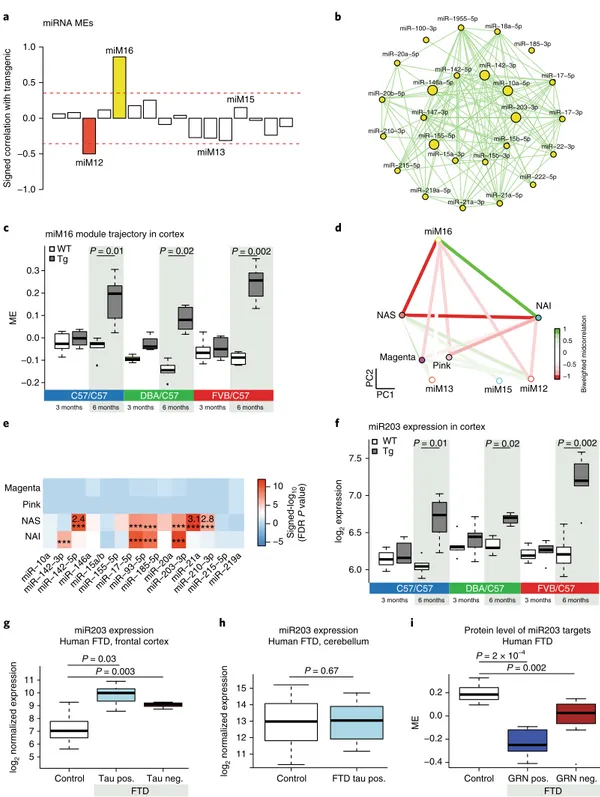
Fig. 4 | miRNA coexpression network analysis. a, Signed association (Pearson correlation) of the miRNA MEs with transgenic condition. Modules with positive values indicate increased expression in transgenic mice; modules with negative values indicate decreased expression in transgenic mice. The red dotted lines indicate Bonferroni-corrected P < 0.05 for multiple comparisons (n = 16 modules) using P values obtained from a two-sided test for Pearson correlation. b, miRNA coexpression network plot of the miM16 module showing hub miRNAs in the center. Large nodes indicate the top five hub miRNAs. c, Trajectory of the miM16 module in the cortex (unpaired two-sample Wilcoxon rank-sum test, n = 6 mice per group). d, Multidimensional scaling plot illustrating the correlations between the MEs of the mRNA and miRNA modules. The colors indicate biweighted midcorrelation (R) values. e, Enrichment of selected miM16 module miRNA predicted targets in the mRNA modules. All enrichment values (odds ratio (OR)) with FDR < 0.05 and OR > 2 are shown (Fisher’s two-sided exact test, ***FDR < 0.005). For a full list of enrichments, refer to Supplementary Fig. 6g. The TargetScan database was used for miRNA target prediction. f, Trajectory of log2 expression of miR-203 in the cortex (unpaired two-sample Wilcoxon rank-sum test; n = 6 mice per group). g,h, miR-203 expression in the cortex (g, control n = 14, tau-positive FTD n = 10, tau-negative FTD n = 6) and cerebellum (h, control n = 10, tau-positive FTD n = 7) of human FTD and control samples. Tau-positive FTD (FTD-tau pos.) and tau-negative FTD (FTD-tau neg.) are shown for the cortex (unpaired two-sample Wilcoxon rank-sum test). i, ME of predicted targets of miR-203 expression in human FTD and control protein samples in the cortex. Control
n = 8, FTD GRN pos. n = 6, FTD GRN neg. n = 10, GRN-positive FTD (FTD GRN pos.) and progranulin-negative FTD (FTD GRN neg.) are shown (unpaired two-sample Wilcoxon rank-sum test). In all the boxplots, the upper and lower lines represent the 75th and 25th percentiles, respectively, while the center line represents the median.
Methods, Supplementary Table 2a for list and characteristics of
all human datasets, and Supplementary Table 2b,c). The NAS and
NAI modules are dysregulated in the cortex of patients, but not
in the cerebellum, both in previously published microarray-based
data and in our newly generated RNA-seq dataset (Fig.
3a–d
and
Supplementary Fig. 5e,m,n) consisting of both positive and
tau-negative FTD (Fig.
3c
). Moreover, the NAS module and its disease–
trait relationship are preserved in induced pluripotent stem cell
(iPSC)-derived neurons from human FTD patients carrying GRN
mutations (Supplementary Fig. 5e,o).
We also performed mass spectrometry–based, label-free,
quan-titative proteomics in an independent set of GRN-positive and
GRN-negative FTD frontal cortex samples (Supplementary Fig. 5p,
Supplementary Table 2d and Methods). We found similar NAI and
NAS expression patterns at the mRNA and protein level (Fig.
3e
)
both in GRN-positive and GRN-negative FTD samples, compared
with age-matched controls (Fig.
3f
). Taken together, our analyses
show that the NAS and NAI coexpression modules are conserved
across multiple model systems and generalize from mouse to
human, reflecting convergent RNA coexpression and protein-level
changes in FTD.
Examination of RNA-seq and proteomic postmortem brain
dataset from patients with AD showed preservation of both the NAI
and the NAS modules at the mRNA (Fig. 3g,h, Supplementary Fig.
5e and Supplementary Table 4a) and protein (Fig.
3i
) level. Notably,
both modules are not dysregulated in cases of pathological aging
without dementia (P
= 0.77; Fig.
3j
), indicating that they are not
related to the presence of Aβ amyloid plaques alone
31. The NAS and
NAI modules are also dysregulated in C9orf72-related and sporadic
ALS (Fig.
3k
) and PSP (Fig.
3l
), but not in major depression (Fig.
3m
), schizophrenia (Fig.
3n
) or bipolar disorder (Fig.
3o
). These
results support the relevance and specificity of these changes to
allied human neurodegenerative syndromes, but not other
nonde-generative forms of neuropsychiatric disorders.
Assessment of genetic risk within modules. Transcriptomic
changes may be the cause or consequence of disease, so
integrat-ing these data with genetic risk data provides a means to further
understand their relationship to potential causal mechanisms
(for example, see refs
32,33). Several AD candidate genes, including
APOE, CLU, PICALM, C1q and TREM2 mapped to the NAI module
(Fig.
3p,
Methods and Supplementary Table 1i); in contrast to AD,
FTD and PSP, GWAS data showed significant enrichment in the
NAS module, which contains risk genes such as SLC32A1, NSF and
ELAVL2 (Fig. 3p
). These differential module enrichments indicate
that the genetic risk for AD, FTD and PSP likely operates via distinct
causal pathways that may converge on common downstream
neuro-nal and glial-immune processes.
Identification of potential miRNA drivers. Based on the strong
co-expression relationships observed in the NAS and NAI
mod-ules, we hypothesized potential coregulation by miRNA. We
identi-fied two miRNA modules associated with the transgenic condition
(Bonferroni-corrected P < 0.05; Fig.
4a
and Supplementary Table 3):
the miM12 module, which is anticorrelated, and the miM16
mod-ule (Fig.
4b
), which is positively correlated with the transgenic
condition in affected regions, but not the cerebellum (Fig.
4c
and
Supplementary Fig. 6a–e). The miM16 ME is strongly anticorrelated
with the NAS ME (Fig.
4d
and Supplementary Fig. 6f), and predicted
targets of miR-203, an miM16 hub, are highly enriched (Methods) in
the NAS module (Fig.
4e
and Supplementary Fig. 6g,h). Consistent
with its potential regulatory role, miR-203 is robustly
upregu-lated in Tg mice at 6 months in disease-affected areas (Fig.
4f
and
Supplementary Fig. 6i–k) and in the frontal cortex in both
tau-pos-itive and tau-negative FTD (Fig.
4g,h
). Protein levels of its targets
are also significantly decreased in both granulin-positive and
gran-ulin-negative FTD (P < 0.005; Fig.
4i
). These data across mouse and
humans suggested that miR-203 may be acting as a driver of the NAS
neurodegeneration-associated transcriptional program.
Fig. 5 | Overexpression of miR-203 in vitro and in vivo. a, Schematic of the lentiviral vector used for the in vitro studies. b,c, Trajectory of the miR-203 target genes (b) and NAS ME (c) in uninfected primary cortical cultures or cultures infected with either miR-203- or sc-miRNA-lentiviral construct (unpaired two-sample Wilcoxon rank-sum test; n = 4 per group). d, Representative images of TUNEL staining from three independent experiments in mouse primary cortical neurons overexpressing miR-203 or sc-miRNA (control) at DIV6, DIV8 and DIV10 days. Green, GFP (infection); red, TUNEL; blue, Hoechst. Scale bar, 25 μ m. e, Quantification of TUNEL staining. The percentage of TUNEL-positive cells in miR-203-overexpressing cultures were normalized at each time point to the average percent of TUNEL-positive cells in the sc-miRNA control (unpaired two-tailed t-test; n = 60 cells for DIV6,
n = 50 for DIV8 and n = 60 cells for DIV10). The center line represents the mean, and error bars show s.e.m. f, Normalized luminescence of luciferase reporter assay. Luciferase vectors containing 950 bp of the 3′ -UTR sequence of the Bcl2l2, Dgkb, Mapk10, Vsnl1 and Npepps genes were cotransfected with 20 nM miR-203 or control mimics in HEK 293T cells and assayed after 24–48 h (unpaired two-tailed t-test; n = 12 per group). The center line represents the mean, and error bars show s.e.m. g, Representative immunoblots from three independent experiments and quantification of BCL2L2 and VSNL1 protein levels from total cell lysates isolated from primary mouse cortical neurons overexpressing miR-203 or sc-miRNA (paired two-tailed t-test). The center line represents the mean, and error bars show s.e.m. Uncropped blots are shown in Supplementary Fig. 9. h, Schematic representation of experimental design and timeline to overexpress or inhibit miR-203 in C57BL/6 WT or Tg4510 tau transgenic mouse frontal cortex using the AAV2/9 system. i, NAS ME expression in GFP-positive cells overexpressing miR-203 or sc-miRNA at 3 or 6 weeks after AAV injection in C57BL/6 WT mice (unpaired two-sample Wilcoxon rank-sum test; n = 6 per group). j, Expression of genes involved in positive (GO:0043065) and negative (GO:0043066) regulation of apoptosis in GFP-positive cells overexpressing miR-203 or sc-miRNA at 3 and 6 weeks after AAV injection in C57BL/6 WT mice (unpaired two-sample Wilcoxon rank-sum test; n = 6 per group). k, The CASP-8 intensity of GFP-positive cells overexpressing miR-203 were normalized at each time point to the average CASP-8 intensity of GFP-positive cells overexpressing sc-miRNA control (unpaired two-tailed Mann–Whitney U-test; n = 464 cells for the 3-weeks control, n = 937 cells for the 3-weeks miR-203, n = 629 cells for the 6-weeks control, n = 1,441 cells for the 6-weeks miR-203; three independent biological replicates per condition). The center line represents the mean, the error bars show the s.e.m. l,m, ME of miR-203 targets (l) or NAS module (m) in GFP-positive cells overexpressing miR-203 6 weeks after AAV injection (unpaired two-sample Wilcoxon rank-sum test; n = 5 sc-miRNA-infected mice and n = 6 miR203-infected mice). n, The CASP-8 intensity of GFP-positive cells overexpressing miR-203 in Tg4510 tau transgenic mice was normalized at each time point to the average CASP-8 intensity of GFP-positive cells overexpressing the sc-miRNA control (unpaired two-tailed Mann–Whitney U-test; n = 507 cells for sc-miRNA and 2,793 cells for miR-203, 3 independent biological replicates per condition). The center line represents the mean, and the error bars show the s.e.m. o,p, ME of miR-203 targets (o) or NAS module (p) in GFP-positive cells overexpressing the sc-TuD control or miR-203 TuD 6 weeks after AAV injection in Tg4510 tau Tg mice (unpaired two-sample Wilcoxon rank-sum test; n = 5 sc-miRNA infected mice and n = 6 miR203 infected mice). In all the boxplots, the upper and lower lines represent the 75th and 25th percentiles, respectively, while the center line represents the median. q, The c-Fos intensity of GFP-positive cells expressing TuD-miR203 in Tg4510 tau transgenic mice was normalized at each time point to the average c-Fos intensity of GFP-positive cells expressing the sc-TuD control (unpaired two-tailed t-test; n = 50 images (control) and n = 60 images (miR203), n = 5 sc-miRNA-infected mice and n = 6 miR203-sc-miRNA-infected mice). The center line represents the mean, and the error bars show the s.e.m.
miR-203 regulates the neuronal mRNA module and causes cell
death. To test the predicted causal relationship between miR-203
expression and NAS module downregulation, we acutely
over-expressed miR-203 (Fig.
5a
) in primary cortical mouse neuronal
cultures (Methods and Supplementary Fig. 7a), observing
down-regulation of its predicted targets (Fig.
5b
) and the NAS module
more broadly (Fig.
5c
, Supplementary Fig. 7b and Supplementary
Table 4a). We also observed increased apoptosis (Fig.
5d
),
peak-ing at DIV8 (1.85-fold; Fig.
5e
), concurrent with peak NAS
mod-ule downregulation. We further experimentally validated several
predicted direct targets of miR-203 (Bcl2l2, Dgkb, Mapk10, Vsnl1)
by luciferase reporter assays (Fig.
5f
) and western blot (BCL2L2
and VSNL1; Fig.
5g
, see Supplementary Fig. 9 for uncropped blots).
To control for potential confounding by supraphysiological
overexpression in vitro, we moderately overexpressed miR-203
(approximately twofold; Methods) or a scrambled miRNA
con-trol (sc-miRNA) (Fig.
5h
) targeting neurons in WT mice in vivo
(Supplementary Fig. 7c–f). The NAS module is highly preserved
(Supplementary Fig. 7g and Supplementary Table 4a) and
down-regulated in neurons overexpressing miR-203 after 6 weeks (Fig.
5i
).
Strikingly, the level of miR-203 expression correlates remarkably
well with the downregulation of both miR-203 predicted targets
(R
2= 0.81, slope = − 2.3; Supplementary Fig. 7h) and NAS module
genes (R
2= 0.81, slope = − 2.2; Supplementary Fig. 7i). Furthermore,
apoptotic pathways are altered in miR-203-overexpressing neurons
(Fig.
5j
and Supplementary Table 4b), confirmed by caspase-8
a
CMV promoter miR-203 or sc-miRNA EF1 promoter GFP
e
c
sc-miRNA miR-203 sc-miRNA miR-203 sc-miRNA miR-203
DIV6 DIV8 DIV10
TUNEL GFP Hoechst sc-miRNA miR-203 0 1 2 3 4 Normalized % of TUNEL + cells g f β-actin β-actin VSNL1 BCL2L2 Bcl2l2 Dgkb Mapk10 Vsnl1 Npepps
(control) DIV6 DIV8
0 0.5 1.0 1.5
Normalized protein leve
l
0.5 0 1.0 1.5
DIV6 DIV8 DIV6 DIV8 203 203 203 203 P = 7.4 × 10⁻⁴ P = 4.9 × 10⁻⁶ P = 7.8 × 10⁻³ P = 1.2 × 10⁻⁴ 24 h 48 h sc-miRNA miR-203 sc sc sc sc d NAS ME Uninfected sc-miRNA miR-203 −0.3 −0.1 0.1 0.3 −0.3 −0.1 0.1 0.3 DIV10
DIV6 DIV8 DIV10
miR-203 targets
ME
DIV6 DIV8 DIV10
b
h i
ITRSynapsinpromoter GFP PolyA
AAV2/9 construct WT FACS RNA-seq Tissue fixation IHC miR-203 or
control Synapsinpromoter ITR
3 weeks 6 weeks NAS ME sc-miRNA miR-203 –0.4 –0.2 0.0 0.2 ITR GFP PolyA OR miR-203 TuD or control ITR WT WT Tg4510 Tg4510 Tg4510 Tissue dissociation 0 6 12 18 weeks Fig. 5i–k, Fig. S8a–h Fig. 5l–n, Fig. S8i–n Supplementary Fig. 9a,b,e–j Fig. 5o–q Supplementary Fig. 9c,d,k–m Uninfected sc-miRNA miR-203 Normalized luminiscence P = 0.02 P = 0.008 P = 7.5 × 10⁻⁵ P = 2.8 × 10⁻⁵ P = 1.2 × 10⁻⁴ P = 2.3× 10⁻³ P = 0.02
DIV6 DIV8 DIV10
DIV6 DIV8
0.5 1.0 1.5
Normalized protein level
sc-miRNA miR-203 P = 0.0012 P = 0.005 P = 3.3 × 10⁻⁹ P = 4.7 × 10⁻⁷ P = 9.4 25 kDa 20 kDa × 10–4 P = 8.9 × 10⁻⁶ P = 8.9 × 10⁻⁴ P = 1.5 × 10⁻⁹ P = 0.2 P = 0.7 P = 1 × 10–4 × 10P = 2–4 × 10P = 1–4 Synapsin
promoter Synapsinpromoter
Positive regulators of apoptosis Negative regulators of apoptosis k m
j l 0 sc-miRNA miR-203 2 4 6 8 n
Normalized CASP-8 intensit
y
3 weeks 6 weeks 3 weeks 6 weeks 3 weeks 6 weeks
sc-miRNA miR-203
sc-miRNA
miR-203 sc-miRNA
miR-203 sc-miRNAmiR-203
sc-miRNA miR-203 NAS ME −0.4 −0.2 0.0 0.2 0.4 ME −0.4 −0.2 0.0 0.2 0.4 Targets of miR-203
Normalized CASP-8 intensit
y ME ME P = 0.02 P = 2.1 × 10⁻⁵ P = 1.2 × 10⁻⁴ P = 0.01 P = 3.3 × 10⁻⁶ −0.4 −0.2 0.0 0.2 0.4 −0.4 −0.2 0.0 0.2 sc-TuD miR-203 TuD
Normalized c-Fos intensit
y 0.0 0.5 1.0 1.5 2.0 2.5 q *P < 0.05 −0.4 −0.2 0.0 0.2 0.4 NAS ME sc-TuD miR-203 TuD Targets of miR-203 sc-TuD miR-203 TuD **P < 0.01 −0.4 −0.2 0.0 0.2 0.4 ME p o P = 2.1 × 10⁻¹⁹ 0 5 10 15 P = 1.7 × 10⁻⁶ P = 2.9 × 10⁻⁵
Normalized % TUNE L + nuclei DMSO 1 µM 2.5 µM 0 1 2 3 4 Normalized % TUNEL + nucle i 0 1 2 3 4 sc-miRNA miR-203 NAS ME P = 0.37 Control iPSC Tau iPSC NAS ME P = 0.004 P = 0.02 P = 0.03 Scriptaid DMSO 0.5 µM 1 µM SAHA DMSO 0.5 µM 1 µM
SAHA DMSO 0.5 µM SAHA1 µM 2.5 µM
0.2 −0.2 0.0 0.0 –0.2 0.1 0.2 sc-miRNA miR-203 sc-miRNA miR-203 Scriptaid Lhx2 Gprc5b Ppp2cb Fsd1 Pkd2l2 Ptgis Vip Pde7b Micu1 Rgs9 Sec23a Gabrb3 Aldh6a1 Eovl2l Hapln1 Thrb Ephx2 Gpc5 Ttc33 Atp6v1c1 Sqle Ttll1 Nell2 Wnt1 Pja2 Grm8 Rab40b Cnksr2 Stk16 Kifap3 Hnmt Itpka Mapk10 Eif2ak1 Kat2b Rpl13 Tcf7 Scin Smarcc2 Mcm2 Ulk2 Ripk4 Mprip Rsl1d1 Cdt1 Leprel4 Cdk9 Pibp1f Srsf6 Med24 Ddx27 Sept8 Wwc1 Prmt2 Syt1
Upregulated with scriptaid Downregulated with scriptaid Coexpressed
NAS module NAI module
1 µM scriptaid 2.5 µM scriptaid
sc-miRNA miR-203 sc-miRNA miR-203 sc-miRNA miR-203 DMSO merge TUNEL a b e f g c d P = 4.2 × 10⁻⁷ P = 2.6 × 10⁻⁵ P = 1.1 × 10−42.2 × 10P =−4 P = 2.2 × 10⁻⁵ P = 3.2 × 10⁻⁴ P = 1.3 × 10⁻⁷ P = 5.2 × 10⁻⁶ P = 0.0019 P = 2.4 × 10⁻⁷ P = 0.415 P = 0.006 P = 0.016 0.5 µM SAHA 1 µM SAHA sc-miRNA miR-203 sc-miRNA miR-203 sc-miRNA miR-203
DMSO
merge
TUNEL
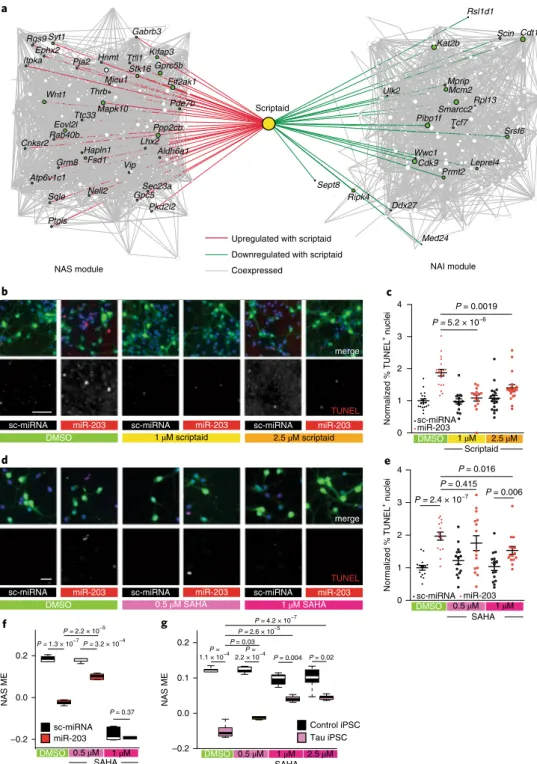
Fig. 6 | Small-molecule inhibition of miR-203-induced cell death in vitro. a, Coexpression-based network plot of scriptaid targets from the CMAP database with genes in the NAS and NAI modules. Genes that are upregulated with scriptaid treatment are connected by red edges; those that are downregulated are connected by green edges. Node size represents centrality within the network. b, Representative images from three independent experiments of TUNEL staining in mouse primary cortical neurons overexpressing miR-203 or sc-miRNA (control) at DIV7 treated with DMSO control and 1 µ M or 2.5 µ M scriptaid or DMSO control for 24 h prior. Green, GFP; red, TUNEL; blue, Hoechst. Scale bar, 25 mm. c, Quantification of TUNEL-positive cells treated with scriptaid in three independent experiments (unpaired two-tailed t-test; n = 20 per group). Scriptaid treatment does not alter miR-203 overexpression levels (Supplementary Fig. 9), indicating that the decrease in cell death is not a result of changes in viral infection, miRNA processing or regulation of miR-203 by scriptaid. The center line represents the mean, and error bars show s.e.m. d, Representative images from three independent experiments of TUNEL staining in mouse primary cortical neurons overexpressing miR-203 or sc-miRNA (control) at DIV7 treated with DMSO control and 0.5 µ M or 1 µ M SAHA for 24 h prior. Green, GFP; red, TUNEL; blue, Hoechst. Scale bar, 25 mm. e, Quantification of TUNEL positive cells from three independent experiments treated with SAHA (unpaired two-tailed t-test; n = 15 per group). The center line represents the mean and error bars showing s.e.m. f, Trajectory of the NAS ME in cultures infected with either the miR-203- or sc-miRNA-lentiviral construct treated with either DMSO control or 0.5 µ M or 1 µ M SAHA (unpaired two-tailed Wilcox rank test; n = 6 per group). g, Trajectory of the NAS ME in human iPSC-derived neurons from control and A152T Tau patients treated with either DMSO control or 0.5 µ M, 1 µ M or 2.5 µ M SAHA (unpaired two-tailed Wilcox rank test; n = 6 per group). In all the boxplots, the upper and lower lines represent the 75th and 25th percentiles, respectively, while the center line represents the median.
(CASP-8) protein expression (Fig.
5k
and Supplementary Fig. 7j).
Additionally, miR-203 overexpression in 1-month-old Tg4510 tau
transgenic cortex (Supplementary Fig. 8a,b) causes downregulation
of predicted miR-203 targets (Fig. 5l), the NAS module (Fig. 5m),
genes involved in calcium signaling and neuroactive ligand
recep-tors (Supplementary Fig. 8e,f) and a significant increase in CASP-8
protein (Fig. 5n) and apoptotic pathways (Supplementary Fig. 8c,d).
To further investigate the causal role of miR-203, we
inhib-ited miR-203 expression in neurons using a ‘Tough Decoy’ (TuD)
adeno-associated virus (AAV) system
34in vivo in Tg4510 mice
(Fig.
5h
). Both short-term (6 weeks; Supplementary Fig. 8g,h) and
longer-term (4 months; Supplementary Fig. 8i,j) inhibition of
miR-203 oppose the pathological transcriptional changes in predicted
miR-203 targets (Fig. 5o and Supplementary Fig. 8k) and the NAS
module broadly (Fig. 5p and Supplementary Fig. 8l), including
genes involved in calcium signaling and neuroactive ligand
recep-tor pathways (Supplementary Fig. 8m,n), and apoptosis (Fig.
5q
and Supplementary Fig. 8o,p). Reducing miR-203 did not affect
phospho-tau immunostaining (Supplementary Fig. 8q,r), which is
consistent with its acting downstream of tau pathology. Previous
work has shown that 5-month-old Tg4510 mice show reduced
neo-cortical network activity based on proto-oncogene c-Fos
immu-noreactivity
35. C-Fos intensity was also significantly increased in
mutant neurons expressing the miR-203 TuD construct, compared
to those expressing the control construct (P < 0.0001; Fig.
5q
and
Supplementary Fig. 8s), suggesting functional rescue. These
find-ings demonstrate that inhibition of miR-203 can reverse the
expres-sion patterns of both the NAS module and apoptotic pathway genes
associated with disease state in vivo, while overexpression of
miR-203 promotes downregulation of the NAS module and a
neurode-generative phenotype.
Pharmacological manipulation of NAS module genes. We
rea-soned that if the patterns of gene expression robustly associated with
disease state across mice and humans represented causal
phenom-ena, as suggested by GWAS enrichment, then their reversal should
ameliorate the miR-203-mediated cell death phenotype. To test this,
we screened the Connectivity Map (CMAP), a public compendium
of cell line gene expression responses to drugs, to identify small
mol-ecules predicted to reverse the NAS or NAI module changes observed
across pathological conditions, albeit in nonneuronal cells. Four of
the top ten hits were histone deacetylase inhibitors (Supplementary
Table 4c), which was significant (permutated P
< 1 × 10
−5).
We chose two of the predicted molecules, scriptaid, which was the
top hit in CMAP (enrichment score = − 0.969; Fig.
6a
) and
suberanilo-hydroxamic acid (SAHA) (vorinostat; enrichment score
= − 0.846),
which is undergoing human clinical trials (
NCT03056495
). As
predicted, adding scriptaid to miR-203-overexpressing neurons
decreased the neuronal death caused by miR-203 overexpression to
levels equivalent to controls (unpaired t-test; Fig.
6b,c
). We also
found that 0.5
μ M SAHA decreased miR-203-induced cell death
(Fig.
6d,e
). SAHA upregulated NAS module genes (Fig.
6f
); however,
SAHA showed toxicity at 1
μ M even in control neurons (Fig.
6f
).
Next, we treated human iPSC-derived neurons from controls and
patients with FTD with SAHA, observing that SAHA
upregu-lates NAS module genes in a dose-dependent manner (Fig.
6g
).
Therefore, we conclude that miR-203 directly regulates many NAS
module hub genes and that the histone deacetylase inhibitors,
scrip-taid and SAHA, by targeting the NAS and NAI module genes and
normalizing their expression, can ameliorate miR-203-induced
pro-neurodegenerative changes.
Discussion
The mechanisms underlying neurodegenerative diseases are still
poorly understood, a factor that impedes the design of
therapeu-tic interventions to treat these disorders. Rather than focusing on
a priori candidate genes, we pursued a systematic, genome-wide,
functional genomics approach. Such studies have not been realized
in the study of most neurodegenerative diseases, with a few notable
exceptions
36–38. By taking genetic background into consideration,
representing diverse causal mutations in transcriptomic network
analyses and validation in a dozen independent datasets, we
iden-tify disease-relevant gene networks representing specific molecular
pathways. It is noteworthy that modules identified in the initial
individual F1 crosses that are not conserved and dysregulated across
all three strains are also not conserved in other mouse models or the
human brain (Supplementary Fig. 10a–c), supporting the approach
we have taken.
In functional genomic studies, each experimental system on its
own, whether in vitro systems, in vivo mouse models or postmortem
human tissue, has significant limitations
39. In this study, we show
how a multistage systems biology analysis coupled with substantial
in vitro experimental validation provides a framework for discovery
of new disease mechanisms and therapeutic targets. We leverage the
benefits of animal models of human disease, which permit the
tem-poral assessment of changes before substantial atrophy and cell loss
while mitigating the potential bias introduced by a single genetic
background. We also consider the principles of regional
vulnerabil-ity and disease trajectories
12,40and find that gene networks
associ-ated with transgenic status are altered in brain areas that show signs
of neurodegeneration. Conversely, in the cerebellum, a brain region
that is spared in AD and FTD, the expression of the NAS and NAI
modules, as well as miR-203, does not change significantly.
A key issue in any analysis of gene expression in disease is that
changes in gene expression may be either a cause or consequence
of the disorder. To advance our work toward identifying causal
drivers, we experimentally validate a putative miRNA driver of the
altered transcriptional networks, miR-203, which has previously
not been implicated in neurodegeneration, and we show reversal by
gene-network-predicted pharmacological regulators. We also find
significant enrichment of common genetic risk for both FTD and
PSP in the neuronal NAS module and enrichment for AD GWAS
signals in the NAI module, which is enriched in glial and immune
genes. These data further support the potential causal role of these
modules and suggest different causal pathways in AD versus FTD
and PSP, the latter of which are considered primary tauopathies
3,4It is important to note that both expression changes in the
dis-ease-associated gene modules NAS and NAI, as well as the
upregu-lation of miR-203, though clearly a point of convergence, are most
likely downstream of initial pathological insults, whether caused by
tau or other major risk genes. From this perspective, these
mod-ules represent robust, highly conserved biological processes that
provide a crucial link in the chain between an initial causal genetic
insult and neuronal death and inflammation. As we show,
long-term inhibition of miR-203 in the Tg4510 model, while
upregulat-ing antiapoptotic pathways, downregulatupregulat-ing proapoptotic pathways
and increasing neuronal activity as measured by c-Fos activation,
does not reduce the phospho-tau burden (Supplementary Fig. 8q,r).
Though pharmacologically targeting these gene networks, or
miR-203 itself, may not reverse tau aggregation or Aβ plaque formation,
it may provide a means to uncouple dysfunction of
aggregation-prone proteins from inflammation, neurodegeneration and their
behavioral outcome—dementia. Supporting this possibility is the
fact that neither the NAS nor the NAI modules are dysregulated in
patients that show pathological aging, in which significant amyloid
plaque density, but no dementia, is observed. Therefore,
develop-ing therapies that reverse the changes in the disease-associated gene
coexpression modules may be an opportunity to impede
neuro-degeneration across a broad spectrum of dementias without
hav-ing to target unique upstream pathological events. Moreover, we
hypothesize that regulators of these highly conserved
transcrip-tional programs, such as miR-203, may be new therapeutic targets.
Efforts to target miRNAs to treat diseases are already underway
41and traditional antisense oligo-based targets have reached clinical
trials
42, while small-molecule modulators represent a new frontier
in miRNA-based therapeutics
43. In this regard, identifying
regula-tors of the NAI module is also likely to be a fertile avenue for future
studies aimed at therapeutic development
44.
URLs. miRbase,
http://www.mirbase.org/
; TargetScan database,
http://www.targetscan.org/vert_72/
; CMP database,
https://portals.
broadinstitute.org/cmap/
.
Online content
Any methods, additional references, Nature Research reporting
summaries, source data, statements of data availability and
asso-ciated accession codes are available at
https://doi.org/10.1038/
s41591-018-0223-3
.
Received: 20 November 2017; Accepted: 18 September 2018;
Published: xx xx xxxx
References
1. Hinz, F. I. & Geschwind, D. H. Molecular genetics of neurodegenerative dementias. Cold Spring Harb. Perspect. Biol. 9, a023705 (2017).
2. Iqbal, K., Liu, F. & Gong, C. X. Tau and neurodegenerative disease: the story so far. Nat. Rev. Neurol. 12, 15–27 (2016).
3. Masters, C. L. et al. Alzheimer’s disease. Nat. Rev. Dis. Primers 1, 15056 (2015). 4. Kovacs, G. G. Invited review: neuropathology of tauopathies: principles and
practice. Neuropathol. Appl. Neurobiol. 41, 3–23 (2015).
5. Mullane, K. & Williams, M. Alzheimer’s therapeutics: continued clinical failures question the validity of the amyloid hypothesis—but what lies beyond? Biochem. Pharmacol. 85, 289–305 (2013).
6. Institute of Medicine. Improving the Utility and Translation of Animal Models for Nervous System Disorders: Workshop Summary (The National Academies Press, Washington DC, 2013).
7. Miller, J. A., Horvath, S. & Geschwind, D. H. Divergence of human and mouse brain transcriptome highlights Alzheimer disease pathways. Proc. Natl. Acad. Sci. USA 107, 12698–12703 (2010).
8. Qosa, H. & Kaddoumi, A. Effect of mouse strain as a background for Alzheimer’s disease models on the clearance of amyloid-β . J. Syst. Integr. Neurosci. 2, 135–140 (2016).
9. Weitzner, D. S., Engler-Chiurazzi, E. B., Kotilinek, L. A., Ashe, K. H. & Reed, M. N. Morris Water Maze Test: optimization for mouse strain and testing environment. J. Vis. Exp. e52706 (2015).
10. LaFerla, F. M. & Green, K. N. Animal models of Alzheimer disease. Cold Spring Harb. Perspect. Med. 2, a0066320 (2012).
11. Webster, S. J., Bachstetter, A. D., Nelson, P. T., Schmitt, F. A. & Van Eldik, L. J. Using mice to model Alzheimer’s dementia: an overview of the clinical disease and the preclinical behavioral changes in 10 mouse models. Front. Genet. 5, 88 (2014).
12. Karsten, S. L. et al. A genomic screen for modifiers of tauopathy identifies puromycin-sensitive aminopeptidase as an inhibitor of tau-induced neurodegeneration. Neuron 51, 549–560 (2006).
13. Onishi, T. et al. Early-onset cognitive deficits and axonal transport dysfunction in P301S mutant tau transgenic mice. Neurosci. Res. 80, 76–85 (2014).
14. Yoshiyama, Y. et al. Synapse loss and microglial activation precede tangles in a P301S tauopathy mouse model. Neuron 53, 337–351 (2007).
15. Zhang, B. & Horvath, S. A general framework for weighted gene co-expression network analysis. Stat. Appl. Genet. Mol. Biol. 4, Article17 (2005). 16. Langfelder, P. & Horvath, S. WGCNA: an R package for weighted correlation
network analysis. BMC Bioinformatics 9, 559 (2008).
17. Spillantini, M. G. & Goedert, M. Tau protein pathology in neurodegenerative diseases. Trends Neurosci. 21, 428–433 (1998).
18. Braak, H. & Braak, E. Neuropathological stageing of Alzheimer-related changes. Acta Neuropathol. 82, 239–259 (1991).
19. Kuhn, A., Thu, D., Waldvogel, H. J., Faull, R. L. M. & Luthi-Carter, R. Population-specific expression analysis (PSEA) reveals molecular changes in diseased brain. Nat. Methods 8, 945–947 (2011).
20. Miller, J. A., Woltjer, R. L., Goodenbour, J. M., Horvath, S. & Geschwind, D. H. Genes and pathways underlying regional and cell type changes in Alzheimer’s disease. Genome Med. 5, 48 (2013).
21. Lage, K. et al. A human phenome–interactome network of protein complexes implicated in geneticdisorders.Nat. Biotechnol. 25, 309–316 (2007).
22. Stark, C. et al. BioGRID: a general repository for interaction datasets. Nucleic Acids Res. 34, D535–D539 (2006).
23. Parikshak, N. N. et al. Integrative functional genomic analyses implicate specific molecular pathways and circuits in autism. Cell 155, 1008–1021 (2013).
24. Parikshak, N. N., Gandal, M. J. & Geschwind, D. H. Systems biology and gene networks in neurodevelopmental and neurodegenerative disorders. Nat. Rev. Genet. 16, 441–458 (2015).
25. Murray, R. Z., Wylie, F. G., Khromykh, T., Hume, D. A. & Stow, J. L. Syntaxin 6 and Vti1b form a novel SNARE complex, which is up-regulated in activated macrophages to facilitate exocytosis of tumor necrosis Factor-alpha. J. Biol. Chem. 280, 10478–10483 (2005).
26. Gjørlund, M. D. et al. Neuroligin-1 induces neurite outgrowth through interaction with neurexin-1β and activation of fibroblast growth factor receptor-1. FASEB J. 26, 4174–4186 (2012).
27. Huang, K. P. et al. Neurogranin/RC3 enhances long-term potentiation and learning by promoting calcium-mediated signaling. J. Neurosci. 24, 10660–10669 (2004).
28. Jaworski, M. et al. Malt1 protease inactivation efficiently dampens immune responses but causes spontaneous autoimmunity. EMBO J. 33, 2765–2781 (2014).
29. Lessard, C. J. et al. Variants at multiple loci implicated in both innate and adaptive immune responses are associated with Sjögren’s syndrome. Nat. Genet. 45, 1284–1292 (2013).
30. Ng, A. S. L., Rademakers, R. & Miller, B. L. Frontotemporal dementia: a bridge between dementia and neuromuscular disease. Ann. N. Y. Acad. Sci. 1338, 71–93 (2015).
31. Maeda, S. et al. Expression of A152T human tau causes age-dependent neuronal dysfunction and loss in transgenic mice. EMBO Rep. 17, 530–551 (2016).
32. Parikshak, N. N. et al. Genome-wide changes in lncRNA, splicing, and regional gene expression patterns in autism. Nature 540, 423–427 (2016). 33. Gandal, M. J. et al. Shared molecular neuropathology across major psychiatric
disorders parallels polygenic overlap. Science 359, 693–697 (2018). 34. Xie, J. et al. Long-term, efficient inhibition of microRNA function in mice
using rAAV vectors. Nat. Methods 9, 403–409 (2012).
35. Menkes-Caspi, N. et al. Pathological tau disrupts ongoing network activity. Neuron 85, 959–966 (2015).
36. Zhang, B. et al. Integrated systems approach identifies genetic nodes and networks in late-onset Alzheimer’s disease. Cell 153, 707–720 (2013). 37. Jones, L. et al. Convergent genetic and expression data implicate immunity in
Alzheimer’s disease. Alzheimers Dement. 11, 658–671 (2015). 38. Narayanan, M. et al. Common dysregulation network in the human
prefrontal cortex underlies two neurodegenerative diseases. Mol. Syst. Biol. 10, 743 (2014).
39. Dolmetsch, R. & Geschwind, D. H. The human brain in a dish: the promise of iPSC-derived neurons. Cell 145, 831–834 (2011).
40. Hardy, J. Catastrophic cliffs: a partial suggestion for selective vulnerability in neurodegenerative diseases. Biochem. Soc. Trans. 44, 659–661 (2016). 41. Gupta, S., Verma, S., Mantri, S., Berman, N. E. & Sandhir, R. Targeting
microRNAs in prevention and treatment of neurodegenerative disorders. Drug Dev. Res. 76, 397–418 (2015).
42. Janssen, H. L. A. et al. Treatment of HCV infection by targeting microRNA. N. Engl. J. Med. 368, 1685–1694 (2013).
43. Young, D. D., Connelly, C. M., Grohmann, C. & Deiters, A. Small molecule modifiers of microRNA miR-122 function for the treatment of hepatitis C virus infection and hepatocellular carcinoma. J. Am. Chem. Soc. 132, 7976–7981 (2010).
44. Allen, M. et al. Human whole genome genotype and transcriptome data for Alzheimer’s and other neurodegenerative diseases. Sci. Data 3, 160089 (2016). 45. Seyfried, N. T. et al. A multi-network approach identifies protein-specific
co-expression in asymptomatic and symptomatic Alzheimer’s disease. Cell Syst. 4, 60–72.e4 (2017).
46. Prudencio, M. et al. Distinct brain transcriptome profiles in C9orf72-associated and sporadic ALS. Nat. Neurosci. 18, 1175–1182 (2015). 47. Chang, L.-C. et al. A conserved BDNF, glutamate- and GABA-enriched
gene module related to human depression identified by coexpression meta-analysis and DNA variant genome-wide association studies. PLoS ONE 9, e90980 (2014).
48. Fromer, M. et al. Gene expression elucidates functional impact of polygenic risk for schizophrenia. Nat. Neurosci. 19, 1442–1453 (2016).
49. Ferrari, R. et al. Frontotemporal dementia and its subtypes: a genome-wide association study. Lancet Neurol. 13, 686–699 (2014).
50. Höglinger, G. U. et al. Identification of common variants influencing risk of the tauopathy progressive supranuclear palsy. Nat. Genet. 43, 699–705 (2011). 51. Lambert, J.-C. et al. Meta-analysis of 74,046 individuals identifies 11 new
susceptibility loci for Alzheimer's disease. Nat. Genet. 45, 1452–1458 (2013).
Acknowledgements
Funding for this work was provided by Takeda Pharmaceuticals (D.H.G.), Rainwater Charitable Foundation/Tau consortium (D.H.G., S.J.H.), NIH grants to D.H.G., S.J.H.,