Article
Technology and Occupations in Business Cycles
Valeria Cirillo1,*, Mario Pianta2and Leopoldo Nascia3
1 INAPP Rome and Institute of Economics, Scuola Superiore Sant’Anna, 56127 Pisa, Italy
2 Dipartimento di Giurisprudenza, Università Roma Tre, 00154 Rome, Italy; [email protected] 3 Istituto Nazionale di Statistica (ISTAT), 00184 Rome, Italy; [email protected]
* Correspondence: [email protected]
Received: 24 January 2018; Accepted: 30 January 2018; Published: 9 February 2018
Abstract: Building on studies on the impact of the Great Recession on the occupational and skill structure of employment, this article investigates developments over the last business cycle (2002–2007 and 2007–2011) in 36 manufacturing and service industries of five major European countries (Germany, France, Spain, Italy and United Kingdom). We analyse how technology, education and wages have shaped the evolution of four professional groups—Managers, Clerks, Craft and Manual workers—defined on the basis of ISCO classes. During the upswing in manufacturing industries all professional groups except managers have experienced job losses, while new jobs in services have followed a pattern of growing occupational polarization. Demand growth has a general positive effect across all occupations; new products lead to job creation in the group of managers only; wage increases slow down job creation except in the lowest occupational group. During the downswing, large job losses are concentrated in the lowest occupations and most relationships—including the role of demand and wages—break down; product innovation loses its positive impact on jobs while new processes drive restructuring and job destruction across all professional groups.
Keywords:occupations; innovation; technology; business cycles
1. Introduction
The crisis started in 2008 and the long recession of European countries has led to important changes in the employment structure. The long-term process of structural change from manufacturing to service industries has accelerated; the employment structure is becoming more polarized, with job creation concentrated at the top and the bottom of the occupational range in services; technology’s impact on skills and occupations is becoming more complex than previously anticipated [1,2]. Moreover, such developments are the result of a break with the relationships that shaped the evolution of the occupational structure in times of economic expansion, pointing to the need for a deeper investigation on how the business cycle influences the dynamics of skills and occupations. This article improves on current research in the following three directions.
First, we investigate the occupational structure of employment considering four major professional groups—Managers, Clerks, Craft and Manual workers—based on the International Standard Classification of Occupations (ISCO). These groups offer an appropriate representation of the nature of occupations focusing on the hierarchy of business functions, workers’ levels of education and competences and average annual compensation. This allows to move beyond classifications based on high vs. low skills; high vs. low education. The ISCO classification has been widely adopted in the empirical literature to study employment dynamics by skill (among others, see [3–5]). As argued by [3], the crude distinction between “unskilled” and “skilled” labour underestimates the variety of employment patterns related to skills. Compared to recent literature considering the evolution of employment in relation to the task content of jobs [6,7], we analyse the absolute change of occupations
in relation to sectoral dynamics such as main technological trajectories and structural features—demand and labour compensation.
Second, we introduce a more detailed investigation of technology, with the distinction between product and process innovation and between firms’ strategies that search for technological competitiveness or for cost competitiveness [8]. The former are associated with the presence of higher skills, the introduction of new products and the search for new markets. Conversely, cost competitiveness strategies are less skill demanding as they focus on mechanization and restructuring processes, with a direct labour-saving impact. While these strategies generally coexist in firms, at the industry level it is possible to identify the dominant technological pattern and its impact on productivity and employment growth. This analysis allows us to move beyond the approach—typical of current literature—that expects technology (and ICTs) to have a uniform impact on all firms, industries and economies.
Third, we show that the evolution of occupations is not independent from the business cycles. After identifying the main drivers of the long term dynamics of occupations—technology, demand, education and wages—we investigate separately the determinants of occupational changes in each professional group during the 2002–2007 upswing and the 2007–2011 downswing of the last business cycle. A study of the drivers of employment change should include an investigation of offshoring dynamics, disentangling the long term effect of domestic and foreign demand; this has been carried out in the studies of the determinants of employment by occupations in [9,10]. The focus of this article is on short term dynamics over the business cycle, where these factors are less relevant. Our results—similarly to a recent literature [11,12], find that standard relationships are disrupted during downswings.
The rest of the paper is organized as follows. In the next section, we revise recent contributions from the literature, Section3introduces the dataset and describes the evolution of skills in Europe focusing on professional groups and the effects of cycles. In Section4we present the econometric strategy used in the empirical investigation. Section5presents the main results; Section6concludes. 2. The State of the Art
Job dynamics have been investigated under different approaches, exploring absolute changes in jobs and the relative composition of skills. Among the main drivers of job changes, a large literature has addressed the role played by technology in reshaping the quantity and quality of jobs. In terms of absolute change in jobs, the relationship between product and process innovation and employment has been analysed at the firm, sectoral and country level (for reviews see [13]). Focusing on the quality of jobs, different approaches have documented how innovation contributes to shape employment dynamics in terms of skills, occupations and more recently tasks.
The Skill Biased Technological Change (SBTC) approach has pointed out the complementarity between new technologies and skills, predicting an increasing share of skilled workers [14–18] in both high income and middle/low income countries [19–22]. A similar effect has been related to the diffusion of new organisational practices within firms leading to an increasing demand for skilled workers [23–26].
More recently, the Routine Biased Technological Change (RBTC) approach has provided a novel technology-based explanation of employment changes focusing on tasks in terms of routinization of jobs [7,27–32] mainly to explain the empirical evidence of polarisation both in terms of wages and employment (Ref. [33] find evidence for increasing polarisation for Germany; Machin for UK [34]; Ref. [35] for Portugal; both [36,37] for Europe. Different explanations have been proposed in the empirical literature to account for polarisation. Beside technology, other factors explaining patterns of job polarisation have included international trade and offshoring [38–41], consumption spill overs [42,43], ageing of population [44], labour market rigidity [45]. The routinisation hypothesis shifts the analysis from skills to tasks arguing that the introduction of computer capital—on the one hand—substitutes for workers in performing cognitive and manual tasks, on the other hand
complements workers in performing non-routine problem-solving tasks. This explanation mostly relies on the introduction of information technology (ICT) experimenting a secular decline in real costs and for then incentivizing employers to substitute expensive labour for new computers. It follows that a substitution effect may occur for routine tasks leading to a contraction of employment for middle skilled workers (clerical and administrative occupations) performing routine cognitive and routine manual jobs. [27], for example, emphasize how computers replace routine tasks of mid-level skills, conversely non-routine tasks usually performed by high skilled and low skilled workers (i.e., cleaning) increase. On the same line of research, Ref. [7] hypothesize that computerisation has substituted for low skill workers in performing routine tasks while complementing creative and coordination tasks performed by highly educated workers.
An attempt to link occupations with skills and tasks has been made by [46,47] for US manufacturing over the period 1999–2010. The authors building on the task-based approach proposed by [27] define skills as ensembles of abilities applied to job tasks given the fact that productive activities can be broken into functionally different task groups and that technological change affects the comparative advantage of productive factors in performing a certain task [46,48]. The authors found that both technology and trade with low-wage countries are associated with mild cross-industry convergence in skill intensity, while trade with high and medium wage countries leads to heterogeneity across occupational groups. On the same line of research and focusing on the role of educational institutions, Ref. [49] investigates the link between the emergence of new skills related to radical new technologies and the adjustments made in formal education. In this framework, skills are defined as a combination of capacity to learn and know-how applied to a specific task in a specific context that is subject to change. All cited studies try to link skills with occupations and tasks in order to study the relationship between innovation and employment focusing on the dual role that technology can have partly substituting and partly complementing human work. However, few studies have taken into account the diversity of the directions technological change may take and the variety of innovative activities carried out in firms (among them see [50–53]). In empirical studies, technology is usually proxied by the mean expenditure in R&D, the number of patents or the adoption of ICTs. However, these proxies applied as indicators are not able to detect the full range of innovative activities carried out in firms, including also incremental development of product and process innovations, or knowledge accumulation. The expenditure in R&D as well as the number of registered patents can be driven by large firms and sectoral specific features—i.e., the importance of pharmaceutical sector.
Furthermore, few studies have interrelated the analysis of technologies with the occupational dimension looking at the impact that different technological strategies at sectoral level have on professional groups.
A few studies have investigated the relationship between business cycles and employment polarization. Ref. [54] have studied the 2001 recession in the US and its impact on job reallocation across industries. They argued that technological change, reorganization of production, local or international outsourcing have determined a permanent fall in demand that has resulted in permanent layoffs. The jobless nature of the recovery taking place since 2003 is therefore interpreted as the effect of the structural change in the US economy. In the same vein, Ref. [55,56] investigated the 2008 crisis and found some effects on job polarization in the US; however, their analysis does not consider industry differences and structural change. Ref. [57] explored employment polarization and its interaction with US business cycles using data on individual from the Current Population Survey. They assess the presence of synchronization in the employment dynamics over the business cycle of different skill groups and investigate the patterns of labour reallocation. Their results suggest that there is no evident relationship between employment polarization and business cycles, as all workers are likely to be equally affected by recessions and unemployed middle-skill workers rarely find new jobs during the upswings of the business cycle. A similar perspective has been adopted by [58] who interpret job polarization as a long term structural phenomenon of the US economy, rather than the effect of business cycles. Focusing on middle-skill occupations, they detect an acceleration of job losses during
recessions—in particular in construction, manufacturing, education and health services—leading to an acceleration of polarization.
Finally, Ref. [59,60] investigated the skill mismatch in the US labour market finding that it is more relevant for skilled workers rather than for middle skills and that there is no evidence of an acceleration of polarization during recessions.
The impact of the Great Recession on jobs in the US has been recently investigated by a set of studies edited by [12], exploring the persistence of long term factors and the specificity emerged in the recent crisis. Ref. [61] have shown that the large job losses of 2009 have not been absorbed by new vacancies due to a slow demand dynamics. Ref. [62] point out that—differently from past recoveries—small firms have failed to restart hiring in anticipation of large firms’ behaviour. The expanding trade with China—according to the results by [63]—has led to a 2% loss of US private sector employment between 1999 and 2011. Considering the skill structure of US jobs, Ref. [64] identify since 2000 a contraction in the demand for skilled workers performing cognitive tasks that has led to a stagnation in their wages. Such trends—they argue—have been accelerated by the collapse of the US housing bubble. Therefore, high-skilled workers moved down the occupational ladder and displaced lower-educated workers in less skill-intensive jobs, suggesting a de-skilling pattern in the occupational structure. Moreover, the US recession appears to have reallocated production to more efficient firms to a lower extent than in past downturns, with modest effects on productivity improvements [65].
In the context of this debate we aim to model and test empirically the diversity of determinants of employment change across occupations—managers, clerks, craft workers and manual workers—that summarise the employment hierarchy in terms of qualification, power and wages. We expect that across industries, different technological strategies—documented by innovation performances—interact with demand, wages and education resulting in different patterns of employment change for occupations that are complementary to the new technology on the one hand and for occupations that are replaced by new processes (see [66]). Moreover, we investigate how these relationships operate in different phases of the business cycles. While the task-based literature has focused on the complementarity or replaceability of workers’ tasks—recently looking at automation, robotics and artificial intelligence [1,67–69]—we consider occupational groups that reflect distinct functions in firms, have diverging exposures to the effects of technology, have different bargaining power, contractual conditions and wage levels.
3. The Evolution of Occupations in European Industries
The dynamics of occupations in European employment is investigated in this section with an analysis at the industry level, with consideration of four main professional groups that effectively account for the diversity of workers’ positions in the production process.
An industry-level approach has two main advantages. First, it allows to relate occupational dynamics to the evolution of technological activities, structural change and demand components for the whole economy. This avoids the limitations of most firm level studies which rely on panels that may not be representative of the universe of firms and whose results may fail to capture the business stealing effect where the job gains of innovative firms could be compensated by the losses of weaker firms in the same industry, resulting in no net employment growth [70] (TableA6). Moreover, as [71] pointed out, industry studies provide an institutional and historical context in which the dynamics of firms and workers can be investigated.
Second, an industry level analysis can use a wide range of indicators accounting for the complexity of technological activities, such as those provided by Europe’s innovation surveys allowing to identify the main innovative strategies that emerge in industries and in particular the relative importance of the development of new products and new processes.
3.1. Data and Analysis
The empirical analysis is carried out on the Sectoral Innovation Database (SID) developed at the University of Urbino, containing industry-level information on 21 manufacturing sectors, (from 15 to 37 Nace Rev.1) and 15 service sectors (from 50 to 74 Nace Rev.1) (See [72] for a detailed description of the database. Due to the change in the classification system of industries after 2008, we transform employment data of the latest years expressed in Nace Rev.2 classes into the older ones (Nace Rev.1) applying the conversion matrix developed in [73,74], so that we can investigate a standardized data series for the entire time span 1999–2011). Countries included in the analysis are Germany, France, Italy, Spain and United Kingdom (GER, FR, IT, SP, UK).
The database includes variables on employment and occupations, innovation and economic activities, derived from three major sources: The Labour Force Survey (from Eurostat), the Community Innovation Survey (CIS, from Eurostat) and the OECD Structural Analysis (STAN) database.
We use data on occupations from Labour Force Surveys based on the ISCO88COM nomenclature and we define four main professional groups: Managers, Clerks, Craft workers and Manual workers, described in Table1below. In our view, the ISCO classification provides an adequate representation of skills as it considers a wide range of information on workers’ activities, including the typology of work, the level of autonomy in the workplace, the average education required, the position in firms’ hierarchy and labour compensation. Our definition of professional groups synthesizes the multidimensional characteristics of jobs, ranking professional groups according to competences and wages (for a detailed analysis see [9,75]).
Table 1.The professional groups.
Professional Groups ISCO 1 Digit Classes
Managers
Managers, senior officials and legislators Professionals
Technicians and associate professionals
Clerks Service and sales workersClerks
Craft workers Skilled agricultural and fishery workersCraft and related trade workers Manual workers Plant and machine operators and assemblersElementary occupations
Data on technology is drawn from Europe’s innovation surveys—CIS 2 (1994–1996), CIS 3 (1998–2000), CIS 4 (2002–2004) and CIS6 (2006–2008)—and include information on the shares of firms in each industry performing some kind of innovation (only product, only process, both product and process) and on the expenditure per employee devoted to R&D and to innovation-related machinery. Finally, industry-level data on wages and economic performance are drawn from the OECD STAN database (As a wage variable, we use labour compensation per employee, which includes social contributions. Sources and periodization of data are shown in TableA1in the AppendixA). Descriptive statistics of the main variables included in the analysis are shown in Table2below by period of analysis. A preliminary investigation of the dynamics of occupations in Europe is carried out in this section exploring three main issues: (a) the long-term evolution of each professional group; (b) the general relationships between technology and different occupations; (c) the importance of business cycles; (d) a sectoral decomposition of job changes distinguishing structural change from upskilling/downskilling within sector.
Table 2.Summary statistics of employment variation and industrial dynamics by period (Upswing and Downswing).
2002–2007 (Upswing) Value Added
(Rate of Growth)
Labour Comp. Per Employee (Rate of Growth)
Emp. (Rate of Growth) Managers (Rate of Growth) Clerks (Rate of Growth) Craft Workers (Rate of Growth) Manual Workers (Rate of Growth)
Share of Workers with University Education
Exp. in R&D Per Employee Exp. in Machinery Per Employee Mean 1.99 1.83 0.67 3.60 −0.44 −0.23 0.79 25.45 2.27 1.79 Median 1.77 1.03 0.16 3.18 −1.22 −1.37 −0.14 22.94 0.57 1.17 Min −17.39 −29.87 −17.16 −14.50 −26.85 −31.02 −33.48 0.00 0.00 0.01 Max 42.02 85.89 29.85 29.09 30.60 50.73 59.38 85.67 30.49 18.27 2007–2011 (Downswing) Value Added (Rate of Growth)
Labour Compensation Per Employee (Rate of Growth)
Emp. (Rate of Growth) Managers (Rate of Growth) Clerks (Rate of Growth) Craft Workers (Rate of Growth) Manual Workers (Rate of Growth)
Share of Workers with University Education
Exp. in R&D Per Employee Exp. in Machinery Per Employee Mean −0.13 3.87 −2.48 0.02 −1.39 −5.68 −5.93 25.82 2.14 1.58 Median −0.31 2.66 −1.67 −0.29 −0.20 −4.29 −5.98 20.86 0.63 0.93 Min −35.48 −46.76 −27.51 −28.75 −49.51 −52.05 −52.43 0.00 0.00 0.01 Max 21.81 73.44 31.89 33.39 44.07 48.94 43.34 85.42 18.75 17.26
3.2. The Dynamics of Occupations
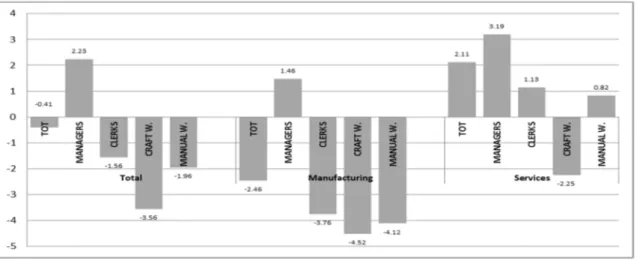
The long-term evolution of employment in professional groups is investigated with reference to the 1999–2011 period, an adequate time span for identifying structural changes and avoid temporary turbulence in job dynamics (In the econometric analysis of Section3below percentage changes in employment over this period are related to technology variables calculated as averages of the four CIS waves listed above and to educational shares for a central year, 2005). Figure1shows—for the aggregate of the five EU countries—the changes in each professional group over the whole period we considered 1999–2011, with a break down for manufacturing and services. The evolution of occupations in Europe combines upskilling—typical of manufacturing where employment falls—and polarization—typical of services, where most of the job growth takes place. In terms of shares of total employment, services have the highest concentration of managers and clerks, while in manufacturing craft and manual workers account for the largest share of jobs.
Figure 1.Rate of change of employment by professional groups, 1999–2011. Average annual rates of change, manufacturing and services, five major EU countries. Source: LFS, own elaboration.
In manufacturing, managers are the only professional group growing, while major job losses are concentrated in all other groups. Services did create new jobs—a 2.11% increase between 1999 and 2011—mainly for managers, with increases for clerks and manual workers too. In all cases, craft workers have a worse dynamic than manual workers, reflecting the expansion of ancillary jobs in low qualified activities (Eurofound, 2013) that is a key element of the pattern of polarization.
Behind this overall picture for the aggregate of five EU countries, national patterns vary, combining in different ways upskilling, polarisation and the shift from manufacturing to services. Growth in managers is stronger in Spain, Italy and France—where catching up effects in the skill structure could be relevant—and increases in manual workers are found in Germany, Spain and Italy. Conversely, job losses in craft workers are particularly strong in France and the UK (In the AppendixA, we show average growth rates over the upswing (2002–2007) and the downswing (2007–2011) by country—see FiguresA1–A5, TablesA1–A6).
3.3. Technologies and Occupations
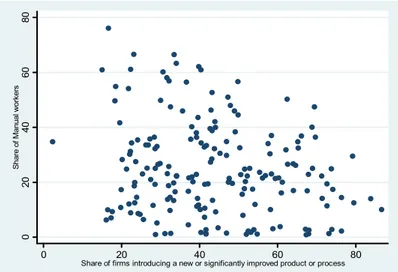
The skill bias effect of technological change has been widely investigated. A simple empirical evidence is provided in Figures2and3, where the share of firms introducing innovations (either new products or new processes) is plotted against the shares of managers and manual workers in total employment. The contrasting effects of innovation are evident; in Figure2a broad positive association emerges, with more innovative industries showing higher shares of Managers, Professionals and Technicians, although with a wide dispersion due to industry and country diversity. In Figure3
the negative relationship between innovation and shares of manual workers emerges, as new processes have the main aim of replacing low skilled workers and new products are associated to higher skill intensity of jobs. Behind this overall pattern, the specific impact of different innovation strategies—based on a more detailed set of indicators—is investigated in the next section.
0 20 40 60 80 100 Sha re of M ana ge rs 0 20 40 60 80
Share of firms introducing a new or significantly improved product or process
0 20 40 60 80 Sh ar e of M anua l wo rk er s 0 20 40 60 80
Share of firms introducing a new or significantly improved product or process
Figure 2.Product innovation in firms and shares of managers in employment. Averages 1999–2011, five European countries, 38 manufacturing and service industries, percentages.
0 20 40 60 80 100 Sha re of M ana ge rs 0 20 40 60 80
Share of firms introducing a new or significantly improved product or process
0 20 40 60 80 Sh ar e of M anua l wo rk er s 0 20 40 60 80
Share of firms introducing a new or significantly improved product or process
Figure 3. Process innovation in firms and shares of manual workers in employment. Averages 1999–2011, five European countries, 38 manufacturing and service industries, percentages.
3.4. Occupations and Cycles
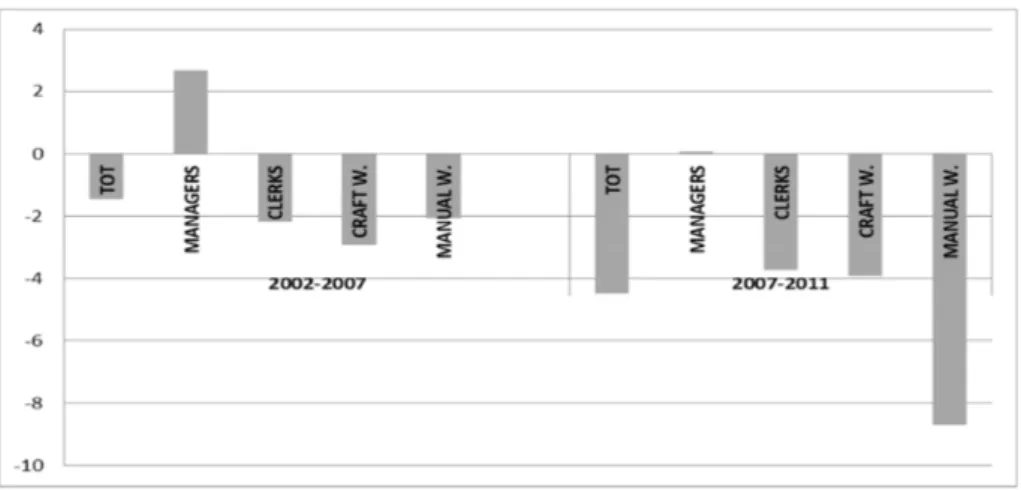
The patterns documented above are strongly affected by business cycles. In this analysis, we consider the 2002–2007 upswing and the 2007–2011 downswing. Figure4shows total employment changes in each professional group in the two periods for the aggregate of five EU countries.
Figure4highlights important characteristics of the occupational dynamics. First, the 2002–2007 expansion appears to be largely a jobless recovery in Europe too; employment growth over this period is a meagre 0.67% per year. Conversely, the 2007–2011 (TableA4) recession has led to major job destruction, with a 2.48% employment fall per year. Second, the upswing is dominated by occupational polarization, with a large expansion of managers and a modest growth of manual workers, with limited losses in mid-skill occupations. Conversely, the downswing is characterized by a structural shift in
the skill structure where losses are concentrated in craft and manual workers; behind the resulting apparent upskilling there is a combination of structural change from declining, blue-collar dominated manufacturing to services and the “survival” in their jobs of more skilled employees.
Figure 4.Employment change, 2002–2007 (upswing) and 2007–2011 (downswing). Average annual rates of change of total employment in manufacturing and services, five major EU countries. Source: LFS, own elaboration.
This picture is confirmed when we separately analyse manufacturing (see Figure5) and services (see Figure6); manufacturing shows an employment contraction even in the upswing, while services keep creating jobs for managers and clerks also in the downswing. Strongest job contractions concern craft workers in services and manual jobs in manufacturing, suggesting that even during the downswing polarization patterns are not reversed in services, while manufacturing continues to experience its decades-old contraction in employment.
Furthermore, national patters matter. In fact, combining the analysis of cycles with professions by geographical areas, it emerges that so-called Northern European countries (Germany, France and the United Kingdom) differ from Southern European countries (Italy and Spain) in terms of occupational dynamics. A faster job growth clearly emerges in Italy and Spain over the upswing and mainly in services which has been totally reversed in the downswing with jobs destruction across all professional groups including managers. The North, conversely, which has been characterized by slower job growth during the upswing—suffers job losses during downswing across all professional groups, except managerial and high qualified professions.
Figure 5.Employment change in manufacturing, 2002–2007 (upswing) and 2007–2011 (downswing). Average annual rates of change of employment, five major EU countries. Source: LFS, own elaboration.
∆ = ∆ ∆ − − − − − − − − − − − − − − − − − − − − − − − − −
Figure 6.Employment change in services, 2002–2007 (upswing) and 2007–2011 (downswing). Average annual rates of change of employment, five major EU countries. Source: LFS, own elaboration. 3.5. Decomposing Occupational Changes over Cycles
Employment dynamics by professional groups result from a combination of changes within industries and between sectors; we use a shift-share analysis in order to investigate these changes within and between manufacturing and services in the phases of the business cycle. We can detect in this way on the one hand the importance of upskilling or downskilling trends within manufacturing and services and, on the other hand, the structural change taking place from the former to the latter. Both changes are heavily affected by the upswing and downswing of the business cycle. A shift-share analysis at the level of two-digit industries has been carried out in [75].
In order to provide a more precise picture of employment dynamics by occupations and sectors, we apply the simple decomposition algorithm used by [76] described in the formula (1) below:
∆s=
∑
i
∆eisi+
∑
iei∆si (1)
where s is the share of an occupational group in the economy, si is the average share of a specific occupational group over the period, e is the share of total employees in an industry—manufacturing or services—in relation to total employment, eiis the average share of employees over the period, i is the macro-sector (manufacturing or services). We apply the [76] decomposition also to the upswing and to the downswing. Results are shown in Table3.
Table 3. Decomposition of employment change in upswing and downswing in manufacturing and services, five major EU countries.
2002–2007 Managers Clerks Craft W. Manual W.
Between Within Between Within Between Within Between Within
Manufacturing −1.01% 1.33% −0.45% −0.25% −1.03% −0.69% −1.15% −0.39% Services 1.18% 1.51% 1.52% −1.47% 0.24% −0.15% 0.69% 0.11% Total Change 0.17% 2.84% 1.07% −1.72% −0.79% −0.84% −0.46% −0.28%
2007–2011 Managers Clerks Craft W. Manual W.
Between Within Between Within Between Within Between Within
Manufacturing −0.82% 1.47% −0.33% 0.47% −0.71% 0.00% −0.73% −1.95% Services 0.87% 0.18% 1.06% 0.68% 0.16% −0.45% 0.49% −0.41% Total Change 0.05% 1.65% 0.74% 1.16% −0.55% −0.45% −0.24% −2.36%
The expansion of services appears to be the main driver of managers’ growth, while manufacturing downsizing is associated to the fall of craft and manual workers. Within industries, upskilling emerges as a dominant trend in manufacturing while in services polarization prevails. From this empirical overview, a rather complex picture of structural change, upskilling and polarization emerges.
Focusing on the upswing 2002–2007, the between industry component is negative across all professional groups in the aggregate of manufacturing industries, while employment grows in services. Managers are the only professional group expanding in manufacturing—within component—while in services both managerial and manual jobs grow, contrasting the employment contraction of middle-skill professions—clerks and craft workers.
The structural picture is confirmed also in the downswing (2007–2011) with negative job changes across all professional groups in manufacturing and positive job changes in services—between components. The main difference between the two periods is registered in the within-industry component; in detail manufacturing during the downswing is characterized by a modest increase of clerks and craft workers balancing the strong decline in manual jobs. In services, the polarization trend registered in the upswing with a modest increase in elementary jobs disappears in 2007–2011 when even manual workers contract and modest job increases only concern managers and clerks.
4. The Econometric Estimation
The econometric specification we propose to study skill dynamics in Europe builds on existing literature and takes into account the findings of the descriptive analysis of the previous section, highlighting the complexity of the relationships at work. Much of the literature modelling changes in the employment or wage structure relies on a translog cost function [3,65,76–78] developed by [79] where the employment shares of skills are investigated as a function of different factors. Considering the importance of the absolute employment changes documented above, we modify this approach considering rates of change rather than shares as dependent variables. The explanatory factors we consider include on the one hand the “micro” variables used in the literature—such as wages and education—and, on the other hand, we include different technology variables and indicators of demand accounting for the structural evolution of industries.
We build on previous work on the dynamics of aggregate employment carried out at the industry level and on models that include different technology variables, wages and demand factors [51,70,80]. In particular, we use variables that are able to account for the diversity of innovation strategies aiming at improving either technological competitiveness—through R&D or overall innovation—or cost competitiveness—through expenditure for new machinery or adoption of innovation from suppliers. Previous studies have shown that at the industry level the employment impact of the former is generally positive, while the latter tends to have job destruction effects [8,81,82].
In the model, we also include aggregate industry demand as a factor shaping growth opportunities. In several studies on the employment impact of technology, demand—proxied by value added and by its components—has emerged as a key driver [83–87]; in particular, an expanding demand at the industry level is a necessary condition for allowing the job creation effects of product innovation to emerge.
Finally, wages are expected to have an inverse relationship with employment creation, as in standard labour market models; this relationship, however, is likely to vary across the professional groups we investigate.
The econometric specification applied to study the determinants of employment growth derives from a translog model whereas in [77] capital and technology stocks are assumed to be quasi-fixed. Wages, education, technologies and aggregate demand are considered as the main drivers of employment change. Our estimates on the aggregate employment change are based on the following labour equation:
∆empit=β5∆VAit+β1∆wit+β2eduit+β3∆tcit+β4∆ccit+εit (2) where ∆emp is the compound annual rate of change of employment, ∆w is the compound annual rate of change of labour compensation (changes in labour costs which are expected to be negative related with the change in employment), edu is the share of workers with higher education, tc and cc are
proxies for the technological and the cost competitiveness strategies, VA is value added, a proxy for demand and ε is the error term, for industry i and time t. The model is estimated at industry level for five European countries, the individual observation is a certain industry in a given country at a certain time. We introduce specific country effects in order to account for differences in country characteristics and sector specificities. Accounting for national patterns is important in terms of national system of industrial relations and welfare institutions, as well as economic and employment structures.
As a baseline equation, we estimate the following labour demand curve that can be assumed to be the result of a cost minimisation programme by a firm with a translog cost function:
yit=x′
itβ+ui +vit (3)
where yitis the employment variable, xitthe vector of regressors, uithe individual/sectoral effect and vitthe random disturbance, for industry i and time t. If variables are expressed in log scale, we can eliminate the individual effect by taking the first difference of Equation (3).
yi,t−yi,t−1=β(Xi,t−Xi,t−1) + (ui−ui) + (vi,t−vi,t−1) ∆yi,t=β∆Xi,t+∆vi,t
(4)
In this way, the sectoral unobserved component uipotentially leading to biased estimates due to its correlation with the error component vi,tis differentiated out. This transformation permits to apply Ordinary Least Squares Estimator (OLS).
As known, the difference in log approximates the rate of change, thus we express both dependent variable and regressors in rate of variation. Instead of considering long differences, we compute the compound annual growth rate. Innovation variables are not expressed in rates but as either shares of firms in the sector or expenditure per employee. This can be justified considering innovative efforts intrinsically dynamic and deemed to capture the change in the technological opportunity set available to the industry [70].
Taking differences of variables, the model can be estimated consistently using OLS. Furthermore, the model is adjusted for heteroscedasticity (robust standard errors) and intra-group correlation at the industry level, checking for intra-sectoral heterogeneity. Dealing with different sized groups, heteroscedasticity is quite common. We use a Weighted Least Squares procedure using the average number of employees over the period 1999–2011 as a weight for the long run, while the average number of employees over 2002–2007 for the upswing and the average number of employees over 2007–2011 for the downswing. We also control for the possibility of multicollinearity between regressors through a VIF (Variance Inflation Factors) test.
Model (2) is first estimated on changes in total employment in order to account for overall job dynamics. We then estimate the same model for each professional group in order to explore regularities and diversities in such relationships. We estimate a system of labour demand equations for managers, clerks, craft and manual workers—as in [88,89]—using seemingly unrelated regressions (SUR, [90]). Such method allows that changes in one skill group may affect changes in the other ones. The model estimated for the four professional groups is expressed in Equation (5):
∆managersit =β1∆VAit+β2∆wit+β3eduit+β4∆tcit+β5∆ccit+εit ∆clerksit=β1∆VAit+β2∆wit+β3eduit+β4∆tcit+β5∆ccit+εit ∆cra f t workersit=β1∆VAit+β2∆wit+β3eduit+β4∆tcit+β5∆ccit+εit ∆manual workersit =β1∆VAit+β2∆wit+β3eduit+β4∆tcit+β5∆ccit+εit
(5)
As a control, we instrumented value added through profits (rate of change) and lagged profits—see TablesA2andA3in the AppendixA. Conversely, we assume that in European industries wage changes do not react in the short term to changes in employment as industries are characterized by different
institutional arrangements, collective contracts and bargaining processes, thus allowing an exogenous treatment of wages. Results are shown in the next section.
5. Results
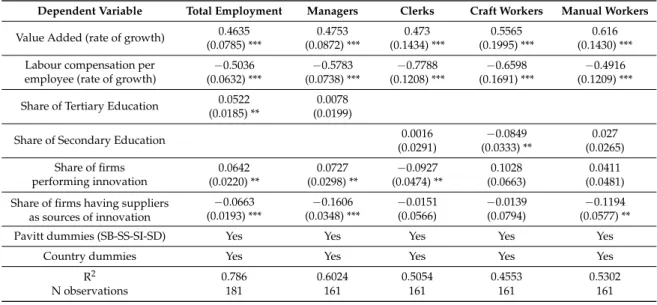
Table4reports the OLS estimation for total employment and the results of the seemingly unrelated regressions for the four professional groups. The seemingly unrelated regression model is therefore consistent and efficient. All coefficients are corrected for heteroscedasticity. For the Seemingly unrelated regressions we have calculated the Breusch-Pagan test of independence on the correlation matrix of residuals; the result allows to reject the hypothesis of independence between residuals for the four professional groups (χ2(6) =51.876). Results confirm expected relationships and identify significant differences for skill groups.
Changes in total employment are affected by demand growth—proxied by value added—and negatively related to wage increases; higher shares of workers with tertiary education are associated to job growth. The contrasting effects of innovation are documented by the share of innovating firms— a proxy for the search for technological competitiveness—showing a positive employment impact and by the share of firms having suppliers as sources of innovation—a proxy for cost competitiveness—which has a negative impact on jobs; both coefficients have the same magnitude (The results on the contrasting effects of different types of innovation confirm previous findings at the industry level [70,80]. They are also consistent with the micro-econometric evidence from firm-level data obtained from the third wave of the Community Innovation Survey for France, Germany, Spain and the UK [91].
In the regression, we include country dummies and dummies for the four Pavitt classes (Science Based, Specialized Suppliers, Scale Intensive and Suppliers Dominated), in order to account for sectoral heterogeneity (See the AppendixAfor the list of industries in Pavitt classes).
Results for the professional groups show commonalities and differences with the benchmark provided by the findings for total employment. Demand changes affect all professional groups but have stronger effects on craft and manual workers. Wage increases negatively affect all professional groups but have stronger effects on mid-skills—clerks and craft workers. In such professional groups the elasticity of employment to demand and wages appears to be higher, with a performance that is closer to the standard operation of labour markets.
Table 4.Determinants of employment change in professional groups in European industries, 1999–2011. OLS estimation of employment change; seemingly unrelated regressions for Professional groups.
Dependent Variable Total Employment Managers Clerks Craft Workers Manual Workers
Value Added (rate of growth) 0.4635 0.4753 0.473 0.5565 0.616
(0.0785) *** (0.0872) *** (0.1434) *** (0.1995) *** (0.1430) ***
Labour compensation per employee (rate of growth)
−0.5036 −0.5783 −0.7788 −0.6598 −0.4916
(0.0632) *** (0.0738) *** (0.1208) *** (0.1691) *** (0.1209) ***
Share of Tertiary Education 0.0522 0.0078
(0.0185) ** (0.0199)
Share of Secondary Education 0.0016 −0.0849 0.027
(0.0291) (0.0333) ** (0.0265)
Share of firms performing innovation
0.0642 0.0727 −0.0927 0.1028 0.0411
(0.0220) ** (0.0298) ** (0.0474) ** (0.0663) (0.0481)
Share of firms having suppliers as sources of innovation
−0.0663 −0.1606 −0.0151 −0.0139 −0.1194
(0.0193) *** (0.0348) *** (0.0566) (0.0794) (0.0577) **
Pavitt dummies (SB-SS-SI-SD) Yes Yes Yes Yes Yes
Country dummies Yes Yes Yes Yes Yes
R2 0.786 0.6024 0.5054 0.4553 0.5302
N observations 181 161 161 161 161
Surprisingly, while the share of workers with tertiary education was relevant for explaining total employment, this variable loses its significance for managers; we replace it with the share of workers with secondary education in the other three professional groups and it emerges as significant and negative for craft workers alone. At the level of skill groups, it is likely that the information available on educational levels are inadequate to account for the type of knowledge relevant for such jobs and the positive impact of education could be captured by the variable on industry innovativeness.
Considering now the contrasting effects of technology, we find that the positive effect of high shares of innovating firms and the negative effect of reliance on suppliers (the proxy for process-oriented innovation) are significant for managers only. For clerks, job losses are associated to higher share of innovating firms (while suppliers lose significance), suggesting that technological change as a whole has an employment reduction effect.
Also for craft and manual workers the potential job-creating effect of new products does not emerge; when industries succeed in bringing new products to markets, the jobs that are created are only at the top of the occupational hierarchy. We have seen in the descriptive analysis that managers is the only skill group with a strong expansion of employment; these results suggest that innovation supports such expansion, while the potential benefits of technology are lost for the other professional groups. A large literature has shown that lower skills are more easily offshored even when industries expand and new products are introduced; a preliminary analysis of the impact of offshoring and technology on professional groups is consistent with our results [10]. The only significant effect of technology on lower skills comes from the negative coefficient of the importance of suppliers in the manual workers equation; again, the negative effects of (process) technology emerge as the dominant one for the lower skilled.
Controls for country and Pavitt classes are included in these regressions; broadly similar results have been obtained with separate estimates for manufacturing and services [92].
The robustness of this specification has been tested in a number of ways. First, in order to test the exogeneity of value added we have instrumented it through the growth of profits (operating surplus) that is correlated with the rate of change of value added but is determined by the distributive dynamics. We carry out a Two Stages Least Squares regression and we find that our results are broadly confirmed. In TableA2in the AppendixA, we report the findings. The main differences from those of Table2 above include a lower significance of the value added for the professional groups; the positive and significant effect of tertiary education on employment growth of managers; the emergence of a positive impact of innovative activities for craft and manual workers, showing again the contrasting effects of technology. In addition, we also carried out estimations where value added is instrumented with the logs of 1995 profits (in order to allow for lagged effects), again obtaining similar results (see TableA3). The Estimation for Business Cycles
We now turn to the investigation of how the relationships so far identified are affected by the business cycle. As already pointed out, we consider the 2002–2007 upswing and the 2007–2011 downswing separately; we interact periods with all variables and therefore we allow coefficients to vary between the two periods. First, we test the structural stability of the time series of total employment estimated in Table5below comparing a single period with the break of series in 2007; the Chow test shows the presence of a structural break (Under the null of equal coefficients and no structural break, we reject H0with F11,289= 5.25 and a critical value of 1.75 at 5% of significance level.
For this analysis, we calculate average annual rates of change of employment and wages for the two periods; technology variables are computed as averages of CIS 2 and 3 for the first period and CIS 4 and 6 for the second one. Educational shares are calculated for 2002 for the first period and 2005 for the second one).
We estimate the same model of Equation (2) for total employment and for each professional group with an interaction between each regressor and the time period identifying the upswing and the downswing; the econometric methodology is the same one adopted for the estimation of total
employment in Table4above. We then compare the resulting coefficients in order to understand how the business cycle affects the relationships documented above, following the approach proposed in [93]; see also [84].
Table5shows the results. Total employment is again affected by changes in demand with no difference between expansion and recession. Wage increases negatively affect job changes in the upswing only; during the recession, job losses across industries were not associated to the importance of wage dynamics. The share of workers with tertiary education is also significant in the recovery alone. As technology indicators, we use here R&D expenditure per employee—as a proxy for technological competitiveness—and expenditure for new machinery—as a proxy for cost competitiveness. The former has a positive and significant effect on job changes in the expansion only; the latter has a negative effect in both periods. The contrasting effects of different technology strategies again clearly emerge. Country dummies and a dummy for manufacturing sectors have been included in this estimation.
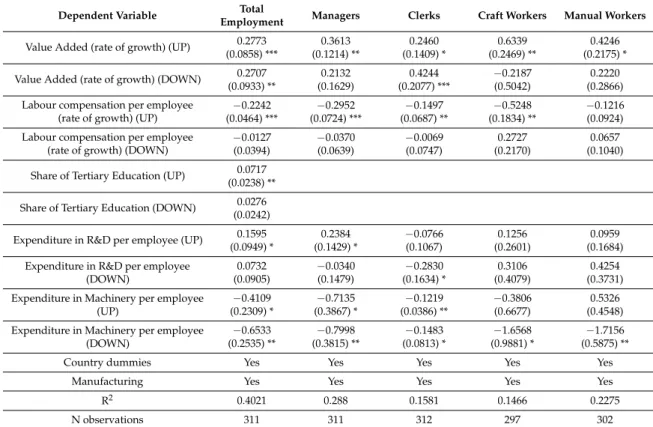
Table 5. Determinants of employment change in professional groups in European industries, in upswings (2002–2007) and downswings (2007–2011).
Dependent Variable Total
Employment Managers Clerks Craft Workers Manual Workers
Value Added (rate of growth) (UP) 0.2773 0.3613 0.2460 0.6339 0.4246
(0.0858) *** (0.1214) ** (0.1409) * (0.2469) ** (0.2175) *
Value Added (rate of growth) (DOWN) 0.2707 0.2132 0.4244 −0.2187 0.2220
(0.0933) ** (0.1629) (0.2077) *** (0.5042) (0.2866)
Labour compensation per employee (rate of growth) (UP)
−0.2242 −0.2952 −0.1497 −0.5248 −0.1216
(0.0464) *** (0.0724) *** (0.0687) ** (0.1834) ** (0.0924) Labour compensation per employee
(rate of growth) (DOWN)
−0.0127 −0.0370 −0.0069 0.2727 0.0657
(0.0394) (0.0639) (0.0747) (0.2170) (0.1040)
Share of Tertiary Education (UP) 0.0717 (0.0238) ** Share of Tertiary Education (DOWN) 0.0276
(0.0242)
Expenditure in R&D per employee (UP) 0.1595 0.2384 −0.0766 0.1256 0.0959
(0.0949) * (0.1429) * (0.1067) (0.2601) (0.1684)
Expenditure in R&D per employee (DOWN)
0.0732 −0.0340 −0.2830 0.3106 0.4254
(0.0905) (0.1479) (0.1634) * (0.4079) (0.3731)
Expenditure in Machinery per employee (UP)
−0.4109 −0.7135 −0.1219 −0.3806 0.5326
(0.2309) * (0.3867) * (0.0386) ** (0.6677) (0.4548)
Expenditure in Machinery per employee (DOWN)
−0.6533 −0.7998 −0.1483 −1.6568 −1.7156
(0.2535) ** (0.3815) ** (0.0813) * (0.9881) * (0.5875) **
Country dummies Yes Yes Yes Yes Yes
Manufacturing Yes Yes Yes Yes Yes
R2 0.4021 0.288 0.1581 0.1466 0.2275
N observations 311 311 312 297 302
Robust Standard Errors in parentheses: * significant at 10%, ** significant at 5%, *** significant at 1% level.
How do the four professional groups perform compared to this benchmark? Change in value added is relevant for job changes in all four professional groups during the upswing; the highest coefficients are for craft and manual workers. During recession, this relationship holds for clerks only.
Increases in labour compensation show a negative effect on job changes in all groups except manual workers—where wages tend to be so low that may not significantly affect labour demand. The wage elasticity of employment is the highest for craft workers. During the recession, again labour compensation loses its impact on job changes across industries. Education variables are not included in this estimation as they are the least affected by cyclical patterns.
The impact of technologies on professional groups again confirms its dual nature. The employment of managers is the only one that captures the benefits of new products during the upswing and is not significant during the downswing. Clerical jobs are lost during recession as a result of higher R&D
expenditures. Craft and manual workers do not appear to be affected by new products neither in the upswing nor in the downswing. The expenditure on new machinery which proxies process innovation has a strong and generalized negative impact on employment. During the expansion managers and clerks experience the negative effects of new process; during the recession, all professional groups suffer job losses as a consequence of new processes, with craft and manual workers being hit hardest. Again, country dummies and a dummy for manufacturing sectors have been included in this estimation.
The picture emerging from these results shows that in the recession started in 2007 most relationships driving the evolution of skills in Europe have broken down. While total employment has followed the collapse of demand and value added, job losses in professional groups have not been associated with the dynamics of either value added or wages, suggesting that industries and skills have been hit by the crisis in a differentiated way. The impact of technology adds a new depth to the evidence provided above. The potential that product innovations have for expanding total employment can be found during the upswing alone. But managers are the only professional group that accounts for such job expansion and the benefits of technology are in fact not available for less skilled workers. During the recession, the introduction of new products slows down and their positive employment effect is lost for all workers. In the downswing industries tend to concentrate on restructuring and the introduction of new processes, with generalized employment losses in all skill groups except managers; for craft and manual workers the negative effects are particularly heavy in manufacturing. These results confirm the findings of [93] on the impacts on total employment of new products and processes over the cycle and provide original evidence on how each professional group is affected by the combination of technological change and business cycles. Table6summarizes these main results.
Table 6.Summary of findings.
Product Innovations Process Innovations
Long term Managers + − Clerks − n.s. Craft workers n.s. n.s. Manual workers n.s. − Upswing Managers + − Clerks n.s. − Craft workers n.s. n.s. Manual workers n.s. n.s. Downswing Managers n.s. − Clerks − − Craft workers n.s. − Manual w. n.s. − 6. Conclusions
In this article, we have shed new light on the dynamics of skills in the context of the Great Recession, with improvements in our understanding of the diversity of professional groups, of the role of technology and of the impact of the last business cycle.
First, we have shown that the occupational dimension of jobs is crucial to understand changes in employment. Our ISCO-based definition of four professional groups—reflecting a multidimensional view of employment qualification—effectively captures differences in job dynamics. The descriptive analysis has documented the combination of upskilling and polarization that is taking place in Europe’s manufacturing and service industries. Our econometric analysis on the determinants of employment change has shown that each professional group is characterized by a specific set of effects of technological activities, demand and wages, which qualify the benchmark resulting from the determinants of total employment.
Second, the conceptualization of technology as a complex phenomenon has allowed us to distinguish between the dominance of product-oriented efforts to improve technological competitiveness and a strategy relying on labour-saving technologies. At the industry level, the former has emerged as having a positive impact on total employment, while the latter has a job reduction effect; this confirms the findings of a large literature [8,91,94]. In this article, we show that these contrasting effects are unevenly distributed across occupational groups; the managers’ group concentrates the job-creating effects of new products while manual workers suffer most the negative impact on new processes.
Third, we have shown that such relationships are not independent from the business cycle. The long run effects of technological change on professions—alongside the impact of demand and wages—have been disrupted in the recession started in 2007. For total employment, the positive impact of new products on job growth is confirmed during the upswing but disappeared in the years of the Great Recession. Conversely, in the downswing large job losses associated to industry restructuring and new processes emerge. When we break down employment by professional groups major novelties become visible. The gains in the expansion are concentrated in managers, while in the recession the largest losses hit craft and manual workers.
Fourth, the use of occupational groups in this investigation has allowed to identify the different relationships that managers, clerks, craft workers and manual workers have with technological change. Those with greater control over production and technology—i.e., managers, that include managerial occupations, professionals and technicians—have shaped innovation strategies in such a way that their jobs have expanded during the upswing and have not fallen during the downswing. On the other extreme, the weakest occupational group—manual workers—has no gain from technology during the upswing and suffers major job losses associated to the introduction of new processes during the downswing. Intermediate occupational groups in the downswing broadly share the pattern of manual workers. Our results show that recessions are the periods when accelerated structural change and job destruction takes place, while upswings are the periods when new job creation—generally in higher occupations—occurs. The role of different types of technology is crucial in this context, with new processes leading to major job losses in recessions and new products driving job creation in expansions. However, such changes are unevenly spread among occupations. The position in the employment hierarchy plays a major role in explaining the ability of stronger occupational groups (managers) to benefit from new product technology or the exposure of weaker professional groups (manual workers in particular) to job losses associated to new processes and to the restructuring taking place mainly during recessions. These different outcomes are the result of how different professional groups are able to control decisions in firms, shape the type of technological change that is introduced and protect themselves from potential threats in markets, demand and technology, building on their bargaining and contractual position.
Acknowledgments: This work is part of the ISIGrowth project on Innovation-fuelled, Sustainable, Inclusive Growth that has received funding from the European Union’s Horizon 2020 research and innovation programme under grant agreement No. 649186—ISIGrowth.
Author Contributions:Mario Pianta and Leopoldo Nascia conceived the categorization of occupational groups and wrote introduction, results' and conclusions’ sections; Valeria Cirillo is the author of the literature review. She analyzed the data performing the econometric analysis.
Conflicts of Interest:The authors declare no conflict of interest.
Appendix A
Table A1.List of variables.
Variables Source Long Run Upswing Downswing
Percentage change of number of employees LFS 1999–2011 2002–2007 2007–2011
Percentage change of number of Managers LFS 1999–2011 2002–2007 2007–2011
Table A1.Cont.
Variables Source Long Run Upswing Downswing
Percentage change of number of Craft W. LFS 1999–2011 2002–2007 2007–2011
Percentage change of number of Manuals W. LFS 1999–2011 2002–2007 2007–2011
Expenditure in R&D per employee CIS 2,3 4,6
Expenditure in Machinery per employee CIS 2,3 4,6
Share of firms performing innovations CIS 2,3,4,6
Share of firms having suppliers as sources of innovation CIS 2,3,4,6
Percentage change of Value Added STAN 1999–2011 2002–2007 2007–2011
Percentage change of Labour Compensation per employee STAN 1999–2011 2002–2007 2007–2011
Figure A1. Employment change, 2002–2007 (upswing) and 2007–2011 (downswing) in Germany. Average annual rates of change of total employment in manufacturing and services.
Figure A2.Employment change, 2002–2007 (upswing) and 2007–2011 (downswing) in Spain. Average annual rates of change of total employment in manufacturing and services.
Figure A3.Employment change, 2002–2007 (upswing) and 2007–2011 (downswing) in France. Average annual rates of change of total employment in manufacturing and services.
Figure A4.Employment change, 2002–2007 (upswing) and 2007–2011 (downswing) in Italy. Average annual rates of change of total employment in manufacturing and services.
Figure A5. Employment change, 2002–2007 (upswing) and 2007–2011 (downswing) in the United Kingdom. Average annual rates of change of total employment in manufacturing and services.
Figure A6. Employment change, 2002–2007 (upswing) and 2007–2011 (downswing) in Northern (DE-FR-UK) and Southern (IT-SP) countries. Source: LFS, own elaboration.
Table A2. Determinants of employment growth in professional groups in European industries, 1999–2011. Instrumental Variable Approach (bootstrapped standard errors). The rate of growth of value added has been instrumented with the rate of growth of operating surplus.
Dependent Variable Tot Employment Managers Clerks Craft Workers Manual Workers
Value Added (rate of growth) instrumented
0.3771 0.1681 0.2756 1.0158 0.4355
(0.1456) *** (0.2292) (0.2301) (0.3950) ** (0.2839)
Labour compensation per employee (rate of growth)
−0.4900 −0.4460 −0.4932 −0.4348 −0.5206
(0.0790) *** (0.1267) *** (0.1196) *** (0.2505) * (0.1252) ***
Share of Tertiary Education 0.0531 0.0461
(0.0199) *** (0.0220) **
Share of Secondary Education −0.0080 −0.0414 0.0561
(0.0282) (0.0770) (0.0370)
Share of firms performing innovation 0.0652 0.0889 0.0723 0.1512 0.1494
(0.0245) *** (0.0434) *** (0.0445) (0.0763) ** (0.0691) * Share of firms having suppliers as
sources of innovation
−0.0648 −0.1250 −0.0674 −0.0076 −0.0863
(0.0240) *** (0.0579) ** (0.0391) * (0.0911) (0.0468) *
Pavitt dummies (SB-SS-SI-SD) Yes Yes Yes Yes Yes
Country dummies Yes Yes Yes Yes Yes
N observations 183 183 181 165 174
Bootstrapped Standard Errors in parentheses: * significant at 10%, ** significant at 5%, *** significant at 1% level.
Table A3. Determinants of employment growth in professional groups in European industries, 1999–2011. Instrumental Variable Approach (bootstrapped standard errors). The rate of growth of value added has been instrumented with the lagged value of operating surplus (in log).
Dependent Variable Tot Employment Managers Clerks Craft Workers Manual Workers
Value Added (rate of growth) instrumented
0.3866 0.2067 0.1823 6.877 −0.7224
(0.1371) ** (0.2120) (0.7056) (3.5898) ** (1.7899)
Labour compensation per employee (rate of growth)
−0.5050 −0.3786 −0.5378 −1.3661 −0.4126
(0.0695) *** (0.1045) *** (0.1734) *** (0.7404) * (0.3557)
Share of Tertiary Education 0.0517 0.0510
(0.0195) ** (0.0272) *
Share of Secondary Education 0.0003 −0.0430 0.1336
(0.0235) (0.0969) (0.0649) **
Share of firms performing innovation 0.071 0.0735 0.0903 −0.0334 0.1743
(0.0290) ** (0.0408) * (0.0561) (0.2372) (0.1273)
Share of firms having suppliers as sources of innovation
−0.0734 −0.0765 −0.1021 −0.1274 −0.0590
(0.0251) ** (0.0627) (0.0426) ** (0.2065) (0.0700)
Pavitt dummies (SB-SS-SI-SD) Yes Yes Yes Yes Yes
Country dummies Yes Yes Yes Yes Yes
N observations 181 181 179 165 173
Bootstrapped Standard Errors in parentheses: * significant at 10%, ** significant at 5%, *** significant at 1% level
Table A4. Determinants of employment growth in professional groups in European industries in upswing (2002–2007) and downswing (2007–2011). Clustered standard errors (industry and period).
Tot Employment Managers Clerks Craft Workers Manual Workers
Value Added 0.277 ** 0.318 ** 0.320 * 0.529 * 0.0337 UPSWING (3.23) (2.9) (2.12) (2.25) (0.16) Value Added 0.271 ** 0.226 0.267 −0.193 0.343 DOWNSWING (2.9) (1.35) (1.35) (−0.38) (1.23) Labour Comp. −0.224 *** −0.285 *** −0.125 −0.506 ** −0.0421 UPSWING (−4.83) (−3.86) (−1.68) (−2.70) (−0.52) Labour Comp. −0.0127 −0.027 −0.035 0.276 0.135 DOWNSWING (−0.32) (−0.39) (−0.49) (1.2) (1.29) Share of tertiary 0.0718 ** 0.00223 −0.0216 0.14 0.144 UPSWING (3) (0.05) (−0.49) (1.66) (1.58)
Table A4.Cont.
Tot Employment Managers Clerks Craft Workers Manual Workers
Share of tertiary 0.0277 −0.0325 0.0528 0.159 −0.067 DOWNSWING (1.14) (−0.72) (1.18) (1.05) (−0.70) Expenditure in R&D 0.16 0.229 −0.0414 −0.00573 −0.0856 UPSWING (1.68) (1.48) (−0.33) (−0.02) (−0.53) Expenditure in R&D 0.0733 0.0383 −0.24 0.0254 0.643 DOWNSWING (0.81) (0.23) (−1.31) (0.05) (1.65)
Expenditure in new mach. −0.411 −0.749 −0.910 ** −0.468 0.238
UPSWING (−1.78) (−1.93) (−2.74) (−0.72) (0.52)
Expenditure in new mach. −0.653 * −0.759 * −0.909 * −1.595 −1.410 **
DOWNSWING (−2.58) (−2.04) (−2.33) (−1.55) (−2.61)
Country dummies Yes Yes Yes Yes Yes
Manufacturing Yes Yes Yes Yes Yes
N 283 283 283 270 274
Clustered Standard Errors in parentheses: * significant at 10%, ** significant at 5%, *** significant at 1% level.
Table A5. Determinants of employment growth in professional groups in European industries in upswing (2002–2007) and downswing (2007–2011). Seemingly unrelated regressions.
Tot Employment Managers Clerks Craft Workers Manual Workers
Value Added 0.450 *** 0.499 *** 0.488 * 0.664 ** 0.530 * UPSWING (5.24) (3.65) (2.48) (2.58) (2.3) Value Added 0.283 *** 0.470 *** −0.153 0.106 0.186 DOWNSWING (3.43) (3.56) (−0.81) (0.43) (0.84) Labour Comp. −0.377 *** −0.465 *** −0.227 * −0.569 *** −0.274 * UPSWING (−8.22) (−6.34) (−2.15) (−4.12) (−2.22) Labour Comp. −0.145 *** −0.200 *** −0.103 −0.0708 −0.0027 DOWNSWING (−4.82) (−4.20) (−1.50) (−0.79) (−0.03) Share of tertiary 0.0497 *** UPSWING (3.93) Share of tertiary 0.0374 *** DOWNSWING −3.29 Expenditure in R&D 0.207 * 0.135 −0.108 −0.107 0.27 UPSWING (2.11) (0.88) (−0.49) (−0.37) (1.04) Expenditure in R&D −0.0682 −0.383 * −0.139 −0.00915 0.186 DOWNSWING (−0.68) (−2.50) (−0.63) (−0.03) (0.72)
Exp. in new mach. 0.0743 0.15 −0.783 0.369 0.595
UPSWING (0.389) (0.48) (−1.74) (0.63) (1.139)
Exp. in new mach. −0.757 *** −0.2 −1.965 *** −1.788 *** −1.259 **
DOWNSWING (−4.62) (−0.77) (−5.23) (−3.64) (−2.87)
Country dummies Yes Yes Yes Yes Yes
Manufacturing Yes Yes Yes Yes Yes
N 293 293 293 293 293
Robust Standard Errors in parentheses: * significant at 10%, ** significant at 5%, *** significant at 1% level.
Table A6.List of sectors in the Revised Pavitt taxonomy for manufacturing and service industries.
SCIENCE-BASED
Chemicals; Office machinery; Manufacture of radio, television and communication equipment and apparatus; Manufacture of medical, precision and optical instruments, watches and clocks; Communications; Computer and related activities; Research and development.
SPECIALISED SUPPLIERS
Mechanical engineering; Manufacture of electrical machinery and apparatus n.e.c.; Manufacture of other transport equipment; Real estate activities; Renting of machinery and equipment;
Other business activities.
SCALE INTENSIVE
Pulp, paper & paper products; Printing & publishing; Mineral oil refining, coke & nuclear fuel; Rubber & plastics; Non-metallic mineral products; Basic metals; Motor vehicles; Financial intermediation, except insurance and pension funding; Insurance and pension funding, except compulsory social security; Activities auxiliary to financial intermediation.
SUPPLIER DOMINATED
Food, drink & tobacco; Textiles, Clothing, Leather and footwear; Wood & products of wood and cork; Fabricated metal products; Furniture, miscellaneous manufacturing, recycling; Sale, maintenance and repair of motor vehicles and motorcycles; retail sale of automotive fuel; Wholesale trade and commission trade, except of motor vehicles and motorcycles; Retail trade, except of motor vehicles and motorcycles; repair of personal and household goods; Hotels & catering; Inland transport;Water transport; Air transport; Supporting and auxiliary transport activities; activities of travel agencies.


![A case report of tinea capitis in infant in first year of life [*N.Mandras and J.Roana contributed equally to this work]](data:image/gif;base64,R0lGODlhAQABAIAAAP///wAAACH5BAEAAAAALAAAAAABAAEAAAICRAEAOw==)