Agriculture and land use are responsible for about 25% of the global greenhouse gas (GHG) emissions (IPCC 2014). Crop residue management is critical to agroecosystems, transferring nutrients within and between rotations and it is of significant impor-tance in improving nutrient turnover and soil fertility, affecting especially microbial activity and thus carbon (C) and nitrogen (N) dynamics, and GHGs emis-sions (Rees et al. 2013). A number of soil properties are important in controlling residue decomposition, including porosity, pH, texture, moisture content, temperature and oxygen diffusivity, all of which regu-late soil connectivity and thus also GHGs emissions
(Badagliacca et al. 2017, Song et al. 2019). Together with soil properties, placement of residues can have strong effects on their decomposition and GHGs emis-sions to the atmosphere (Tang et al. 2015, Jahanzad et al. 2016). Several experiments have highlighted that the location of crop residues can influence physical, chemical and biological properties of soil microsites (Giacomini et al. 2007) and also that crop residue characteristic, other than the C : N ratio, are implied in such changes (Jahanzad et al. 2016), leading to variable and often contradictory results (Nicolardot et al. 2007, Maisto et al. 2010, Han et al. 2017). The same uncertainties in decomposition are associated
Vertisols and Cambisols had contrasting short term greenhouse
gas responses to crop residue management
Giuseppe Badagliacca
1,2*, Robert Martin Rees
3, Dario Giambalvo
2, Sergio Saia
4 1Department of Agraria, Mediterranean University of Reggio Calabria, Reggio Calabria, Italy 2Department of Agricultural, Food and Forest Sciences, University of Palermo, Palermo, Italy 3Scotland’s Rural College, Edinburgh, UK4Council for Agricultural Research and Economics (CREA), Research Centre for Cereal
and Industrial Crops (CREA-CI), Vercelli, Italy & Research Centre for Engineering and Agro-Food Processing (CREA-IT), Monterotondo (Roma), Italy
*Corresponding author: [email protected]
Citation: Badagliacca G., Rees R.M., Giambalvo D., Saia S. (2020): Vertisols and Cambisols had contrasting short term green-house gas responses to crop residue management. Plant Soil Environ., 66.
Abstract: In sustainable agriculture crop residues management should consider the interactions between soil and
residue properties, which can affect the decomposition and global greenhouse gases (GHGs) emission. Through a laboratory experiment, we investigated the effect of the management (incorporation and surface placement) of wheat and faba bean residues on their decomposition and CO2, CH4 and N2O emissions from two soils, a Chromic Vertisol and an Eutric Cambisol. In the Vertisol, wheat residues increased the CO2 emission more than faba bean when left on the surface whereas no differences among residues were observed when incorporated. In the Cambisol, faba bean emitted more than wheat when left in the surface and less when incorporated. Total CH4 emissions were higher in faba bean in Cambisol for both management and only when applied in the surface in Vertisol. Total N2O emission in the Vertisol was higher when faba bean was incorporated, and wheat was left on the surface. In the Cambisol, wheat addition increased total N2O emissions by 20% compared to faba bean, with no differences between managements. Our study confirmed that contrasting properties among tested soils resulted in significant interactions with residues own degradability and their placement affecting residue decomposition, soil C and N dynamics, and GHGs emission.
Keywords: sustainable management; carbon dioxide; nitrous oxide; methane; soil texture
with GHGs production and in particular for N2O emissions (Baggs et al. 2003, Nett et al. 2016). In a previous study, Badagliacca et al. (2017) had shown that, when crop residues were buried, straw and soil properties may interact each other leading to different levels of CO2 and N2O emission. Therefore, starting from those observations, in this study we focused on the role of residue placement on short-term emissions of CO2, CH4 and N2O in a Chromic Vertisol with a high clay, pH, and inorganic C content and an Eutric Cambisol with a sandy-loam texture, low clay and pH. We hypothesised that variation in the soil availability of substrates for microbes (dissolved organic C, am-monium and nitrate) and the subsequent emissions of GHGs (CO2, CH4 and N2O) would be affected by the interaction between soil type, residue types with similar C : N ratio, and their placement (incorporated or left on the surface). In particular, we hypothesised that degradation and emission could be stimulated by incorporation in the Cambisol, due to the higher soil organic matter concentration capable to supporting a wider soil microbial community and the sandy-loam texture which allows for greater aeration and displace-ment of the gases, whereas in the Vertisol, higher GHGs emission fluxes should be associated with the surface application, rather than incorporation, due to the higher organic matter physico-chemical protec-tion from clay that could promote its stabilisaprotec-tion and the finer soil particles that could limit soil micropore and aeration. It was also assumed that wheat residues should lead to higher GHGs emission than faba bean residues due to its higher degradability (low lignin), allowing greater interaction with placement.
MATERIAL AND METHODS
Experiment setup. A pot experiment was
estab-lished under controlled conditions in a completely randomised factorial design with three replicates. Treatments tested were: soil type (Eutric Cambisol and Chromic Vertisol; WRB 2014); plant residue species (durum wheat, Triticum durum Desf. (Wh), and faba bean, Vicia faba L. (Fb)); residue placement (incorporated in the soil volume (Inc) or distributed evenly over the soil surface (Sur)). Soils were collected from the top 20 cm of an experimental site at the Bush Estate (55°51'N, 3°12'W; 199 m a.s.l.) near Edinburgh (Scotland, UK) and from the Pietranera Farm (37°30'N, 13°31'E; 178 m a.s.l.) in Santo Stefano Quisquina (Sicily, Italy), respectively for Cambisol and Vertisol. At both sites, the soil was collected in conventional
tilled experimental plots previously cultivated with cereals. The main properties of soils used in the study are presented in Table 1. Before establishing the experiment, each soil was air-dried, sieved, and visible roots and raw organic residues removed, and then the soil was thoroughly mixed. The water hold-ing capacity of both soils was determined on a mass basis. Pots used for the experiment had a diameter of 10 cm and a height of 15 cm and were filled with 1.5 kg of soil to achieve a bulk density of 1.25 g/cm3.
Oven-dried crop biomass of durum wheat (Triticum durum Desf. cv. Simeto) and faba bean (Vicia faba L. cv. Gemini) cultivated at Pietranera farm, was ground, mixed, and used as crop residues according to the treatments: mixed in the soil volume or distributed evenly over the soil surface at a rate of 5 g crop residue per kg of soil. For both soils, control pots have been prepared without the addition of residues. Soils were brought to 60–70% of the water holding capacity at the beginning of the experiment and the moisture content was maintained constant during the whole experiment adding to each pot an amount of water corresponding to the evaporation losses after each measurement interval. The main proper-ties of the residues used are presented in Table 2. Soils were incubated for 7 weeks in a naturally lit greenhouse where the temperature was maintained between 20 °C and 22 °C.
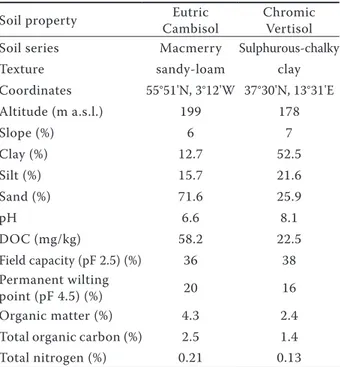
Table 1. The site and soil properties
Soil property CambisolEutric Chromic Vertisol Soil series Macmerry Sulphurous-chalky
Texture sandy-loam clay
Coordinates 55°51'N, 3°12'W 37°30'N, 13°31'E Altitude (m a.s.l.) 199 178 Slope (%) 6 7 Clay (%) 12.7 52.5 Silt (%) 15.7 21.6 Sand (%) 71.6 25.9 pH 6.6 8.1 DOC (mg/kg) 58.2 22.5 Field capacity (pF 2.5) (%) 36 38 Permanent wilting point (pF 4.5) (%) 20 16 Organic matter (%) 4.3 2.4
Total organic carbon (%) 2.5 1.4
Total nitrogen (%) 0.21 0.13
Soil GHGs fluxes and soil chemical measure-ments. Measurements of CO2, CH4 and N2O emis-sions were made three times per week on 22 sampling occasions with Photoacoustic Gas Analyser (PGA, INNOVA 1412, LumaSense Technologies A/S, Santa Clara, USA). At each sampling time, emissions from pots were randomly measured between the 9.00 and 12.00 a.m. The PGA was connected by two small rubber pipes to a PVC chamber with a diameter of 10 cm (surface 78.5 cm2) and a height of 10 cm and
sealed above the pot by a rubber gasket to ensure a gas-tight seal between pot and chamber. The PGA instrument was calibrated in the lab for CO2, CH4 and N2O by the LumaSense and its detection limits were of 1.5 ppm for CO2, 0.55 ppm for CH4 and 0.03 ppm for N2O. The instrument sampled the air from inside the chamber and performed the analysis with a 5-sec-ond sampling integration time and a fixed flushing time between measurements (8 s). The equipment performed built-in compensation for water and cross interferences among target gases. Each sampling and GHGs (CO2, CH4 and N2O) concentration measure-ment taken approximately 70 s and each measuremeasure-ment was made every 2 min. Four measurements per pot were carried out. Soil CO2, CH4 and N2O fluxes were calculated by linear regression of gas concentration increase inside the chamber over the closing time corrected for the chamber air temperature accord-ing to Jantalia et al. (2008) and Vitale et al. (2018):
where: ∆C/∆t – gas increment during the chamber closure; V – volume of the chamber; A – soil area; m – molecular
weight of the gases and Vm – gas molar volume corrected for the ambient temperature. The total amount of CO2, CH4 and N2O emissions were calculated by linear interpolation between consecutive sampling events using the following equation (Cheng et al. 2012):
where: F – GHG flow at the ith measurement; (t
i+1 – ti) –
time length between two adjacent measurements and
n – total measurement number. Finally, total CH4 and N2O emission were multiplied by, respectively, 25 and 298 in order to calculate their CO2 equivalent.
At the end of the experiment, two soil layers from each pot were separated, one from the top to 5 cm depth and the other from the 5 cm to 15 cm depth. The soil from each layer was mixed, and a sample was collected and analysed for pH, dissolved organic C (DOC), ammonium (NH4+-N) and nitrate (NO
3–-N)
concentration. Soil pH was measured in a 1 : 5 (v/v) suspension of soil in water. Soil DOC concentra-tion was determined extracting the samples using deionised water with soil to water ratio of 1:10 for 1 h at 100 rpm. Then, the extracts were centrifuged at 20 000 g for 10 min and filtered through a 0.45 µm pore-size membrane (cellulose nitrate) to remove particulate C. Finally; the extracts were analysed by a total organic C analyser (DC-80, Rosemount Analytical Inc., Anaheim, USA) after the removal of inorganic C by acidifying the sample. Concentrations of NH4+-N and NO3–-N were determined from 10 g of soil extracted with 100 mL of 2 mol/L KCl (1 : 10 ratio); then the filtered extract NH4+-N and NO
3–-N concentrations were measured by
a continuous flow autoanalyser (San System, Skalar Analytical B.V., Breda, The Netherlands).
Calculations and statistical analysis. Significance
of the fixed effects of soil type, plant residue spe-cies, residue placement and their interactions were analysed using the generalised linear mixed model (GLMM) by the GLIMMIX procedure embedded in SAS software (SAS Institute, Cary, USA). Tukey’s HSD (honestly significant difference) test at P < 0.05 was used for pairwise multiple comparisons of treat-ments means. Reported data of soil chemical proper-ties are mean values (n = 3) expressed on dry weight (DW) basis (105 °C), while, reported GHGs measures are the arithmetic means (n = 3) ± standard error. To study the relationship between the investigated soil variables and the soil total GHGs (CO2, CH4 and N2O) emission, Pearson’s correlation coefficients Table 2. Chemical and fibre composition of the crop
residues (%)
Chemical property Durum wheat Faba bean
Organic matter 92.1 91.8
Carbon 39.6 41.0
Nitrogen 1.3 1.4
Crude protein 8.1 8.8
Ether extract 1.7 1.1
Acid detergent fibre 28.8 48.0
Acid detergent lignin (ADL) 3.5 10.0
Cellulose 25.3 38
Neutral detergent fibre 45.4 54.0
Hemicellulose 16.6 6 Ash 7.9 8.2 ADL ash 3.2 0.4 (1) f =∆C∆t ×VA × Vm m (2)
Cumulative CO2 or CH4 or N2O emission = �(Fi+ Fi+1)/2 × (ti+1− ti) n
i=1
× 24 Cumulative CO2 or CH4 or N2O emission = �(Fi+ Fi+1)/2 × (ti+1− ti)
n i=1 × 24 Cumulative CO2 or CH4 or N2O emission = (Fi + Fi+1)/2 × (ti+1 – ti) × 24 n i=1
were calculated by using Proc CORR in SAS v9.2 environment.
RESULTS AND DISCUSSION
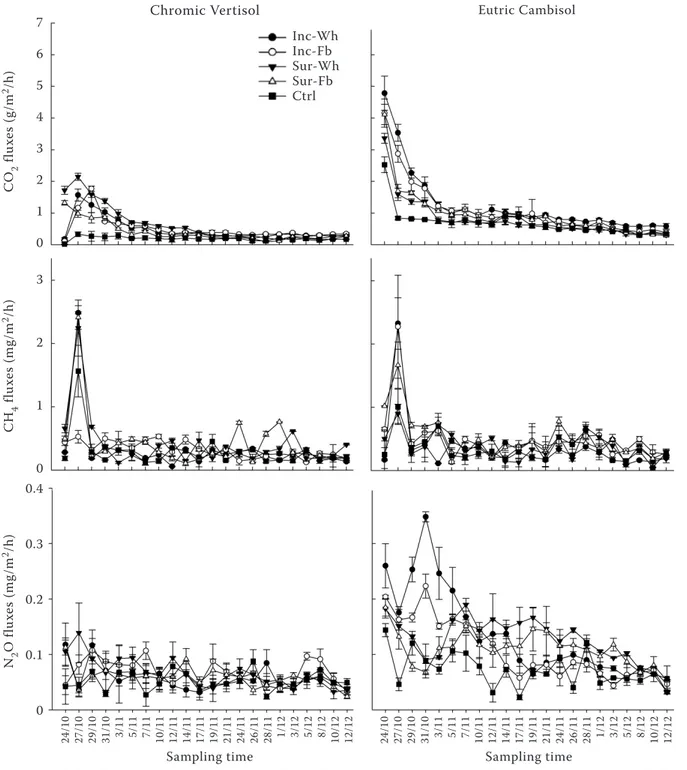
Soil CO2 fluxes during the experiment ranged from a value of 0.01 g/m2/h to 2.35 g/m2/h in the
Vertisol and from 0.22 g/m2/h to 5.79 g/m2/h in the
Cambisol (Figure 1). In general, residue addition increased total CO2 emissions more in the Vertisol (+154%) than from the Cambisol (+42%). Crop resi-due placement and type increased total soil CO2 emissions differently in the two soils (soil × residue placement × residue type, P < 0.0001). In particu-lar, in the Vertisol, Wh residues increased the total CO2 emission more than faba bean when left on the
Figure 1. Soil CO2, CH4 and N2O emission fluxes from Chromic Vertisol and Eutric Cambisol amended with faba bean (Fb) and wheat (Wh) residues, incorporated (Inc) or left on the surface (Sur), or unamended (Ctrl) during the experimental period. Data are means ± standard error (n = 3)
Chromic Vertisol Eutric Cambisol
C O2 fl ux es (g /m 2/h ) C H4 fl ux es (m g/ m 2/h ) N2 O fl ux es (m g/ m 2/h ) 7 6 5 4 3 2 1 0 3 2 1 0 0.4 0.3 0.2 0.1 0
Sampling time Sampling time
Inc-Wh Inc-Fb Sur-Wh Sur-Fb Ctrl 24 /1 0 27 /1 0 29 /1 0 31 /1 0 3/ 11 5/ 11 7/ 11 10 /1 1 12 /1 1 14 /1 1 17 /1 1 19 /1 1 21 /1 1 24 /1 1 26 /1 1 28 /1 1 1/ 12 3/ 12 5/ 12 8/ 12 10 /1 2 12 /1 2 24 /1 0 27 /1 0 29 /1 0 31 /1 0 3/ 11 5/ 11 7/ 11 10 /1 1 12 /1 1 14 /1 1 17 /1 1 19 /1 1 21 /1 1 24 /1 1 26 /1 1 28 /1 1 1/ 12 3/ 12 5/ 12 8/ 12 10 /1 2 12 /1 2
surface (+221%, and +89%, respectively), whereas no differences between residues were found when incorporated (+152% compared to the control, on average) (Figure 2A). In the Cambisol, Fb emitted more than Wh when left in the surface and less than Wh when incorporated (Figure 2A).
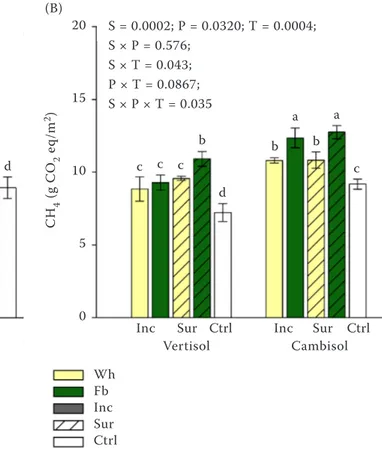
Methane emission fluxes ranged from 0.003 to 3.25 mg/m2/h with values of 0.02–2.73 mg/m2/h in
the Vertisol and 0.003–3.25 mg/m2/h in the Cambisol
(Figure 1). Total CH4 emission was affected by the interaction among soil, residue type and its placement (soil × residue placement × residues type, P > 0.05). In Vertisol, small differences were observed between treatments, and only surface application of faba bean residues showed higher values (+18%, on average). On the contrary, in Cambisol, marked differences
were observed only between the residues types with higher emission in faba bean than in wheat treat-ments (+16%, on average) (Figure 2B).
Nitrous oxide fluxes during the experiment ranged from 0.02 to 0.35 mg/m2/h, with values of 0.02–0.14 mg/
m2/h in the Vertisol and 0.02–0.35 mg/m2/h in the
Cambisol (Figure 1). There were significant interac-tions in soil N2O emission resulting from placement and soil type (soil × residue placement × residues type, P > 0.01). In particular, in this soil, the Inc-Fb and Sur-Wh treatments showed higher N2O emissions (+18%) than Inc-Wh and Sur-Fb. In the Cambisol, Wh addition increased total N2O emissions by 81% (+20% than Fb) and Fb by the 51% respect to the control, with no differences by the residue place-ment (Figure 2C).
Figure 2. (A) Soil total CO2 emission; (B) soil total CH4 emission and (C) soil total N2O emission from Chromic Vertisol and Eutric Cambisol amended with faba bean (Fb) and wheat (Wh) residues, incorpo-rated (Inc) or left on the surface (Sur), or unamended (Ctrl). Data are means ± standard error (n = 3). Treat-ments with a letter in common are not different at a Tukey’s test at P-value ≤ 0.05. S – soil type; P – residue placement; T – residue type
C O2 (g /m 2) (A) (B) (C) N2 O (g C O2 e q/ m 2) C H4 (g C O2 e q/ m 2) Wh Fb Inc Sur Ctrl 1 800 1 600 1 400 1 200 1 000 800 600 400 200 0 60 50 40 30 20 10 0 20 15 10 5 0 Inc Sur Ctrl
Vertisol IncCambisolSur Ctrl
Inc Sur Ctrl
Vertisol IncCambisolSur Ctrl d e e f g a b b c d b c c c d c a a b b b b a a c c c d d e S = < 0.001; P = 0.002; T = 0.007; S × P = 0.001; S × T = < 0.0001; P × T = 0.224; S × P × T = < 0.0001 S = 0.0002; P = 0.0320; T = 0.0004; S × P = 0.576; S × T = 0.043; P × T = 0.0867; S × P × T = 0.035 S = < 0.0001; P = 0.457; T = 0.002; S × P = 0.441; S × T = < 0.001; P × T = 0.352; S × P × T = 0.003
The soils studied in this experiment were chara- cterised by contrasting properties resulting in sig-nificant differences (P ≤ 0.002) in their responses (Table 3) in term of pH, DOC and concentration of mineral N forms. And, as described above, with further consequences on GHGs emission.
Crop residue addition had no effect on soil pH of Vertisol regardless of the residue placement. On the contrary, in Cambisol surface application (either for Wh and Fb) and Wh incorporation resulted in a significant strong reduction of pH (–0.5 pH value, on average) in comparison with Fb and control pots (soil × residue placement × residues type, P < 0.05) (Tables 3 and 4). This property of the soil control nutrients availability, influence the chemical reac-tions and can be a useful indicator of soil biochemi-cal processes. In particular, if due to the high soil pH buffering capacity related to its cation exchange capacity, clay texture and carbonate concentration (Luo et al. 2015) no effects were observed in Vertisol, in Cambisol the reduction of soil pH can be related to the soil C and N dynamics and especially to the N mineralisation. Indeed, soil pH reduction was associated with higher NO3–-N concentration
at-testing higher mineralisation that could acidify soil by the release of H+ ions (Chen et al. 2019). This
evidence proves that the rapid residue mineralisa-tion was favoured in this kind of soil when residues were left on the surface and when higher degradable
wheat was buried. As a consequence, significant correlations between soil pH variations and GHGs emission were found in Cambisol but limited to the incorporation treatment (Table 5). With this regard, Johnson-Beebout et al. (2009) showed that such variation in pH, which is linked to soil redox status, are conducive to the N2O emissions. In particular, the higher interaction between soil pH (for both soil layers) and residues were significant when the residues were incorporated into the soil showing a negative correlation between pH and CO2 and N2O and positive with CH4 emission (Table 5).
Crop residue placement and type had different ef-fects on DOC concentrations in the 0–5 cm soil layer of the two soils (soil × residue placement and soil × resi-due placement × resiresi-dues type, P < 0.0001) (Table 3). In the Vertisol, DOC concentrations increased (+27.4%) comparing to the control where residues were incorporated but not when left on surface; in the Cambisol, Fb residues did not show differences between placements whereas Wh had the highest DOC concentration when left on the surface and the lowest when incorporated into the soil. In the deeper layer, both soils showed a similar pattern of DOC concentrations between residues placement showing higher values when incorporated than when left on the surface (+78% in Vertisol and +21% in Cambisol). Within placement, in both soils no differences were observed in surface application among residue types, Table 3. Results of the statistical analysis for the effects of soil type (S), residues management (M), and residue type (T) and their interactions on the variability of soil pH, dissolved organic carbon (DOC), NH4+-N and NO3–-N concentration in 0–5 cm and 5–15 cm soil layers of Chromic Vertisol and Eutric Cambisol soils
P-values
soil (S) placement (P)residue residue type (T) S × P S × T P × T S × P × T 0–5 cm soil layer pH < 0.0001 0.113 0.017 0.002 0.023 0.311 0.034 DOC < 0.0001 0.070 0.816 < 0.0001 0.300 0.006 < 0.0001 NH4+-N 0.002 < 0.0001 < 0.0001 < 0.0001 0.114 0.001 < 0.0001 NO3–-N < 0.0001 < 0.0001 < 0.0001 < 0.0001 < 0.0001 < 0.0001 0.125 NH4+-N : NO3–-N < 0.0001 < 0.0001 0.009 < 0.0001 0.009 0.011 0.011 5–15 cm soil layer pH < 0.0001 0.525 0.329 0.003 0.358 0.012 0.005 DOC < 0.0001 < 0.0001 0.223 < 0.0001 0.220 0.019 0.025 NH4+-N < 0.0001 < 0.0001 < 0.0001 < 0.0001 < 0.0001 < 0.0001 < 0.0001 NO3–-N < 0.0001 < 0.0001 0.005 < 0.0001 < 0.0001 < 0.0001 < 0.0001 NH4+-N : NO 3–-N < 0.0001 < 0.0001 < 0.0001 < 0.0001 < 0.0001 < 0.0001 < 0.0001 P-values from PROC GLIMMIX model
but when incorporated Wh had higher DOC concen-trations (+9%, on average) than Fb, regardless of the soil type (soil × residue placement, P < 0.0001; soil × residue placement × residues type, P < 0.05) (Tables 3 and 4). Crop residue type and placement had strong effects on DOC concentrations of both soil layers in both soil types, with differences associated with the residue placement in terms of C availability. These
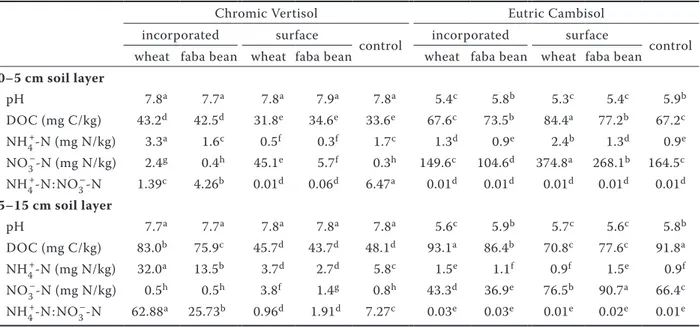
differences mostly occurred in the Cambisol when wheat residues were added. Such effects have also been reported by Abalos et al. (2013) and were likely a consequence of the high degradability of the wheat compared to the faba bean residues. Indeed, also in our experiment wheat had higher ether extractable C, more hemicellulose and a correspondingly lower fraction of fibre and lignin compared to the faba bean Table 4. Effect of crop residues type and placement (durum wheat or faba bean, and unamended control, incor-porated or left in the surface) on pH, dissolved organic carbon (DOC), NH4+-N and NO3–-N concentration in 0–5 cm and 5–15 cm soil layers of Chromic Vertisol and Eutric Cambisol soils
Chromic Vertisol Eutric Cambisol
incorporated surface
control incorporated surface control wheat faba bean wheat faba bean wheat faba bean wheat faba bean 0–5 cm soil layer pH 7.8a 7.7a 7.8a 7.9a 7.8a 5.4c 5.8b 5.3c 5.4c 5.9b DOC (mg C/kg) 43.2d 42.5d 31.8e 34.6e 33.6e 67.6c 73.5b 84.4a 77.2b 67.2c NH4+-N (mg N/kg) 3.3a 1.6c 0.5f 0.3f 1.7c 1.3d 0.9e 2.4b 1.3d 0.9e NO3–-N (mg N/kg) 2.4g 0.4h 45.1e 5.7f 0.3h 149.6c 104.6d 374.8a 268.1b 164.5c NH4+-N : NO 3–-N 1.39c 4.26b 0.01d 0.06d 6.47a 0.01d 0.01d 0.01d 0.01d 0.01d 5–15 cm soil layer pH 7.7a 7.7a 7.8a 7.8a 7.8a 5.6c 5.9b 5.7c 5.6c 5.8b DOC (mg C/kg) 83.0b 75.9c 45.7d 43.7d 48.1d 93.1a 86.4b 70.8c 77.6c 91.8a NH4+-N (mg N/kg) 32.0a 13.5b 3.7d 2.7d 5.8c 1.5e 1.1f 0.9f 1.5e 0.9f NO3–-N (mg N/kg) 0.5h 0.5h 3.8f 1.4g 0.8h 43.3d 36.9e 76.5b 90.7a 66.4c NH4+-N : NO3–-N 62.88a 25.73b 0.96d 1.91d 7.27c 0.03e 0.03e 0.01e 0.02e 0.01e Within a row, treatments with a letter in common are not different at a Tukey’s test at P-value < 0.05
Table 5. Pearson’s correlation coefficients between soil chemical variables and total soil global greenhouse gas (GHG) (CO2, CH4 and N2O) emission in the different soil type and crop residue management
Chromic Vertisol Eutric Cambisol
incorporated surface incorporated surface
CO2 CH4 N2O CO2 CH4 N2O CO2 CH4 N2O CO2 CH4 N2O 0–5 cm DOC –0.55 0.18 –0.26 –0.68 0.48 –0.51 –0.89 0.67 –0.71 –0.67 –0.86 0.86 pH –0.16 –0.32 –0.16 –0.15 0.18 –0.19 –0.92 0.96 –0.96 –0.24 –0.09 0.05 NH4+-N –0.30 –0.18 –0.82 0.62 –0.81 0.25 0.94 –0.86 0.88 –0.73 –0.81 0.84 NO3–-N –0.12 –0.09 –0.80 0.95 –0.77 0.82 0.82 –0.94 0.96 –0.62 –0.77 0.77 5–15 cm DOC 0.45 0.09 –0.07 0.31 0.01 0.59 0.81 –0.90 0.88 0.99 0.66 –0.82 pH –0.18 –0.18 –0.17 –0.06 0.15 –0.34 –0.87 0.93 –0.93 –0.50 –0.86 0.77 NH4+-N –0.07 –0.19 –0.76 0.93 –0.75 0.94 0.79 –0.79 0.85 0.66 0.84 –0.85 NO3–-N 0.30 –0.15 0.38 0.97 –0.78 0.79 0.73 –0.77 0.83 0.65 0.79 –0.83 CO2 – 0.43 0.41 – –0.65 0.86 – –0.83 0.87 – 0.69 –0.85 CH4 0.43 – 0.05 –0.65 – –0.56 –0.83 – –0.97 0.69 – –0.93 N2O 0.41 0.05 – 0.86 –0.56 – 0.87 –0.97 – –0.85 –0.93 – Significant values are shown in bold (P-value < 0.05); DOC – dissolved organic carbon
residues. The different availability of easily acces-sible labile carbon forms (DOC) was accompanied to significant effects on GHGs emissions (Wilson et al. 2016, Badagliacca et al. 2017). Crop residues increased CO2 emissions but by different amounts in the two soils, with a clear and positive correla-tion between DOC availability and/or consumpcorrela-tion (lower levels at the end of the experiment) and the total CO2 emitted in both soils, as also reported by Begum et al. (2014) and Lou et al. (2007) (Table 5). The relatively low respiration rate of the Vertisol is likely to have been a consequence of protection of SOC pools by the higher clay content (Han et al. 2017) and Ca-SOC stabilisation (Shevtsova et al. 2003) coupled with relatively low soil microbial activity due to low C substrate availability, as also demonstrated by Dang et al. (2017) in two contrast-ing soils. Even so, among the tested soils, a higher increase of CO2 emission was observed in Vertisol compared to Cambisol, leading to suppose that in this soil a smaller amount of organic matter avail-able was involved in a respiration dynamics led by a soil microbial community characterised mainly by oligotrophic R-strategist microorganisms and low resource efficiency (Ali et al. 2018).
With regard to NH4+-N concentration, in the 0–5 cm layer, contrasting responses among soils were ob-served (soil × residue placement × residues type, P < 0.0001) (Table 3). In particular, in the Vertisol residue incorporation resulted in a higher NH4+-N concentration than surface application (2.5 vs. 0.4 mg N/kg) with higher values in Wh than Fb, whereas no differences between residue types were observed in the surface application, which showed an NH4+-N concentration 76% lower than the control. In the Cambisol, the highest NH4+-N concentration was observed in Sur-Wh, followed by Inc-Wh and Sur-Fb (–48%, on average), whereas the lowest concentra-tion was observed for Inc-Fb (–62%). In the deeper soil layer (5–15 cm), the Vertisol showed a similar response to the surface layer (Inc-Wh > Inc-Fb > Sur-Wh and Sur-Fb) in term of NH4+-N, while in the Cambisol, concentrations in Inc-Wh and Sur-Fb were greater than (+49%) Inc-Fb and Sur-Wh (Table 4).
Soil NO3–-N concentration in both the 0–5 cm and
5–15 cm soil layers showed an opposite pattern com-pared to the NH4+-N concentration, with surface
ap-plication of residues increasing nitrate concentration more than residue incorporation and lesser differences by the soil. In particular, soil NO3–-N concentration in the 0–5 cm soil layer showed a similar response
between soils (soil × residue placement × residues type, P > 0.05) with higher values in Sur than in Inc and within each placement, Wh was greater than Fb. In the 5–15 cm soil layer, in both soils, higher NO3–-N concentrations were observed in the surface appli-cation (+397% in Vertisol and +108% in Cambisol) than the following incorporation while within each placement major differences between residues types were observed among soils (soil × residue placement × residues type, P < 0.0001). In the Vertisol Sur-Wh NO3–-N concentration was greater than (+173%)
Sur-Fb, whereas in the Cambisol a contrasting response between placement treatments was observed with Fb having greater NO3–-N concentration (+19%) than Wh in Sur while Wh (+17%) was greater than Fb in Inc treatment (Table 4). The release of NH4+-N and NO3–-N from organic residues by mineralisation and
nitrification processes can be an indication of the intensity of these processes in the soil. Indeed, in addition to the DOC concentration, low mineral N (NO3–-N plus NH
4+-N) concentration, especially
NO3–-N, in the Vertisol compared to the Cambisol, suggest reduced mineralisation from the added or-ganic material (Hijbeek et al. 2018). Soil mineral N concentration is paramount to microbial growth and respiratory processes, and moreover is one of the main factors that determine nitrous oxide emis-sion from soil (Oertel et al. 2016). With this regard, in Vertisol significant correlations were observed between mineral N forms (for both soil layers inves-tigated) and GHGs emission when residues were left into the surface showing positive Pearson’s coefficient for CO2 and N2O and negative for CH4. When the residues were incorporated, only the correlations with N2O were observed (Table 5). In Cambisol, crop residues incorporation highlighted, for both soil layers investigated, positive correlation between N mineral forms and CO2 and N2O total emission while negative correlations were observed for CH4. A different pattern was observed when residues were left on the soil surface with positive correlations for CO2 and CH4 while were negative for N2O (Table 5). Differences among soil variables directly resulted in opposite trends, in our experiment, in gaseous emissions between residues type and placement. In particular, the placement of crop residues in the Vertisol resulted in very different patterns of C dy-namics in the different soil layers. In the surface application, the reduced interaction between resi-dues and soil led to CO2 emissions being driven by residue type and its degradability. However, when
residues were incorporated, the role of soil proper-ties was dominant in controlling the response. The concentrations of DOC and NH4+-N were higher
where residues were incorporated than when they remained at the surface, and it is possible to as-sume that residue incorporation, particularly in the Vertisol, reduced substrate availability to microbes through fixation of available C and N. In theory, higher substrate availability should have induced a higher respiration rate. However, we found that the absolute difference in the soil respiration of the Vertisol was lower when residues were incorpo-rated than when left on the surface if compared to control. Such a discrepancy may have arisen from the ability of clay to slow down the organic matter decomposition by absorption, interacting with soil microbes and their external enzyme activity or by limiting oxygen diffusion and CO2 release (Vogel et al. 2015, Datta et al. 2019). And indeed, higher DOC was associated with higher respiration in the sandy Cambisol compared to the clay Vertisol. According to this interpretation, Li et al. (2013) and Datta et al. (2019) found higher emissions for residues placed on the soil surface than for incorporated residues as was the case in our experiment with the Vertisol. This indicates that the incorporation of residues into the soils in our study inhibited CO2 release, by modifying the availability of resources and oxygen to decomposers and gaseous diffusion from soil pores to the atmosphere.
In the Cambisol, soil CO2 total emission was linked to DOC concentration in the topsoil and lesser differenc-es of DOC concentration between topsoil and subsoil if comparing to the Vertisol were found. This indicates a more rapid translocation of the DOC from the subsoil to the topsoil, which may have fed the C emissions. For this soil type, our study agrees with Giacomini et al. (2007), who showed more rapid de-composition and higher CO2 emissions from residue incorporation. In particular, residue incorporation stimulated emission from the more degradable wheat residues. By contrast, in the Cambisol, the differ-ences between DOC concentrations and the total emissions between residue type in soil respiration suggest that CO2 release from deeper soil layers may have contributed to the total soil CO2 emission. When residues were applied to the surface, although signifi-cant, moderate differences were observed between residue type. This evidence indicates an inhibition of residue decomposition occurring following surface application. The reduction of decomposition and CO2
emission from residues applied on the soil surface, as argued by Giacomini et al. (2007) and Bremer et al. (1991), can be ascribed to reduced contact between residues and the soil.
What has been observed with regard to residue decomposition, soil respiration and oxygen concentra-tion had consequences on methane fluxes and total emission, as postulated by Ball (2013) and Tang et al. (2015). In particular, in Vertisol it is possible to hypothesise that lower respiration in Sur-Fb, due to the low degradability of this kind of organic mat-ter, leads to higher CH4 emission as a consequence of the concomitant late residue decomposition in a low oxygen environment, as shown in Figure 1. In the same way, in Cambisol, CH4 total emission was almost correlated with CO2 emission, indicating how the reduction of available oxygen in the soil has resulted in the subsequent release of methane (Figure 1). However, it is important to highlight, as shown by the correlation analysis (Table 5), that the total CO2 and CH4 emission when crop residues were left on the soil surface in Vertisol or were buried in Cambisol showed a negative correlation between them. This behaviour could be a result of soil metha-nogenic microorganism’s community damage due to an indirect C starvation related to competition for substrates with aerobic microorganisms (Segers 1998).
With regard to N2O emission, Velthof et al. (2002) observed higher N2O emissions in sandy soil than in clay soil, in an incubation experiment studying crop residue decomposition, in accordance with the results we observed. As reported by Taylor and Townsend (2010) and Song et al. (2019), soil deni-trification is controlled by C and NO3–-N availability under anoxic conditions or low O2 availability. As a consequence, in Cambisol, a small variation in the absolute values of DOC and nitrate were likely to have enhanced N2O emissions, which could have depended on both C and NO3–-N availability for microbes. Indeed, although no differences were observed between residues management treatments on N2O emission, these results were a consequence of soil properties driving different processes of resi-due decomposition, confirmed by the positive cor-relations shown in Table 5. In particular, following surface application. N2O total emissions were related to NO3–-N concentration in the 0–5 cm soil layer, and thus on substrate N availability, in the deeper soil layer lower nitrate concentrations, suggest a stronger link with CO2 emission and the formation of anoxic microsites inside soil pores where microbes
denitrify (r = 0.87, Table 5) (Nett et al. 2016). In the same way, the same dynamics could be observed in the Vertisol where the differences between treat-ments, although significant, were less important. This finding regarding N2O emissions was also ob-served by de Ruijter et al. (2010) with leek, broccoli and sugar beet residues and Nett et al. (2016) in an experiment using cauliflower residues. According to these authors, surface application of crop residues doesn’t limit microbial activity, because the first cm of soil is characterised by high biological reactivity and by favourable conditions for either aerobic or anaerobic microbial communities.
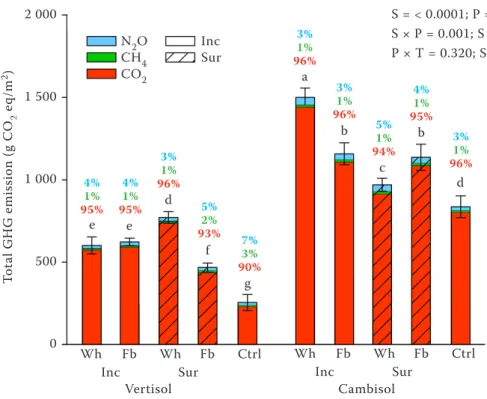
Total soil GHGs emission, the result of the sum of CO2, CH4 and N2O emitted within the experimental period, for both tested soils and each treatment are presented in Figure 3. In general, CO2 emission rep-resents about 90–96% of the total GHGs emission, whereas N2O and CH4 shown an incidence of about 4.1% and 1.5%, respectively. Although no differences among the two tested soils were observed with regard to CO2, N2O emission percentage was slightly higher in Vertisol than in Cambisol. Total soil GHGs emis-sion following the emisemis-sion of each gas, and especially
CO2, was significantly affected by the interaction between soil characteristics, type of residue and its management (soil × residue placement × residue type, P < 0.0001). In the Vertisol, surface application leads to achieving the highest and lowest total GHGs emission for Wh (+202% compared to the control) and Fb (+83% compared to the control), respectively. Moreover, among these treatments, a higher incidence of CH4 and N2O emissions were observed in Fb (2% for CH4 and 5% for N2O) than in Wh (1% for CH4 and 3% for N2O). An intermediate level of total emission has been observed when residues were incorporated with no difference between residues types (+140% compared to the control) (Figure 3). In the Cambisol, a contrasting trend was observed when Wh residue was applied showing the highest emission when left on the soil surface (+79% compared to the control) and the lowest when buried (+16% compared to the control). Among these treatments, a higher inci-dence of N2O emission was observed in incorporation compared to the surface application (5% vs. 3%). Fb residue application leads to an intermediate GHGs emission among Wh residues (+27% compared to the control) (Figure 3).
Figure 3. Soil total greenhouse gases (GHGs) emission (CO2 + CH4 + N2O) from Chromic Vertisol and Eutric Cambisol amended with faba bean (Fb) and wheat (Wh) residues, incorporated (Inc) or left on the surface (Sur), or unamended (Ctrl). Data are means ± standard error (n = 3). The percentage value above the bar indicates the relative weight of that gas compared to the total GHGs emission. Treatments with a letter in common are not different at a Tukey’s test at P-value ≤ 0.05. S – soil type; P – residue placement; T – residue type
To ta l G H G e m is si on (g C O2 e q/ m 2) 2 000 1 500 1 000 500 0 Vertisol c Cambisol Inc Wh Fb Wh Fb Ctrl
Sur WhIncFb WhSurFb Ctrl
e e d d f g a b b S = < 0.0001; P = 0.002; T = 0.004; S × P = 0.001; S × T = < 0.0001; P × T = 0.320; S × P × T = < 0.0001 4% 1% 95% 4% 1% 95% 3% 1% 96% 5% 2% 93% 7% 3% 90% 3% 1% 96% 3% 1% 96% 5% 1% 94% 4% 1% 95% 3% 1% 96% N2O CH4 CO2 Inc Sur
Our study demonstrated how crop residue decom-position may have different effects on soil properties depending on the management applied, degradability of the residue, and the type of soil that will receive the residue. We also showed that the effects of residue type on soil properties were strong and differed by the soil layer. This occurred despite the residues having similar C : N ratios, which contributed to the observed effects of the residue type on GHGs emission. In par-ticular, our hypotheses were partially confirmed, with higher total emission observed for more degradable wheat residues when incorporated in Cambisol and applied in the surface in Vertisol. These results can be a consequence of the different contact between crop residues and the fine clay particles and the related different gaseous diffusion among soils and in the two management approaches tested. Besides, among GHGs, if CO2 total emission depended from the interaction between residue type and management, CH4 and N2O emission were most influenced by residue type. With this regard, the evidence highlights the effects of the different speed with which the residues make nutri-ent substrates available for microorganisms and alter the soil environment on the emission of these two gases. The results of this study can have implications for the management of the plant residues when aim-ing to counterbalance short-term effects on nutrient availability and long-term effects on C accumulation. Finally, our results showed that the clayey Vertisol has a slower decomposition rate, but higher reactivity to management than the sandy Cambisol.
Acknowledgement. We thank John Parker and
Francesca Mazza for technical advice and support. We also would like to thank the editor and reviewers for their time spent on reviewing our manuscript and their comments helping us to improve the article.
REFERENCES
Abalos D., Sanz-Cobena A., Garcia-Torres L., van Groenigen J.W., Vallejo A. (2013): Role of maize stover incorporation on nitrogen oxide emissions in a non-irrigated Mediterranean barley field. Plant and Soil, 364: 357–371.
Ali R.S., Poll C., Kandeler E. (2018): Dynamics of soil respiration and microbial communities: interactive controls of temperature and substrate quality. Soil Biology and Biochemistry, 127: 60–70. Badagliacca G., Ruisi P., Rees R.M., Saia S. (2017): An assessment of
factors controlling N2O and CO2 emissions from crop residues using different measurement approaches. Biology and Fertility of Soils, 53: 547–561.
Ball B.C. (2013): Soil structure and greenhouse gas emissions: a synthesis of 20 years of experimentation. European Journal of Soil Science, 64: 357–373.
Baggs E.M., Stevenson M., Pihlatie M., Regar A., Cook H., Cadisch G. (2003): Nitrous oxide emissions following application of resi-dues and fertiliser under zero and conventional tillage. Plant and Soil, 254: 361–370.
Begum N., Guppy C., Herridge D., Schwenke G. (2014): Influence of source and quality of plant residues on emissions of N2O and CO2 from a fertile, acidic Black Vertisol. Biology and Fertility of Soils, 50: 499–506.
Bremer E., van Houtum W., van Kessel C. (1991): Carbon dioxide evolution from wheat and lentil residues as affected by grinding, added nitrogen, and the absence of soil. Biology and Fertility of Soils, 11: 221–227.
Chen D.M., Xing W., Lan Z.C., Saleem M., Wu Y.Q., Hu S.J., Bai Y.F. (2019): Direct and indirect effects of nitrogen enrichment on soil organisms and carbon and nitrogen mineralization in a semi-arid grassland. Functional Ecology, 33: 175–187.
Cheng Y., Cai Z.C., Chang S.X., Wang J., Zhang J.B. (2012): Wheat straw and its biochar have contrasting effects on inorganic N re-tention and N2O production in a cultivated Black Chernozem. Biology and Fertility of Soils, 48: 941–946.
Dang D.M., Macdonald B., Warneke S., White I. (2017): Available carbon and nitrate increase greenhouse gas emissions from soils affected by salinity. Soil Research, 55: 47–57.
Datta A., Jat H.S., Yadav A.K., Choudhary M., Sharma P.C., Rai M., Singh L.K., Majumder S.P., Choudhary V., Jat M.L. (2019): Carbon mineral-ization in soil as influenced by crop residue type and placement in an Alfisols of Northwest India. Carbon Management, 10: 37–50. Giacomini S.J., Recous S., Mary B., Aita C. (2007): Simulating the
effects of N availability, straw particle size and location in soil on C and N mineralization. Plant and Soil, 301: 289–301.
Han Z., Walter M.T., Drinkwater L.E. (2017): N2O emissions from grain cropping systems: a meta-analysis of the impacts of fertil-izer-based and ecologically-based nutrient management strate-gies. Nutrient Cycling in Agroecosystems, 107: 335–355. Hijbeek R., ten Berge H.F.M., Whitmore A.P., Barkusky D., Schröder
J.J., van Ittersum M.K. (2018): Nitrogen fertiliser replacement values for organic amendments appear to increase with N appli-cation rates. Nutrient Cycling in Agroecosystems, 110: 105–115. IPCC (2014): Climate Change 2014: Mitigation of Climate Change.
Cambridge, Cambridge University Press.
Jahanzad E., Barker A.V., Hashemi M., Eaton T., Sadeghpour A., Weis S.A. (2016): Nitrogen release dynamics and decomposition of buried and surface cover crop residues. Agronomy Journal, 108: 1735–1741.
Jantalia C.P., dos Santos H.P., Urquiaga S., Boddey R.M., Alves B.J.R. (2008): Fluxes of nitrous oxide from soil under different crop rotations and tillage systems in the South of Brazil. Nutrient Cycling in Agroecosystems, 82: 161–173.
Johnson-Beebout S.E., Angeles O.R., Alberto M.C.R., Buresh R.J. (2009): Simultaneous minimization of nitrous oxide and meth-ane emission from rice paddy soils is improbable due to redox potential changes with depth in a greenhouse experiment with-out plants. Geoderma, 149: 45–53.
Li L.J., Han X.Z., You M.Y., Yuan Y.R., Ding X.L., Qiao Y.F. (2013): Carbon and nitrogen mineralization patterns of two contrasting crop residues in a Mollisol: effects of residue type and placement in soils. European Journal of Soil Biology, 54: 1–6.
Lou Y.S., Ren L.X., Li Z.P., Zhang T.L., Inubushi K. (2007): Effect of rice residues on carbon dioxide and nitrous oxide emissions from a paddy soil of subtropical China. Water, Air, and Soil Pol-lution, 178: 157–168.
Luo W.T., Nelson P.N., Li M.H., Cai J.P., Zhang Y.Y., Zhang Y.G., Yang S., Wang R.Z., Wang Z.W., Wu Y.N., Han X.G., Jiang Y. (2015): Contrasting pH buffering patterns in neutral-alkaline soils along a 3 600 km transect in northern China. Biogeosci-ences, 12: 7047–7056.
Maisto G., De Marco A., De Nicola F., Arena C., Vitale L., Virzo De Santo A. (2010): Suitability of two types of organic wastes for the growth of sclerophyllous shrubs on limestone debris: a mesocosm trial. Science of The Total Environment, 408: 1508– 1514.
Nett L., Sradnick A., Fuß R., Flessa H., Fink M. (2016): Emissions of nitrous oxide and ammonia after cauliflower harvest are in-fluenced by soil type and crop residue management. Nutrient Cycling in Agroecosystems, 106: 217–231.
Nicolardot B., Bouziri L., Bastian F., Ranjard L. (2007): A micro-cosm experiment to evaluate the influence of location and quality of plant residues on residue decomposition and genetic structure of soil microbial communities. Soil Biology and Bio-chemistry, 39: 1631–1644.
Oertel C., Matschullat J., Zurba K., Zimmermann F., Erasmi S. (2016): Greenhouse gas emissions from soils – a review. Geo-chemistry, 76: 327–352.
Rees R.M., Augustin J., Alberti G., Ball B.C., Boeckx P., Cantarel A., Castaldi S., Chirinda N., Chojnicki B., Giebels M., Gordon H., Grosz B., Horvath L., Juszczak R., Kasimir Klemedtsson Å., Klemedtsson L., Medinets S., Machon A., Mapanda F., Nya-mangara J., Olesen J.E., Reay D.S., Sanchez L., Sanz Cobena A., Smith K.A., Sowerby A., Sommer M., Soussana J.F., Stenberg M., Topp C.F.E., van Cleemput O., Vallejo A., Watson C.A., Wuta M. (2013): Nitrous oxide emissions from European agriculture – an
analysis of variability and drivers of emissions from field experi-ments. Biogeosciences, 10: 2671–2682.
de Ruijter F.J., Ten Berge H.F.M., Smit A.L. (2010): The fate of ni-trogen from crop residues of broccoli, leek and sugar beet. Acta Horticulturae, 852: 157–162.
Segers R. (1998): Methane production and methane consumption: a review of processes underlying wetland methane fluxes. Bio-geochemistry, 41: 23–51.
Shevtsova L., Romanenkov V., Sirotenko O., Smith P., Smith J.U., Leech P., Kanzyvaa S., Rodionova V. (2003): Effect of natural and agricultural factors on long-term soil organic matter dynamics in arable soddy-podzolic soils – modelling and observation. Geo-derma, 116: 165–189.
Song X., Ju X., Topp C.F.E., Rees R.M. (2019): Oxygen regulates nitrous oxide production directly in agricultural soils. Environ-mental Science and Technology, 53: 12539–12547.
Tang H.M., Xiao X.P., Tang W.G., Wang K., Sun J.M., Li W.Y., Yang G.L. (2015): Effects of winter covering crop residue incorpora-tion on CH4 and N2O emission from double-cropped paddy fields in southern China. Environmental Science and Pollution Research International, 22: 12689–12698.
Taylor P.G., Townsend A.R. (2010): Stoichiometric control of or-ganic carbon-nitrate relationships from soils to the sea. Nature, 464: 1178–1181.
Velthof G.L., Kuikman P.J., Oenema O. (2002): Nitrous oxide emis-sion from soils amended with crop residues. Nutrient Cycling in Agroecosystems, 62: 249–261.
Vitale L., Tedeschi A., Polimeno F., Ottaiano L., Maglione G., Arena C., De Marco A., Magliulo V. (2018): Water regime affects soil N2O emission and tomato yield grown under different types of fertilisers. Italian Journal of Agronomy, 13: 74–79.
Vogel C., Heister K., Buegger F., Tanuwidjaja I., Haug S., Schloter M., Kögel-Knabner I. (2015): Clay mineral composition modifies decomposition and sequestration of organic carbon and nitrogen in fine soil fractions. Biology and Fertility of Soils, 51: 427–442. Wilson D., Blain D., Couwenberg J., Evans C.D., Murdiyarso D.,
Page S.E., Renou-Wilson F., Rieley J.O., Sirin A., Strack M., Tu-itilla E.-S. (2016): Greenhouse gas emission factors associated with rewetting of organic soils. Mires and Peat, 17: 1–28. WRB, World Reference Base for Soil Resources (2014):
Interna-tional Soil Classification System for Naming Soils and Creating Legends for Soil Maps. World Soil Resources Reports No. 106. Food and Agriculture Organisation, Rome. ISSN 0532-0488
Received: November 5, 2019 Accepted: May 11, 2020 Published online: May 14, 2020