Wetland Plant Diversity in a Coastal Nature Reserve in Italy:
Relationships with Salinization and Eutrophication and Implications
for Nature Conservation
Renato Gerdol1 &Lisa Brancaleoni2&Lorenzo Lastrucci3&Giovanni Nobili4&Mauro Pellizzari5&Michele Ravaglioli4& Daniele Viciani3
Received: 13 July 2017 / Revised: 1 March 2018 / Accepted: 12 March 2018 / Published online: 2 April 2018 # Coastal and Estuarine Research Federation 2018
Abstract
Wetlands are important centers of biodiversity. Coastal wetlands are subject to anthropogenic threats that can lead to biodiversity loss and consequent negative effects on nature conservation. We investigated relationships between wetland vegetation and habitat conditions in a coastal Nature Reserve in Northern Italy that has undergone seawater intrusion and eutrophication for several decades. The wetland vegetation in the Nature Reserve consisted of nine communities of hygrophytic and helophytic vegetation and five communities of waterplant vegetation. The hygrophytic and helophytic communities were arranged accord-ing to a salinity gradient, from salt-free habitats to strongly saline habitats. The saline habitats had high nutrient levels, due to the influx of nitrate-rich saltwater from an adjacent lagoon. The waterplant communities were all typical of freshwater habitats. Water-table depth and concentration of dissolved nutrients in the water were the main factors structuring waterplant vegetation. The main driver of future changes in the wetland vegetation of the Nature Reserve is the ongoing increase in salinity levels which may enhance expansion of halophilic species and communities, thus outcompeting locally rare freshwater species. If nutrient, especially nitrate, load further increases in the next future, this may exert negative effects on wetland species and communities preferring nutrient-poor habitats.
Keywords Aquatic plants . Biodiversity . Nitrate . Nutrient load . Saline wedge . Vegetation
Introduction
Wetlands represent important centers of biodiversity, hosting specialized plant and animal species. Wetlands generally exhibit high level of functional diversity (Bedford et al.2001) and thus assume a central role for nature conservation (García-Madrid et al. 2014; Angiolini et al.2017). Wetlands are prone to a number of threats which mine their survival: over-exploitation, habitat fragmentation, water eutrophication and pollution, hu-man alteration of natural water cycles and alien species invasion are only some of the main threats and pressures which affect wetlands worldwide (Bedford et al.2001; Dudgeon et al.2006). Coastal wetlands are not immune from anthropogenic threats. Natural events such as erosion, hydrological and hydrochemical alterations, sea-level rise and subsidence may specifically affect these wetland types (Turner 1990). In particular, the Mediterranean basin represents one of the regions most prone to loss of coastal wetlands in the future (Nicholls et al.1999).
Wetland plant diversity is scale-dependent and varies across regions, showing a decreasing trend from more humid toward less humid climatic regions (see Hrivnák et al. 2014 and Communicated by Just Cebrian
Electronic supplementary material The online version of this article (https://doi.org/10.1007/s12237-018-0396-5) contains supplementary material, which is available to authorized users.
* Renato Gerdol [email protected]
1
Department of Life Sciences and Biotechnology, University of Ferrara, Corso Ercole I d’Este 32, 44121 Ferrara, Italy
2 Botanical Garden, University of Ferrara, Corso Ercole I d’Este 32,
44121 Ferrara, Italy
3
Department of Biology, University of Florence, Via La Pira 4, 50121 Florence, Italy
4
Carabinieri per la Biodiversità di Punta Marina, Lungomare C. Colombo, 21, 48122 Punta Marina, Ravenna, Italy
5 Istituto ComprensivoBBentivoglio^, Via Salvo D’Acquisto 5/7,
references therein). A number of environmental variables play an important role in driving plant species diversity in wetlands, such as size of the site, ground morphology, water-table depth and water chemistry (Edvardsen and Økland 2006; Lacoul and Freedman2006; Hrivnák et al.2014). Salinity is paramount for shaping the distribution of plant species in coastal wetlands (Watt et al.2007). Salinity becomes a critical factor when sea-level rise and/or subsidence increase salinity levels, thus altering the com-position and the distribution of wetland plant communities (Brock et al.2005; Spalding and Hester 2007). Indeed, stress resulting from increased salinity has been reported as a cause of biodiversity loss in terrestrial to riparian and aquatic habitats (see Brock et al.2005and references therein). Ecological mod-ifications due to increased salinity levels can also trigger dynamic processes which can eventually lead to dramatic changes in the vegetation of coastal wetlands (Donnelly and Bertness2001). Water eutrophication is considered one of the most important causes of degradation of many types of wetlands, from inland to marine ecosystems. Zaldivar et al. (2008) focused on direct and indirect effects of eutrophication of transitional waters, show-ing a complex net of drivers and pressures brought about by eutrophication which in turn reverberate in complex socio-economic and ecological aspects. The consequences of nutrient enrichment include development of algal blooms which can lead to anoxic conditions with negative impact on waterfowl, fish, and invertebrates (Davis and Froend1999). Water chemistry is also important in determining abundance, composition, and distribu-tion of wetland communities. Consequently, several types of plant communities have been identified as indicators of water quality (Klosowski and Jablońska2009; Ceschin et al.2010; Sakurai et al.2017). Anthropic activities such as urbanization and agriculture produce deep modifications in the chemical and physical features of the water ecosystems, inducing significant changes in the spatial pattern of wetland vegetation (Ceschin et al.2010).
Vegetation dynamics, i.e., changes in vegetation composi-tion over time, represents one of the most frequent causes of loss of habitats of conservation interest (Viciani et al.2014). In Europe, plant and habitat conservation benefits from a powerful tool provided by the European Union, i.e., the Habitats Directive (Commission of the European Community1992). The identification of habitat types and the selection of sites are supported by the implementation of the Interpretation Manual of European Union Habitats (Commission of the European Community2013). Another important document is the European Red List of Habitats that provides an overview of the degree of endangerment of terrestrial and freshwater habi-tats in the European Union (Janssen et al.2016). At the regional level, Biondi and Blasi (2009) produced the Italian Interpretation Manual of European Union Habitats and, more recently, Angelini et al. (2016) produced a handbook for mon-itoring habitats of community interest in Italy. This handbook is based on European guidelines (Evans and Arvela2011) and
provides tools for an effective monitoring activity of Annex I Habitats occurring in Italy (Gigante et al.2016). These docu-ments not only show that wetlands host habitats of conservation importance but also report that these habitats are often subject to serious threats and pressures. Several vegetation types strictly related to wetlands, often widespread in Central Europe but very rare in Southern Europe, do not fall in any habitat type of conservation interest listed in the Habitat Directive (Angiolini et al.2017). Analyzing relationships among species, plant communities, and ecological drivers provides important and useful information that can be used for the protection and monitoring of plants and habitats of conservation inter-est either listed in environmental protection laws or not. The Nature Reserve BBosco della Mesola^ represents a relict of ancient coastal forests. Most of these forested areas disappeared in more or less recent times, while others underwent deep changes. Consequently, very few coastal for-ests still occur in relatively pristine conditions in this region (Stampi1966; Piccoli et al.1983; Pellizzari and Piccoli2001). The Nature Reserve is rich in wetlands that host different plant communities, including both freshwater and brackish vegeta-tion types. This area has undergone subsidence and eutrophi-cation for several decades, which can potentially trigger sig-nificant changes in wetland vegetation. In this study, we ana-lyzed relationships between wetland vegetation and environ-mental conditions in the Nature Reserve. Our main objective was to analyze environmental factors affecting wetland vege-tation, with special focus on habitats and species of conserva-tion interest. We also aimed at forecasting future changes in wetland vegetation and defining appropriate guidelines direct-ed to implementing and updating the Management Plan of the Nature Reserve.
Materials and Methods
Study Area The study was carried out at Bosco della Mesola, North-Eastern Italy (44°50′ N, 12°15′ E, 1088 ha, 0–2.8 m above sea level, Fig. 1), a National Nature Reserve hosting Special Areas of Conservation, Special Protection Areas and a strict Nature Reserve area in the Po Delta Park. The study area lies on a dune system originated during the eleventh to fifteenth centuries, consisting of sand dunes and dune slacks with paral-lel, approximately North-South orientation. This area is preva-lently covered with woodlands that represent a relict of ancient coastal forests (Stampi1966; Piccoli and Gerdol1984; Piccoli et al.1983). Most of these areas disappeared in more or less recent times, while others underwent deep changes (Stampi 1966). The woodlands in the Reserve present transitional fea-tures between Mediterranean and Central European forest types (Gerdol et al.1985). A xerophilic Quercus ilex community is situated on high, more recent arid dunes. A mesophilic Carpinus betulus–Quercus robur community is situated on flat, more
ancient and less arid dunes. The dune slacks are colonized by a Populus alba–Fraxinus angustifolia community typical of wet habitats (Gerdol et al.1985). Hydrologically, this area is char-acterized by a coastal aquifer system in hydraulic continuity with the sea. This determines saltwater inflow which enables the development of halophilic vegetation in the marginal south-eastern part of the area (Piccoli et al.1983; Fig. 1). Three main soil types occur in this area: typic xeropsamments, aquic xeropsamments and psammaquents, considerably differ-ing from each other in depth and structure. However, all of these soils are rich in sand and have A-C profile and moderately alkaline pH (Gerdol et al.1985). The soil pore-water is enriched in salt at the south-eastern border of the area (Piccoli et al.1983).
Wetlands and their Management The study area hosts a rich variety of freshwater and brackish wetlands. Natural freshwa-ter wetlands in the inland part of the area are mainly situated in temporarily flooded dune slacks not covered with forest veg-etation. Therefore, dune slacks are prevalently fed by rainwa-ter, and secondarily by water flowing from canals so that water-table depth in these wetlands is conditioned by precip-itation and by the water level in the canal system. Natural brackish wetlands are concentrated in the south-eastern mar-ginal part of the area and are fed with saltwater from an adja-cent lagoon (Fig.1). These brackish wetlands usually are flooded throughout the year, except during prolonged dry pe-riods in summer. Three types of artificial wetlands occur in the study area: (1) a network of canals, (2) a number of pools used for watering wildlife, and (3) a lentic pond permanently fed by discharging water table. The watering pools have a more or less regular circular shape and usually are flooded, except
during periods of prolonged drought. A dense network of canals represents the main source of water supply to the Nature Reserve. This is of fundamental importance for supporting basic ecological processes that eventually guaran-tee correct functioning of the forest ecosystem. The canals provide freshwater from the surrounding areas, whereas a number of locks limit the intrusion of saltwater from the sea (the so-called saline wedge). Indeed, the Nature Reserve is situated in a reclamation area so that meteoric water must be drained in winter, while oxygen-rich freshwater must be sup-plied to the forest in summer. Over time, these canals gradu-ally turned from simple hydraulic systems to complex ecosys-tems, representing preferential habitats for aquatic plants, fish, and herpetological species. The management of the protected area follows the guidelines stated in the Reserve Management Plan, as well as a series of conservation actions defined in specific LIFE projects (e.g., LIFE00NAT/7147). Major objec-tives are the conservation of priority habitats and species of the Habitats Directive. Most of the relevant conservation ac-tions are closely related to the hydraulic management of the water supply through the canal systems.
Sampling and Analysis Wetlands in the study area were sur-veyed several times during the growing season (May– September) of 2016. A total of 84 phytosociological relevés were carried out at the peak of the growing season in all of the wetland types occurring in the Nature Reserve (Table1; Fig.1). Alluvial forests of the Populus alba–Fraxinus angustifolia com-munity, although inhabiting wet habitats, were not considered in our survey. The choice of the sampling sites was sub-jective, but the number of relevés approximately Fig. 1 Map of the study area with
location of the sampling sites in the five wetland types
mirrored frequency and area covered by each wetland type (Table 1), partially calibrated by visual inspection of vegetation diversity in each wetland type.
Plant communities were sampled according to the phyto-sociological method (Braun-Blanquet1932; Biondi2011; Pott 2011). A phreatimeter was placed and the following data were recorded at each relevé site: GPS coordinates (UTM33, WGS84), relevé area (m2), and vegetation cover (%). At the end of the growing season, water-table depth was measured and a 50-mL water sample was collected at each of the relevé sites. All water-table measurements and water collections were carried out on a single day (25 October 2016) in order to make the data comparable. The day after collection, electri-cal conductivity and salinity were measured with a Crison CM 35 conductivity-meter (Hach-Lange, L’Hospitalet de Llobregat, Spain), and pH was measured with a Hanna Jenway 3510 pH-meter (Hanna Instruments, Villafranca Padovana, Italy). The water samples were immediately fil-tered with Whatman 25-mm GD/X syringe filters (pore size 0.45 μm) and colorimetrically analyzed for ammonium (NH4+), nitrate (NO3−), and phosphate (PO43−) concentrations using a continuous-flow autoanalyzer (Systea Flowsys, Anagni, Italy). Ammonium was determined by the salicylate method in the presence of hypochlorite, nitrate by the cadmium-reduction method through a column, and phosphate by the molybdenum-blue method. Alkalinity (HCO3−) was determined by the double indicator method with phenolphtha-lein and methyl orange.
The spatial distribution of electrical conductivity was graphically represented by a Geographical Information System (GIS), using the software ArcView GIS 3.2 for Windows and IDW interpolation. The resulting map was com-pared with a similar map obtained using data on electrical conductivity measured in 2003 at 60 sites, most of which coincided with the sampling sites of the present study.
Statistics The matrix of the vegetation data (i.e., the cover of each species in the 84 relevés) was statistically treated by a hierarchical numerical classification method after transforming the ordinal scale used for assessing species cov-er. Scale transformation was performed using the van der Maarel (1979) numerical scale. A cluster analysis (i.e.,
numerical classification) was performed by the Ward method based on the matrix of between-relevé Euclidean distances (Orlóci 1978). Relationships between species composition and environmental variables were statistically analyzed by a multivariate ordination method (detrended canonical corre-spondence analysis, DCCA). Significance level of the envi-ronmental variables was assessed by Monte Carlo permuta-tions based on forward selection of the variables. Occasional species, i.e., those recorded in one or two relevés only, were excluded from the cluster analysis and the multivariate ordi-nations as well.
Species composition of the plant communities defined by the numerical classification was assessed in terms of species rarity. Species rarity was calculated based on rarity indices of all plant species, i.e., also including the occasional species not considered in the multivariate analyses. The rarity indices (Table2) were derived from estimates of species frequency in the local plant species checklist (Piccoli et al.2014). The cluster analysis and the DCCA were performed with the sta-tistical software CANOCO 5.0 (ter Braak andŠmilauer2012). Univariate statistics were computed with the statistical soft-ware STATISTICA 7.0 (StatSoft©; Version 7; StatSoft Inc., Tulsa, OK, USA).
Results
Vegetation Classification The vegetation relevés were clus-tered into two big groups (Fig.2). The first group (rel. 1–56) included relevés of hygrophytic or helophytic vegetation, while the second group (rel. 57–84) included relevés of waterplant communities (sensu Den Hartog and Segal1964). Fourteen clusters were recognized at a lower hierarchical level in the dendrogram, i.e., at a Euclidean distance of 25–30 (Fig. 2). These clusters represented the main wetland vegetation types in the Nature Reserve. A synthetic description of these communities, as well as their correspondence with the Natura 2000 habitat codes and the Red List Habitat EUNIS codes, is given in Table3. Details on the full species composition can be found in Supplementary Table1.
Table 1 List of the wetland types, with cover area and number of vegetation relevés
Wetland type Area (ha) No. of relevés
Canals 10.0 22
Watering pools 1.2 7
Dune slacks 14.9 25
Lentic ponds 7.1 16
Brackish wetlands 9.2 14
Table 2 List of the rarity indices derived from estimates of species abundance in the local plant species checklist
Species frequency in the checklist Rarity index
Very rare 6 Rare 5 Uncommon 4 Widespread 3 Common 2 Very common 1
In brief, nine hygrophytic and helophytic communities were recognized based on the cluster analysis (Fig. 2; Table3). Two of these communities (c. of Spartina anglica and c. of Tripolium pannonicum) were composed of few hal-ophytes, exclusive of brackish wetlands. Three communities (c. of Juncus acutus and J. littoralis, c. of J. subnodulosus and Phragmites australis, and c. of J. acutus and J. maritimus) had different rush species and/or common reed as dominant spe-cies. These three communities were richer in species and were composed of more or less strongly salt-tolerating hygrophytes and helophytes. They were found in brackish wetlands, lentic ponds, and dune slacks. The community of Cladium mariscus was found only in dune slacks and had Cladium mariscus as the dominant species with scattered occurrence of a few other, moderately salt-tolerating species. Three further communities (c. of Schoenus nigricans and Tripidium ravennae, c. of Juncus maritimus and Galium palustre, and the wet meadows) were composed of several species generally possessing low levels of salt tolerance. These communities usually occurred in lentic ponds and dune slacks, and occasionally in watering pools with poor if any saltwater influx. The waterplant com-munities were overall poorer in species compared with the hygrophytic and helophytic communities. Five waterplant
communities were recognized based on the cluster analysis (Fig.2; Table3). Four of them were characterized by domi-nance of an only waterplant species each. These dominating waterplant species were both pleustophytes (Den Hartog and Segal1964), i.e., waterplants floating on the water surface (Spirodela polyrrhiza and Lemna minuta) or floating freely between the bottom and the surface (Ceratophyllum demersum) and rhizophytes (Den Hartog and Segal 1964), i.e., waterplants with their basal parts penetrating into the bot-tom (Myriophyllum spicatum). These four communities were usually found in canals. The fifth waterplant community (c. of Chara sp.) was prevalently comprised of rhyzophytes, with Chara vulgaris or C. intermedia (not separated in the field during the relevés) usually dominating. This community was found only in watering pools.
With respect to conservation value, the community of Chara sp. stood out among all other communities because of the presence of three locally very rare species: Chara fragilis, C. intermedia, and Ranunculus peltatus ssp. baudotii (Supplementary Table 1). Hence, this community presented the highest rarity index (Table4). The community of Chara sp. presented considerable importance with respect to habitat type because this community is quite rare in the lowland Fig. 2 Classification dendrogram of the 84 vegetation relevés. The rectangle indicates the range of Euclidean distance (ca. 25–30) in which the clusters corresponding to the 14 plant communities were recognized (symbols as in Fig.3)
regions of northern Italy. Other communities were important in terms of species rarity, although presenting lower rarity index (Table4; Supplementary Table1). Firstly, the commu-nity of Juncus acutus and J. littoralis hosted one of the very few populations of Kosteletzkya pentacarpos in Italy. This species is listed both in the 92/43/CEE Habitat Directive (Annex II) and in the Bern Convention (Annex I) and is con-sidered threatened with extinction in Italy and in Europe, where Kosteletzkya pentacarpos is classified as Bcritically endangered^ and Bvulnerable,^ respectively (Bilz et al. 2011; Rossi et al.2016). Secondly, the community of Juncus maritimus and Galium palustre hosted three locally very rare species, i.e., Euphorbia lucida, Hydrocotyle vulgaris, and Teucrium scordium (Table4; Supplementary Table 1). The community of Juncus subnodulosus and Phragmites australis
and the community of Cladium mariscus had quite high rarity indices for being characterized by high abundance of the lo-cally very rare species Juncus subnodulosus and Cladium mariscus, respectively (Table 4; Supplementary Table 1). The species-poor community of Lemna minuta had a high rarity index owing to the high abundance of the locally un-common, but invasive alien species Lemna minuta. Therefore, the rarity index seemed to overemphasize the real conserva-tion value of this community. All of the other communities did not exhibit remarkable conservation value based on the rarity index (Table4).
Ecological Gradients As the hygrophytic and helophytic veg-etation on one side and the waterplant vegveg-etation on the other side differed very strongly from each other in terms of species Table 3 Synthetic description of the vegetation types with reference to Habitat Natura 2000 codes and European Red List of Habitats—EUNIS codes Community type Species composition Wetland type Natura 2000
code
EUNIS code
C. of Spartina anglica Almost pure Spartina anglica stands Brackish wetlands 1320 A2.5d C. of Tripolium pannonicum Very species-poor community with
Tripolium pannonicum as the dominant species and scattered occurrence of few other helophytes
Brackish wetlands 1410 A2.5d
C. of Juncus acutus and J. littoralis
Dominated by halophytes or salt-tolerant species often with high frequency of Phragmites australis
Brackish wetlands, dune slacks, lentic ponds
1410 A2.5d
C. of Juncus subnodulosus and Phragmites australis
Co-dominated by Juncus subnodulosus and Phragmites australis with scattered occurrence of salt-tolerant species
Lentic ponds – C5.1a
C. of Juncus acutus and J. maritimus
Co-dominated by Juncus acutus and J. maritimus with low frequency of Phragmites australis and some other salt-tolerant species
Dune slacks 1410 A2.5d
C. of Cladium mariscus Species-poor community strongly dominated by Cladium mariscus
Dune slacks 7210 B1.8b (D4.1b) C. of Schoenus nigricans
and Tripidium ravennae
Species-rich community co-dominated by Schoenus nigricans and Tripidium ravennae
together with several moderately salt-tolerating species
Lentic ponds 6420 E3.1a
C. of Juncus maritimus and Galium palustre
Species-rich community co-dominated by Juncus maritimus and Galium palustre with modest, if any, saltwater influx
Dune slacks 6420 B1.8b (E3.1a)
Wet meadows Species-rich community having Mentha aquatica, Molinia arundinacea, and Scirpoides holoschoenus as the most abundant species associated with several poorly salt-tolerating species
Dune slacks, watering pools, lentic ponds
6420 E3.1a (B1.8b)
C. of Spirodela polyrrhiza Species-poor community dominated by the small pleustophyte Spirodela polyrrhiza
Canals 3150 C1.2b
C. of Ceratophyllum demersum Species-poor community dominated by the freely-floating pleustophyte Ceratophyllum demersum
Canals 3150 C1.2b
C. of Lemna minuta Extremely species-poor community dominated by the small pleustophyte Lemna minuta
Canals, watering pools 3150 C1.2b C. of Chara sp. Species-poor, prevalently rhizophytic community
with Chara vulgaris and/or C. intermedia as the dominant species and rather high frequency of Potamogeton pectinatus and Ranunculus peltatus ssp. baudotii
Watering pools 3140 C1.2a
C. of Myriophyllum spicatum Species-poor community dominated by the rhyzophyte Myriophyllum spicatum usually associated with Ceratophyllum demersum
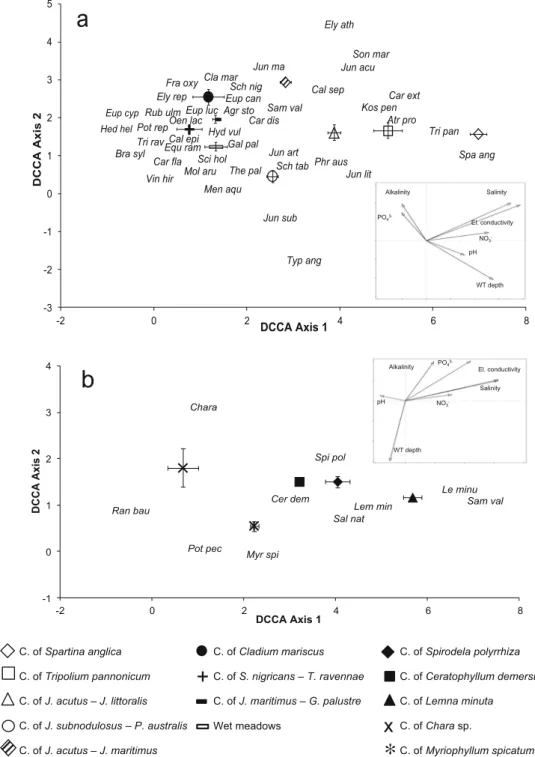
composition, we run two separate DDCAs for each of the two groups (Fig.3). All environmental factors accounted signifi-cantly for the observed variation in the species composition of the hygrophytic and helophytic vegetation (Table 5). Electrical conductivity accounted for the largest part of the variance in the hygrophytic and helophytic vegetation. Salinity was significant as well but accounted for a smaller portion of variance because of its high collinearity with elec-trical conductivity (Fig.3a; Table5). The nine hygrophytic and helophytic communities were thus arranged according to a gra-dient of increasing salt tolerance, parallel to the vectors of elec-trical conductivity and salinity, from the community of Juncus subnodulosus and Phragmites australis, the wet meadows, the community of Schoenus nigricans and Tripidium ravennae, and the community of Juncus maritimus and Galium palustre, all characterized by mean salinity levels of about 1000 mg L−1 or lower indicating no saltwater influx, to the community of Juncus acutus and J. littoralis, the community of Juncus acutus and J. maritimus, the community of Tripolium pannonicum, and the community of Spartina anglica, all settled in more or less strongly saline habitats. The community of Cladium mariscus had intermediate position across the gradient (Fig. 3a; Table4). Similarly, the species were arranged according to increasing salt-tolerance levels from Hedera helix, Brachypodium sylvaticum, and Vincetoxicum hirundinaria at the left end of the gradient to Kosteletzkya pentacatpos, Carex extensa, Atriplex prostrata, Spartina anglica, and Tripolium
pannonicum at the right end of the gradient (Fig. 3a). The vectors of water-table depth and pH on one side, and the vectors of alkalinity and phosphate on the other side presented similar trends but opposite orientation (Fig.3a). Water-table depth was higher in the four communities having rushes (Juncus subnodulosus, J. acutus, and J. littoralis), tall helophytes (Phragmites australis and Typha angustifolia), or halophytes (Tripolium pannonicum, Spartina anglica, and Atriplex prostrata) as dominant or abundant species. Accordingly, the centroids of these four communities (c. of Spartina anglica, c. of Tripolium pannonicum, c. of Juncus acutus and J. littoralis, and c. of Juncus subnodulosus and Phragmites australis) were located in the lower-right part of the DCCA diagram (Fig.3a). In all of these communities, mean water-table depth was posi-tive indicating that the soil was submerged (Table4). These communities also presented somewhat higher mean pH al-though there were very poor, if any, significant differences in terms of mean pH that ranged from 7.11 to 7.63 across all of the wetland communities (Table4). Alkalinity and phosphate were both higher in less humid habitats, with highest values in the community of J. maritimus and Galium palustre (Fig. 3a; Table4). The nitrate vector was oriented almost parallel to the first DCCA axis. This corresponded to highest nitrate concen-trations in the community of Tripolium pannonicum and the community of Spartina anglica, both having halophytes as the dominant species (Fig.3a; Table4).
Table 4 Mean (± SE) values of the rarity index and of hydrochemical variables in nine communities of hygrophytic and helophytic vegetation and five communities of waterplant vegetation. For each variable in each of the two vegetation groupings, the means followed by the same letter do
not differ significantly (P < 0.05) based on Tukey’s HSD post hoc tests (capital letters for hygrophytic and helophytic vegetation; small letters for waterplant vegetation) Community Rarity index pH Electrical conductivity (μS cm−1) Salinity (mg L−1) Water-table depth (cm) Alkalinity (mg L−1) NO3− (mg L−1) PO43− (mg L−1)
Hygrophytic and helophytic vegetation
C. of Spartina anglica 2.67 ± 0.17 B 7.57 ± 0.03 A 38,967 ± 524 A 23,833 ± 384 A 8.0 ± 0.6 AB 186 ± 11 B 0.540 ± 0.087 A 0.053 ± 0.003 B C. of Tripolium pannonicum 2.69 ± 0.19 B 7.58 ± 0.03 A 34,375 ± 2226 A 10,342 ± 6088 B 4.5 ± 1.9 ABC 204 ± 16 B 0.349 ± 0.077 A 0.042 ± 0.004 B C. of Juncus acutus
and J. littoralis
2.93 ± 0.11 B 7.63 ± 0.06 A 12,801 ± 2932 B 7268 ± 1739 B 4.9 ± 4.1 AB 363 ± 48 B 0.110 ± 0.049 B 0.175 ± 0.106 B
C. of Juncus subnodulosus and Phragmites australis
3.31 ± 0.12 AB 7.45 ± 0.06 A 1196 ± 149 C 576 ± 73 C 14.0 ± 3.0 A 206 ± 13 B 0.007 ± 0.001 B 0.004 ± 0.001 B
C. of Juncus acutus and J. maritimus
2.66 ± 0.12 B 7.36 ± 0.04 A 16,539 ± 493 B 9269 ± 297 B −0.7 ± 3.5 ABC 412 ± 31 B 0.030 ± 0.004 B 0.305 ± 0.155 B C. of Cladium mariscus 3.04 ± 0.1 AB 7.53 ± 0.17 A 6207 ± 2987 BC 3363 ± 1671 BC −19.8 ± 4.2 BC 358 ± 202 B 0.054 ± 0.016 B 0.562 ± 0.555 AB C. of Schoenus nigricans
and Tripidium ravennae
2.68 ± 0.2 B 7.50 ± 0.00 A 2140 ± 759 C 1087 ± 403 C −27.6 ± 12.6 C 188 ± 17 B 0.018 ± 0.009 B 0.003 ± 0.001 B C. of Juncus maritimus
and Galium palustre
3.54 ± 0.15 A 7.11 ± 0.07 B 2918 ± 532 C 1491 ± 282 C −14.9 ± 5.7 BC 907 ± 141 A 0.102 ± 0.029 B 1.990 ± 0.701 A Wet meadows 3.07 ± 0.25 AB 7.49 ± 0.12 A 1876 ± 775 C 969 ± 414 C −13.0 ± 8.2 BC 349 ± 62 B 0.070 ± 0.017 B 0.011 ± 0.002 B Waterplant vegetation C. of Spirodela polyrrhiza 2.53 ± 0.21 b 7.60 ± 0.12 a 881 ± 147 b 434 ± 74 b 15.8 ± 6.8 ab 240 ± 17 b 0.154 ± 0.085 a 0.013 ± 0.006 a C. of Ceratophyllum demersum 2.24 ± 0.15 b 7.73 ± 0.17 a 497 ± 31 c 239 ± 15 c 33.0 ± 5.5 a 170 ± 14 c 0.168 ± 0.096 a 0.006 ± 0.002 a C. of Lemna minuta 3.75 ± 0.25 a 7.20 ± 0.11 b 1322 ± 211 a 661 ± 112 a 12.8 ± 3.3 b 357 ± 34 a 0.550 ± 0.005 a 0.012 ± 0.002 a C. of Chara sp. 4.38 ± 0.13 a 7.48 ± 0.02 a 428 ± 20 c 356 ± 10 bc 10.8 ± 1.2 b 306 ± 27 ab 0.012 ± 0.001 a 0.006 ± 0.001 a C. of Myriophyllum spicatum 2.24 ± 0.11 b 7.52 ± 0.04 a 474 ± 7 c 227 ± 3 c 33.3 ± 3.5 a 190 ± 7 bc 0.046 ± 0.007 a 0.004 ± 0.001 a
C. of Spartina anglica C. of Tripolium pannonicum C. of J. acutus – J. littoralis C. of J. subnodulosus – P. australis C. of J. acutus – J. maritimus C. of Cladium mariscus C. of S. nigricans – T. ravennae C. of J. maritimus – G. palustre Wet meadows C. of Spirodela polyrrhiza C. of Ceratophyllum demersum C. of Lemna minuta C. of Chara sp. C. of Myriophyllum spicatum Vin hir Typ ang Tri pan Tri rav The pal Spa ang Son mar Sci hol Sch nig Sch tab Sam val Rub ulm Pot rep Phr aus Oen lac Mol aru Men aqu Kos pen Jun sub Jun ma Jun lit Jun art Jun acu Hyd vul Hed hel Gal pal Fra oxy Eup luc Eup cyp Eup can Equ ram Ely rep Ely ath Cla mar Car fla Car ext Car dis Cal sep Cal epi Bra syl Atr pro Agr sto -3 -2 -1 0 1 2 3 4 5 -2 0 2 4 6 8 DCCA Axis 2 DCCA Axis 1
a
PO4 3-Alkalinity NO3 -pH WT depth Salinity El. conductivity Spi pol Sam val Sal nat Ran bau Pot pec Myr spi Le minu Lem min Chara Cer dem -1 0 1 2 3 4 -2 0 2 4 6 8 DCCA Axis 2 DCCA Axis 1b
PO4 3-NO3 -pH WT depthAlkalinity El. conductivity Salinity
+
∗
x
Fig. 3 Species scores and environmental variables scores on the first two DCCA axes for the hygrophytic and helophytic vegetation (a) and for the waterplant vegetation (b) Agr sto Agrostis stolonifera, Atr pro Atriplex prostrata, Bra syl Brachypodium sylvaticum, Cal epi Calamagrostis epigejos, Cal sep Calystegia sepium, Car dis Carex distans, Car ext Carex extensa, Car fla Carex flacca, Cer dem Ceratophyllum demersum, Chara Chara sp. (including C. vulgaris and C. intermedia), Cla mar Cladium mariscus, Ely ath Elymus athericus, Ely rep Elymus repens, Eup can Eupatorium cannabinum, Eup cyp Euphorbia cyparissias, Eup luc Euphorbia lucida, Gal pal Galium palustre, Hyd vul Hydrocotyle vulgaris, Jun acu Juncus acutus, Jun art Juncus articulatus, Jun lit Juncus littoralis, Jun mar Juncus maritimus, Jun sub Juncus subnodulosus, Kos pen Kosteletzkya pentacarpos, Lem min
Lemna minor, Le minu Lemna minuta, Men aqu Mentha aquatica, Mol aru Molinia arundinacea, Myr spi Myriophyllum spicatum, Oen lac Oenanthe lachenalii, Phr aus Phragmites australis, Pot pec Potamogeton pectinatus, Ran bau Ranunculus peltatus ssp. baudotii, Rub ulm Rubus ulmifolius, Sal nat Salvinia natans, Sam val Samolus valerandi, Sch tab Schoenoplectus tabernaemontani, Sch nig Schoenus nigricans, Sci hol Scirpoides holoschoenus, Son mar Sonchus maritimus, Spa ang Spartina anglica, Spi pol Spirodela polyrrhiza, The pal Thelypteris palustris, Tri rav Tripidium ravennae, Tri pan Tripolium pannonicum, Typ ang Typha angustifolia, Vin hir Vincetoxicum hirundinaria. The symbols indicate the centroids (mean ± SE) of the relevé scores for the 14 plant communities
Only three out of the seven environmental variables (electrical conductivity, water-table depth and alkalinity) did significantly account for the observed variation in waterplant vegetation (Table 5). The five waterplant communities were arranged from left to right according to increasing values of electrical conductivity from the communities of Ceratophyllum demersum, Chara sp., and Myrophyllum spicatum to the community of Spirodela polyrrhiza and, especially, the community of Lemna minuta (Fig.3b; Table4). The ordination of the five waterplant com-munities along the vector of water-table depth reflected a gra-dient of increasing water-table depth from the communities of Chara sp. and Lemna minuta to the communities of Ceratophyllum demersum and Myriophyllum spicatum. Similar to the hygrophytic and helophytic vegetation, the vec-tor of alkalinity was oriented in opposite direction to that of water-table depth. Accordingly, mean alkalinity levels were somewhat higher in the communities of Chara sp. and Lemna minuta than in the communities of Ceratophyllum demersum and Myriophyllum spicatum. The community of Spirodela polyrrhiza had intermediate levels of both water-table depth and alkalinity (Fig.3b; Table4). Contrary to helophytic and hygrophytic vegetation, waterplant vegetation was not affected by pH, nitrate or phosphate concentrations, and salinity (Table 5). Mean salinity levels always were < 1000 mg L−1, indicating no saltwater influx in any of the waterplant communities.
Discussion
Conservation Values and Ecological Gradients The rich variety of plant communities recorded in the Nature Reserve reflected strong environmental differences among wet-lands that ranged from natural to artificial, lentic to lotic, permanent to temporary, and freshwater to saline wetland types. The species composition of the plant communities reflected such environmental heterogeneity. Indeed, species diversity is strongly affected by niche differentiation, in turn depending on relationships be-tween environmental heterogeneity and species diversity at different scale levels (Lundholm 2009; Lastrucci et al. 2015). The wetland vegetation in the study area was rather heterogeneous in terms of structural diversity as well, because it consisted of plant communities dom-inated by hygrophyes, helophytes, pleustophytes, or rhizophytes. Most of the plant communities in the Nature Reserve had good correspondence with Natura 2000 habitat types. Several of these habitats presented high conservation value based on the species rarity in-dex, although none of them falls within the Community priority habitats. Interestingly, the community of Juncus subnodulosus and Phragmites australis presented one of the highest rarity values even if it does not fall under any of the Natura 2000 habitat types. This supports the results of recent studies showing that, especially in Mediterranean wetlands, plant communities not corre-sponding to Natura 2000 habitat types may be extreme-ly important from the conservation viewpoint because they host locally rare and threatened species (Angiolini et al. 2017; Viciani et al. 2017).
The multivariate ordination pointed to electrical con-ductivity, closely related to salinity, as the main ecolog-ical factor structuring the hygrophytic and helophytic vegetation in the Nature Reserve. The three communi-ties at the high end of the salinity gradient, i.e., the community of Juncus acutus and J. littoralis and espe-cially the communities of Tripolium pannonicum and Spartina anglica, only occurred in brackish wetlands close to the adjacent lagoon where salinity levels were highest. The community of Juncus subnodulosus and Phragmites australis, the community of Schoenus nigricans and Tripidium ravennae, and the wet meadows were all situated at greater distance from the lagoon in habitats with poor if any saltwater influx. However, some of the species most frequently occurring in these communities, especially Phragmites australis and to a lesser extent Schoenus nigricans, were also found in moderately saline habitats owing to their rather broad ecological amplitude with respect to salinity level (Lissner and Schierup 1997; Bernhardt and Kropf 2006). The community of Cladium mariscus was located in the Table 5 Summary of Monte Carlo statistics for the hygrophytic and
helophytic vegetation (upper part) and for the waterplant vegetation (lower part). Significant (P < 0.05) P adjusted values in bold character
Contribution (%)
Pseudo-F
P P adjusted
Hygrophytic and helophytic vegetation Electrical conductivity 32.1 6.8 0.002 0.014 Water-table depth 18.8 4.2 0.002 0.014 Alkalinity 13.2 3.1 0.002 0.014 Nitrate 12.7 3.1 0.002 0.014 Phosphate 8.7 2.2 0.004 0.02 pH 7.6 1.9 0.004 0.02 Salinity 6.9 1.8 0.046 0.046 Waterplant vegetation Electrical conductivity 36.5 6.6 0.002 0.014 Water-table depth 16.4 3.4 0.004 0.02 Alkalinity 14.6 3.4 0.004 0.02 Salinity 12.2 2.3 0.056 0.224 pH 8.1 1.9 0.076 0.228 Nitrate 6.0 1.5 0.22 0.416 Phosphate 6.1 1.5 0.208 0.416
mid part of the salinity gradient. Cladium mariscus also possesses high tolerance to salinity. Indeed, Cladium mariscus-dominated communities are quite frequent both in inland areas free from saltwater influx and in coastal habitats with quite high salt content (Géhu and Biondi 1988; Landucci et al. 2013). Nutrient levels also played a significant role in structuring the hygrophytic and helophytic vegetation. However, nitrate and phosphate appeared to affect differently the hygrophytic and helophytic communities in the Nature Reserve. The high nitrate levels detected in the saline habitats colonized by the communities of Spartina anglica and Tripolium pannonicum were determined by riverine N influx into the lagoon (Tappin 2002). The saltwater progressing landwards as an effect of saline wedge intrusion became progressively impoverished in dissolved N probably be-cause the plant species in the communities of Spartina anglica and Tripolium pannonicum were effective in absorbing nitrate that was thus removed from the soil water (Sousa et al. 2008). Hence, the habitats with low to moderate salinity had lower nitrate concentrations and were characterized by species usually regarded as sensi-tive to high N load such as Juncus subnodulosus (Ceschin et al. 2010), Cladium mariscus (Landucci et al. 2013), and Schoenus nigricans (Bakker et al. 2005). Contrary to nitrate, phosphate was not associated with salinity but rather with alkalinity which resulted in highest phosphate concentration and highest alkalinity level in the salt-poor community of Juncus maritimus and Galium palustre. A possible explanation consists in a higher fraction of phosphate being incorporated on calci-um phosphate in the soil of this community (Turner2008). The waterplant vegetation in the Nature Reserve was strongly conditioned by water-table depth. Water-table depth generally is a major driver in affecting species composition of waterplant communities (Edvardsen and Økland 2006; Klosowski and Jablońska 2009; Hrivnák et al. 2014; Sakurai et al. 2017). The community of Chara sp. was located at the low end of the water-table depth gradient. In these habitats, the water water-table fluctuated strongly depending on precipitation, but the mean water-table depth was lower than in all other waterplant communities. The temporary character of this kind of wetlands represents a favorable condition for species such as Ranunculus peltatus subsp. baudotii or Chara sp. (see also Melendo et al. 2003; Florencio et al., 2014). Water bodies with relatively shallow water were colonized by small pleustophytes in the communi-ties of Spirodela polyrrhiza and Lemna minuta. In con-trast, bigger pleustophytes or rhyzophytes in the com-munities of Ceratophyllum demersum and Myriophyllum spicatum were found in deeper water in line with results of previous studies (Buchwald 1994; Lastrucci et al.
2014; Sakurai et al. 2017). An additional factor respon-sible for variation in the waterplant vegetation of the Nature Reserve was electrical conductivity. Unlike what we observed for the hygrophytic and helophytic vegetation, relationships between electrical conductivity and nitrate or phosphate concentrations were not straightforward for the waterplant vegetation. Neither was electrical conductivity related to salinity as all of the waterplant communities were situated in freshwater habitats. This suggests that electrical conductivity in the waterplant habitats mirrored the total load of nutrients with no close association with specific components such as nitrate or phosphate. The community of Chara sp. presented rather low values of electrical conductivity which indicates quite low levels of dissolved nutrients in the water. However, the species occurring in the community of Chara sp. have been found to tolerate quite high levels of dissolved nutrients in the water. For e xa mple , Cesc hin et al. (20 10) considered Potamogeton pectinatus as an indicator of moderate eu-trophication. Chara vulgaris has rather wide ecological amplitude with respect to nutrient levels, ranging from mesotrophic to eutrophic waters (Lambert-Servien et al. 2006). Ranunculus peltatus ssp. baudotii has also been frequently observed in mesotrophic to eutrophic waters (Brullo et al. 2001; Melendo et al. 2003). The low nu-trient levels recorded in the community of Chara sp. probably depended on the peculiar hydrological features of the watering pools where water supply prevalently c o m e s f r o m p r e c i p i t a t i o n r a th e r t h a n f r o m t h e watertable. The communities dominated by bigger plants, either pleustophytes (Ceratophyllum demersum) or rhyzophytes (Myriophyllum spicatum), had lower mean values of electrical conductivity compared with the communities dominated by small pleustophytes (Lemna minuta and Spirodela polyrrhiza). This may suggest that these two types of waterplant communities were associated with waterbodies having differing levels of dissolved nutrients. As all of these communities were found in canals receiving nutrient-rich water from the surrounding arable land, a more likely explanation con-sists in greater amounts of dissolved nutrients being removed by plant uptake in the communities where plant biomass was higher.
Environmental Changes and Vegetation Dynamics The pres-ent state of the wetlands in the Natural Reserve is the result of the history and the hydraulic management of the Reserve and of the surrounding areas. Reclamation of freshwater wetlands that once surrounded the Nature Reserve has altered the balance of the aquifer, enhanc-ing the intrusion of the saline wedge. Furthermore, in-creasing subsidence rates hamper the hydrological
turnover in the Natural Reserve (Caschetto et al. 2016), which is largely situated below the sea level. As a com-bined effect of these causes, electrical conductivity in the water is strongly increasing (2034 ± 343 μS cm−1 in 2003 vs. 7410 ± 1210μS cm−1in 2016; Fig.4). Progressing saltwater intrusion may imply expansion of halophilic species and communities in the hygrophytic and helophytic vegetation. Hence, rare species occurring in poorly to moderately saline hab-itats, such as Euphorbia lucida, Hydrocotyle vulgaris, Teucrium scordium and, to a lesser extent, Juncus subnodulosus and Cladium mariscus may be out-competed by species preferring more strongly saline conditions. Saltwater may also impact waterplant species and communities if the intrusion of the saline wedge turns freshwater into brackish water. This may have neg-ative effects on the locally rare species Chara vulgaris, C. intermedia, and Ranunculus peltatus ssp. baudotii.
Two sources of eutrophication may impact the wet-lands in the Nature Reserve. The main source of eutro-phication consists in influx of nutrient-rich saltwater by the intrusion of saline wedge from the adjacent lagoon. Our results show that the vegetation of brackish wetlands presently acts as an effective filter in removing nutrients, thus reducing the influx of nutrients to oligotrophic hab-itats. However, if the nutrient load in the lagoon in-creases, this may imply degradation of salt-tolerant veg-etation (Deegan et al. 2012) which may hamper the fil-tering capacity of vegetation. An additional source of wetland eutrophication in the Nature Reserve is the net-work of canals conveying water from the surrounding arable land to the Nature Reserve. Agriculture is the
main source of nutrient, especially nitrate, load with ag-ricultural activities accounting for about 60% of nitrogen (N) compounds influx in the waters of arable lands in Northern Italy (Castaldelli et al. 2013). Eutrophication may increase in the near future because of a derogation from European rules (Council Directive 91/676/EEC of 12 December 1991 concerning the protection of waters against pollution caused by nitrates from agricultural sources) allowing farmers to raise the amount of manure applied to arable farms up to 250 kg N ha−1 year−1. If nitrate load increases in the next future, this may have negative effects on freshwater species preferring nitrate-poor habitats such as Cladium mariscus or Juncus subnodulosus. Both of these species are rather sensitive to eutrophication and may thus be out-competed by more tolerant species, especially Phragmites australis (see Viciani et al. 2017). On the other hand, the endangered species Kosteletzkya pentacarpos may benefit from fu-ture increases in nitrate levels (Abeli et al. 2017).
In conclusion, the wetlands of the Reserve are subject to a series of threats deriving from a complex interplay of environ-mental changes and anthropogenic alterations. Improved hy-draulic management including more accurate maintenance and higher flow rate in the canals, with consequently increased drainage capacity, could counter the saline wedge intrusion (Antonellini et al.2015). Furthermore, hydraulic management should be oriented to create a system of freshwater habitats around the area in order to reduce the influx of nitrate-rich water from canals draining agricultural land.
a
b
c
C. of Spa ang C. of Tri pan C. of J acu – J lit C. of J sub – P aus C. of J acu – J mar C. of Cla mar C. of S nig – T rav C. of J mar – G pal Wet meadows C. of Spi pol C. of Cer dem C. of Le minu C. of Chara sp. C. of Myr spi + xFig. 4 Maps of the spatial distribution of electrical conductivity in 2003 (a) and in 2016 (b) and location of the relevés for the 14 plant communities (c) with abbreviated legend for the communities (full legend in Fig.3)
Acknowledgements Prof. Giuseppe Castaldelli provided useful data and comments on nitrate loads. Dr. Roberta Marchesini did the chemical analyses. Mrs. Lorella Dell’Olmo and Dr. Roberta Marchesini assisted in drawing the maps. Mr. Mauro Menghini helped during the field work. All are kindly acknowledged. We wish to thank two anonymous re-viewers for constructive criticism on a previous version of the paper. This study was partly financed by a Grant of Ferrara University to RG.
References
Abeli, T., L. Brancaleoni, R. Marchesini, S. Orsenigo, G. Rossi, and R. Gerdol. 2017. Fertilizer application positively affects plants perfor-mance but reduces seed viability in seashore mallow (Kosteletzkya pentacarpos): Implication for biomass production and species con-servation. Annals of Applied Biology 170 (1): 263–272.https://doi. org/10.2179/11-022.
Angelini, P., L. Casella, A. Grignetti, and P. Genovesi. 2016. Manuali per il monitoraggio di specie e habitat di interesse comunitario (Direttiva 92/43/CEE) in Italia: habitat. ISPRA, Serie Manuali e linee guida, 142/2016. Rome: ISPRA.
Angiolini, C., D. Viciani, G. Bonari, and L. Lastrucci. 2017. Habitat conservation prioritization: A floristic approach applied to a Mediterranean wetland network. Plant Biosystems 151 (4): 598– 612.https://doi.org/10.1080/11263504.2016.1187678.
Antonellini, M., D.M. Allen, P.N. Mollema, D. Capo, and N. Greggio. 2015. Groundwater freshening following coastal progradation and land reclamation of the Po plain, Italy. Hydrogeology Journal 23 (5): 1009–1026.https://doi.org/10.1007/s10040-015-1263-0.
Bakker, C., J. Rodenburg, and P.M. van Bodegom. 2005. Effects of Ca-and Fe-rich seepage on P availability Ca-and plant performance in cal-careous dune soils. Plant and Soil 275 (1-2): 111–122.https://doi. org/10.1007/s11104-005-0438-1.
Bedford, B.L., D.J. Leopold, and J.P. Gibbs. 2001. Wetlands ecosystems. In Encyclopedia of Biodiversity (4th vol), ed. S.A. Levin, 781–804. Orlando: Academic Press.
Bernhardt, K.G., and M. Kropf. 2006. Schoenus nigricans (Cyperaceae) xerophytic grasslands on the NE Adriatic islands Cres and Krk (Croatia). Acta Botanica Croatica 65: 127–136.
Bilz, M., S.P. Kell, N. Maxted, and R.V. Lansdown. 2011. European red list of vascular plants. Luxembourg: Publications Office of the European Union.
Biondi, E. 2011. Phytosociology today: Methodological and conceptual evolution. Plant Biosystems 145 (Suppl): 19–29.https://doi.org/10. 1080/11263504.2011.602748.
Biondi, E., and C. Blasi. 2009. Manuale italiano di interpretazione degli Habitat della Direttiva 92/43/CEE.http://vnr.unipg.it/habitat. Accessed 18 May 2017.
Braun-Blanquet, J. 1932. Plant sociology: The study of plant communities. New York: McGraw-Hill.
Brock, M.A., D.L. Nielsen, and K. Crosslé. 2005. Changes in biotic communities developing from freshwater wetland sediments under experimental salinity and water regimes. Freshwater Biology 50 (8): 1376–1390.https://doi.org/10.1111/j.1365-2427.2005.01408.x. Brullo, S., F. Scelsi, and G. Spampinato. 2001. La vegetazione
dell’Aspromonte. Studio fitosociologico. Laruffa: Reggio Calabria. Buchwald, R. 1994. Vegetazione e odonatofauna negli ambienti acquatici
dell’Italia Centrale. Braun-Blanquetia 11: 3–77.
Caschetto, M., N. Colombani, M. Mastrocicco, M. Petitta, and R. Aravena. 2016. Estimating groundwater residence time and recharge patterns in a saline coastal aquifer. Hydrological Processes 30 (22): 4202–4213.https://doi.org/10.1002/hyp.10942.
Castaldelli, G., E. Soana, E. Racchetti, E. Pierobon, M. Mastrocicco, E. Tesini, E.A. Fano, and M. Bartoli. 2013. Nitrogen budget in a
lowland coastal area within the Po River basin (Northern Italy): Multiple evidences of equilibrium between sources and internal sinks. Environmental Management 52 (3): 567–580.https://doi. org/10.1007/s00267-013-0052-6.
Ceschin, S., V. Zuccarello, and G. Caneva. 2010. Role of macrophyte communities as bioindicators of water quality: Application on the Tiber River basin (Italy). Plant Biosystems 144 (3): 528–536.https:// doi.org/10.1080/11263500903429221.
Commission of the European Community. 1992. Council directive 92/43/ EEC of 21 May 1992 on the conservation of natural habitats and of wild fauna and flora. Official Journal L206. 22 July 1992 (Consolidated version 1 January 2007).
Commission of the European Community. 2013. Interpretation manual of European Union habitats, vers. EUR28. Brussel: European Commission, DG Environment.
Davis, J.A., and R. Froend. 1999. Loss and degradation of wetlands in southwestern Australia: Underlying causes, consequences and solu-tions. Wetlands Ecology and Management 7 (1): 13–23.https://doi. org/10.1023/A:1008400404021.
Deegan, L.A., D.S. Johnson, R.S. Warren, B.J. Peterson, J.W. Fleeger, S. Fagherazzi, and W.M. Wollheim. 2012. Coastal eutrophication as a driver of salt marsh loss. Nature 490: 388–392.https://doi.org/10. 1038/nature11533.
Den Hartog, C., and S. Segal. 1964. A new classification of the water-plant communities. Acta Botanica Neerlandica 13 (3): 367–393.
https://doi.org/10.1111/j.1438-8677.1964.tb00163.x.
Donnelly, J.P., and M.D. Bertness. 2001. Rapid shoreward encroachment of salt marsh cordgrass in response to accelerated sea-level rise. Proceedings of the National Academy of Sciences of the United States of America 98 (25): 14218–14223.https://doi.org/10.1073/ pnas.251209298.
Dudgeon, D., A.H. Arthington, M.O. Gessner, Z. Kawabata, D.J. Knowler, C. Lévêque, and C.A. Sullivan. 2006. Freshwater biodi-versity: Importance, threats, status and conservation challenges. Biological Reviews of the Cambridge Philosophical Society 81 (02): 16–182.https://doi.org/10.1017/S1464793105006950.
Edvardsen, A., and R.H. Økland. 2006. Variation in plant species richness in and adjacent to 64 ponds in SE Norwegian agricultural land-scapes. Aquatic Botany 85 (2): 79–91.https://doi.org/10.1016/j. aquabot.2006.01.015.
Evans, D., and M. Arvela. 2011. Assessment and reporting under article 17 of the habitats directive. Explanatory notes & guidelines for the period 2007–2012. Final version. July 2011. ETC-BD. European Commission, Brussel.
Florencio, M., L. Serrano, P. Siljestrom, R. Fernandez-Zamudio, P. Garcia-Murillo, and C. Díaz-Paniagua. 2014. The influence of geo-morphology on the composition of aquatic flora and fauna within a temporary pond network. Limnetica 33: 327–340.
García-Madrid, A.S., J.A. Molina, and P. Cantó. 2014. Classification of habitats highlights priorities for conservation policies: The case of Spanish Mediterranean tall humid herb grasslands. Journal for Nature Conservation 22 (2): 142–156.https://doi.org/10.1016/j. jnc.2013.10.002.
Géhu, J.M., and E. Biondi. 1988. Données sur la végétation des ceintures d’atterrissement des lacs Alimini (Salento, Italie). Documents Phytosociologiques 11: 353–380.
Gerdol, R., C. Ferrari, and F. Piccoli. 1985. Correlation between soil characters and forest types: A study in multiple discriminant analy-sis. Vegetatio 60 (1): 49–56.https://doi.org/10.1007/BF00053911. Gigante, D., F. Attorre, R. Venanzoni, A.T.R. Acosta, E. Agrillo, M.
Aleffi, and S. Zitti. 2016. A methodological protocol for annex I habitat monitoring: The contribution of vegetation science. Plant Sociology 53: 77–87.https://doi.org/10.7338/pls2016532/06.
Hrivnák, R., J. Kochjarová, H. Otáhelóvá, P. Palóve-Balang, M. Slezák, and P. Slezák. 2014. Environmental drivers of macrophyte species richness in artificial and natural aquatic water bodies—Comparative
approach from two central European regions. Annales de Limnologie– International Journal of Limnology 50 (4): 269–278.
https://doi.org/10.1051/limn/2014020.
Janssen, J.A.M. et al. 2016. European red list of habitats. Part 2. Terrestrial and freshwater habitats. England: European Union, pp. 44. https://doi.org/10.2779/091372. http://ec.europa.eu/ environment/nature/knowledge/pdf/terrestrial_EU_red_list_report. pdf.
Klosowski, S., and E. Jablońska. 2009. Aquatic and swamp plant com-munities as indicators of habitat properties of astatic water bodies in North-Eastern Poland. Limnologica 39 (2): 115–127.https://doi.org/ 10.1016/j.limno.2008.01.003.
Lacoul, P., and B. Freedman. 2006. Relationships between aquatic plants and environmental factors along a steep Himalayan altitudinal gra-dient. Aquatic Botany 84 (1): 3–16.https://doi.org/10.1016/j. aquabot.2005.06.011.
Lambert-Servien, E., G. Clemenceau, O. Gabory, E. Douillard, and J. Haury. 2006. Stoneworts (Characeae) and associated macrophyte species as indicators of water quality and human activities in the Pays-de-la-Loire region, France. Hydrobiologia 570 (1): 107–115.
https://doi.org/10.1007/s10750-006-0169-1.
Landucci, F., D. Gigante, R. Venanzoni, and M. Chytrý. 2013. Wetland vegetation of the class Phragmito-Magno-Caricetea in Central Italy. Phytocoenologia 43 (1): 67–100. https://doi.org/10.1127/0340-269X/2013/0043-0545.
Lastrucci, L., G. Bonari, C. Angiolini, F. Casini, T. Giallonardo, D. Gigante, M. Landi, F. Landucci, R. Venanzoni, and D. Viciani. 2014. Vegetation of lakes Chiusi and Montepulciano (Siena, Central Italy): Updated knowledge and new discoveries. Plant Sociology 51: 29–55.https://doi.org/10.7338/pls2014512/03.
Lastrucci, L.L., T. Guidi Lazzaro, V. Gonnelli, P. Giordani, and R. Benesperi. 2015. Different components of plant diversity suggest the protection of a large area for the conservation of a riparian eco-system. Biologia 70 (8): 1033–1041. https://doi.org/10.1515/biolog-2015-0115.
Lissner, J., and H.H. Schierup. 1997. Effects of salinity on the growth of Phragmites australis. Aquatic Botany 55 (4): 247–260.https://doi. org/10.1016/S0304-3770(96)01085-6.
Lundholm, J.T. 2009. Plant species diversity and environmental hetero-geneity: Spatial scale and competing hypotheses. Journal of Vegetation Science 20 (3): 377–391. https://doi.org/10.1111/j. 1654-1103.2009.05577.x.
Melendo, M., E. Cano, and F. Valle. 2003. Synopsis of aquatic plant-communities of the class Potametea in the southern Iberian Peninsula. Acta Botanica Gallica 150 (4): 429–444.
Nicholls, R.J., F.M.J. Hoozemans, and M. Marchand. 1999. Increasing flood risk and wetland losses due to global sea-level rise: Regional and global analyses. Global Environmental Change 9: 69–87.
https://doi.org/10.1016/S0959-3780(99)00019-9.
Orlóci, L. 1978. Multivariate analysis in vegetation research. 2nd ed. The Hague: Junk.
Pellizzari, M., and F. Piccoli. 2001. La vegetazione dei corpi idrici del Bosco della Mesola (Delta del Po). Quaderni della Stazione Ecologica del Civico Museo di Storia Naturale di Ferrara 13: 7–24. Piccoli, F., and R. Gerdol. 1984. Typology and dynamics of a wood in the Po plane (N-Italy): The BBosco della Mesola^. Colloques Phytosociologiques 9: 161–170.
Piccoli, F., R. Gerdol, and C. Ferrari. 1983. Carta della vegetazione del Bosco della Mesola (Ferrara). Atti dell’Istituto Botanico e Laboratorio Crittogamico dell’Università di Pavia 7 (2): 3–23.
Piccoli, F., M. Pellizzari, and A. Alessandrini. 2014. Flora del Ferrarese. Istituto per i Beni Artistici e Culturali. Regione Emilia-Romagna. Bologna: Longo.
Pott, R. 2011. Phytosociology: A modern geobotanical method. Plant Biosystems 145 (Suppl): 9–18.https://doi.org/10.1080/11263504. 2011.602740.
Rossi, G., S. Orsenigo, C. Montagnani, G. Fenu, D. Gargano, L. Peruzzi, R.P. Wagensommer, B. Foggi, G. Bacchetta, G. Domina, F. Conti, F. Bartolucci, M. Gennai, S. Ravera, A. Cogoni, S. Magrini, R. Gentili, M. Castello, C. Blasi, and T. Abeli. 2016. Is legal protection suffi-cient to ensure plant conservation? The Italian Red List of policy species as a case study. Oryx 50 (03): 431–436.https://doi.org/10. 1017/S003060531500006X.
Sakurai, Y., K. Yabe, and K. Katagiri. 2017. Factors controlling changes in the aquatic macrophyte communities from 1984 to 2009 in a pond in the cool-temperate zone of Japan. Limnology 18 (2): 153–166.
https://doi.org/10.1007/s10201-016-0498-3.
Sousa, A., A.I. Lillebø, I. Caçador, and M. Pardal. 2008. Contribution of Spartina maritima to the reduction of eutrophication in estuarine systems. Environmental Pollution 156 (3): 628–635.https://doi. org/10.1016/j.envpol.2008.06.022.
Spalding, E.A., and M.W. Hester. 2007. Interactive effects of hydrology and salinity on oligohaline plant species productivity: Implications of relative sea-level rise. Estuaries and Coasts 30 (2): 214–225. Stampi, P. 1966. Il Gran bosco della Mesola (Ferrara): notizie storiche,
floristiche e geobotaniche. Annali di Botanica (Roma) 28: 599–612. Tappin, A.D. 2002. An examination of the fluxes of nitrogen and phos-phorus in temperate and tropical estuaries: Current estimates and uncertainties. Estuarine Coastal and Shelf Science 55 (6): 885– 901.https://doi.org/10.1006/ecss.2002.1034.
ter Braak, C.J.F., and P.Šmilauer. 2012. Canoco reference manual and User’s guide: Software for ordination (version 5.0). Ithaca: Microcomputer Power.
Turner, R.E. 1990. Landscape development and coastal wetland losses in the Northern Gulf of Mexico. American Zoologist 30 (1): 89–105. Turner, B.L. 2008. Resource partitioning for soil phosphorus: A
hypoth-esis. Journal of Ecology 96 (4): 698–702.https://doi.org/10.1111/j. 1365-2745.2008.01384.x.
Van der Maarel, E. 1979. Transformation of cover-abundance values in phytosociology and its effects on community similarity. Vegetatio 39: 97–144.
Viciani, D., L. Lastrucci, L. Dell’Olmo, G. Ferretti, and B. Foggi. 2014. Natura 2000 habitats in Tuscany (Central Italy): Synthesis of main conservation features based on a comprehensive database. Biodiversity and Conservation 23 (6): 1551–1576.https://doi.org/ 10.1007/s10531-014-0686-6.
Viciani, D., L. Dell’Olmo, C. Vicenti, and L. Lastrucci. 2017. Natura 2000 protected habitats, Massaciuccoli Lake (northern Tuscany, Italy). Journal of Maps 13: 219–226.
Watt, S.C.L., E.G. Berthou, and L. Vilar. 2007. The influence of water level and salinity on plant assemblages of a seasonally flooded Mediterranean wetland. Plant Ecology 189 (1): 71–85.https://doi. org/10.1007/s11258-006-9167-7.
Zaldivar, J.M., A.C. Cardoso, P. Viaroli, A. Newton, R. de Wit, C. Ibanez, S. Reizopoulou, F. Somma, A. Razinkovas, A. Basset, M. Holmer, and N. Murray. 2008. Eutrophication in transitional waters: an over-view. Transitional Waters Monographies 1: 1–78.