1
Faculty of Mathematical, Physical and Natural Sciences Department of Earth Sciences
Landslide damming: implications for natural
hazards and risks
PhD Candidate: Javad Rouhi Cycle: XXXII
Curriculum: Geosciences
Tutor: Professor Salvatore Martino Co-Tutor: Professor Marta Della Seta
2
Acknowledgement
Completion of this doctoral dissertation was possible with the scientific and spiritual supports of several individuals. I would like to express my sincere gratitude to all of them.
I am extremely grateful to my tutor Prof. Salvatore Martino and co-tutor Prof. Marta Della Seta who have been tremendous mentors for me. I would like to thank them for all their supports, patience with me during our regular meetings and all the great scholarly comments and suggestions for my thesis and for allowing me to grow as a researcher all along the way.
I would like to thank Mr. Luigi Marino for his great support during the laboratory tests.
I would like to thank the manager and staffs of Forest, Range & Watershed Organization of Pol-e-Dokhtar, Eng. Shahram Mir Rezai, Eng. Soleimani for their great supports and collaboration during my field survey in Pol-e-Dokhtar and their disponibility.
I would also like to thank my brother Dr. Jafar Rouhi for all his supports.
Finally, this thesis is dedicated to my father and my mother, whose encouragement made me motivated to reach a fruitful end in my studies. My heartfelt thanks are for all the sacrifices that they have made on my behalf.
3
Table of Contents
List of Figures 5 List of Tables 7 List of Equation 8 Abstract 9 Introduction 11Chapter 1- State of the art 13
1.1 Landslide damming 13
1.2 Seymareh landslide 18
Chapter 2- Geological setting 21
2.1 Stratigraphic and Geo-structural features 21
2.2 Geomorphological features 26
Chapter 3- Morphometric analysis 48
3.1 Material and methods 48
3.2 Results 68
Chapter 4- Soil properties of the landslide debris 74
4.1 Introduction 74
4.2 Grain size analysis 75
4.2.1 Photographic technique 75
4.2.2 Classification based on USCS standard (D2487-17) 78
4.2.3 Statistical classification 79
4.3 In-situ density (D2167-15) and permeability tests (D2434-68) 82
4.4 Results 87
4.4.1 USCS classification 87
4.4.2 Statistical classification 89
4.4.3 Permeability tests 92
Chapter 5- Geological model of the landslide debris 95
4
5.2 Results 104
Chapter 6- Discussion 105
Chapter 7- Conclusions 114
References 116
Web Site References 126
5
List of Figures
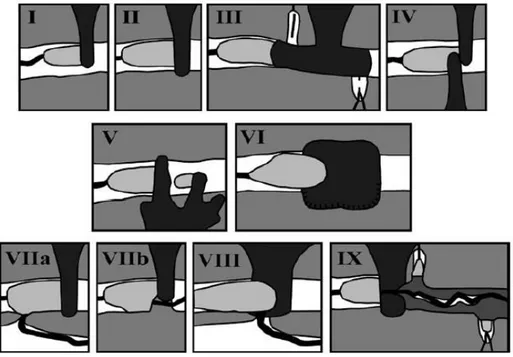
FIGURE 1LANDSLIDE DAM TYPES I–VI BY COSTA AND SCHUSTER 1988 AND NEW PROPOSED DAM TYPES BY
HERMANNS ET AL.2011 14
FIGURE 2GEOLOGICAL MAP OF THE SEYMAREH LANDSLIDE AREA 22
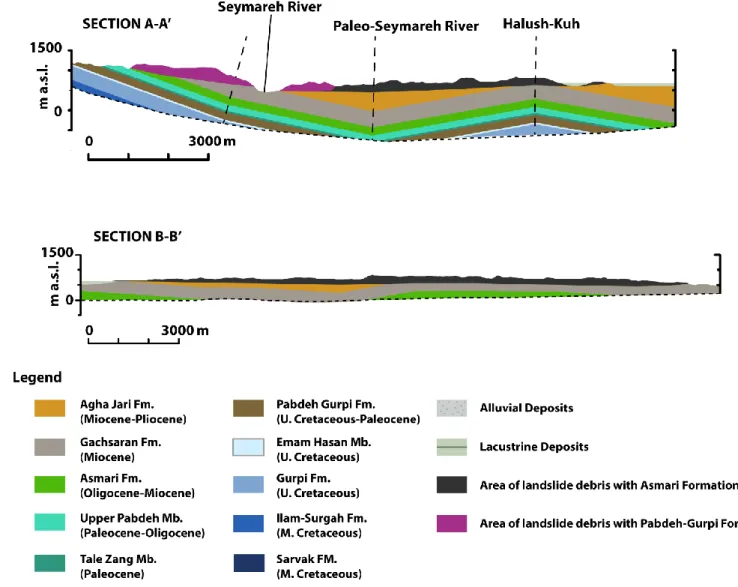
FIGURE 3CROSS SECTIONS ACROSS THE SEYMAREH LANDSLIDE DEBRIS ACCORDING TO THE REVISED
STRATIGRAPHIC COLUMN FOR THE SEYMAREH RIVER VALLEY 23
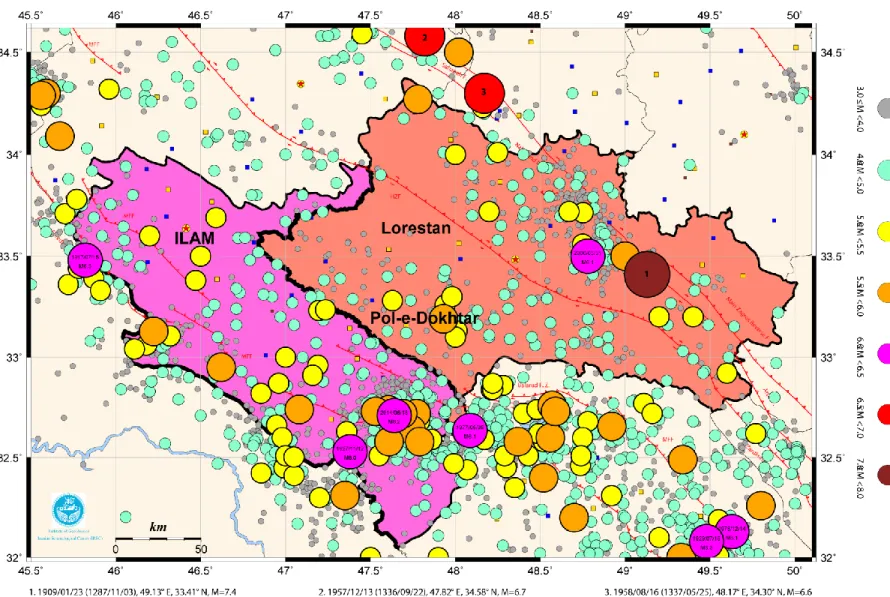
FIGURE 4EARTHQUAKE EPICENTER &MAJOR FAULTS MAP OF LORESTAN &ILAM, MAP N.12-B(COLLECTED BY
DEZVARE,M.,NASERIEH,S.,ROUHI,A&BOROMAND,B.2015)INSTITUTE OF GEOPHYSICS,IRANIAN
SEISMOLOGICAL CENTER (IRSC) 25
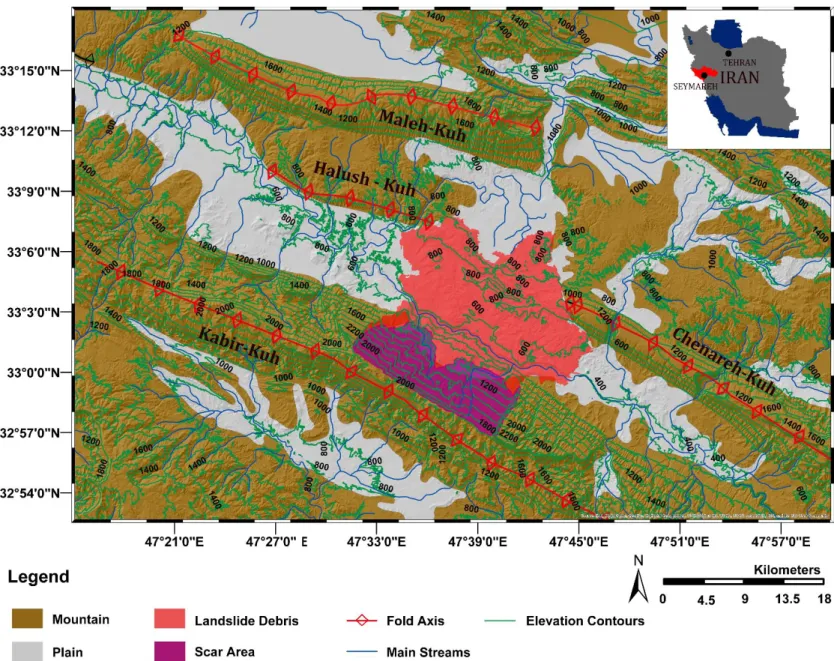
FIGURE 5MAIN MORPHO-STRUCTURES IN THE STUDY AREA 26
FIGURE 6OMBRO-THERMIC CURVE OF POL-E-DOKHTAR 28
FIGURE 7THE POL-E-DOKHTAR AND DARREH-SHAHR WATERSHEDS 29
FIGURE 8MECHANICAL WEATHERING 31
FIGURE 9CHEMICAL WEATHERING 32
FIGURE 10BIOLOGIC WEATHERING 33
FIGURE 11WATER EROSION 33
FIGURE 12HEADWARD EROSION 34
FIGURE 13GULLY EROSION 35
FIGURE 14FLOOD EROSION 36
FIGURE 15BAHRAM CHUBIN GORGE 37
FIGURE 16GORGES 37
FIGURE 17CLIFFS DUE TO THE DETACHMENT OF A PART OF THE ASMARI FORMATION 38
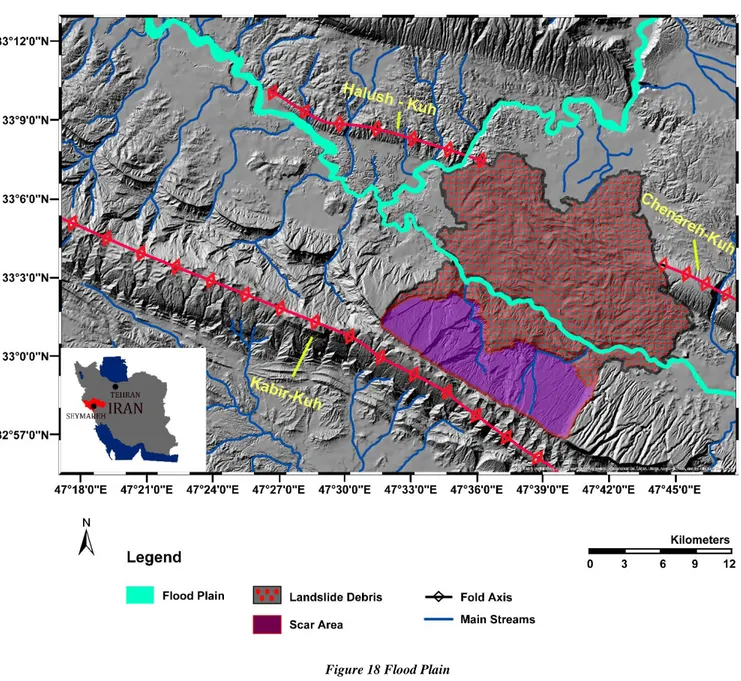
FIGURE 18FLOOD PLAIN 39
FIGURE 19ALLUVIAL DEPOSIT ON THE SEYMAREH LANDSLIDE DEBRIS 40
FIGURE 20THE LACUSTRINE DEPOSIT OF THE SEYMAREH LAKE 41
FIGURE 21ALLUVIAL FANS ON THE SEYMAREH LANDSLIDE DEBRIS 42
FIGURE 22DENUDATION SCARP ON THE LANDSLIDE DEBRIS 42
FIGURE 23RIDGES ON THE SEYMAREH LANDSLIDE DEBRIS 43
FIGURE 24SPRINGS AND LAKES LOCATION 44
FIGURE 25EXTENSIONAL TRENCHES ON THE LANDSLIDE DEBRIS 46
FIGURE 26EXTENSIONAL TRENCHES ON THE LANDSLIDE DEBRIS 46
FIGURE 27EXTENSIONAL TRENCHES ON THE LANDSLIDE DEBRIS 47
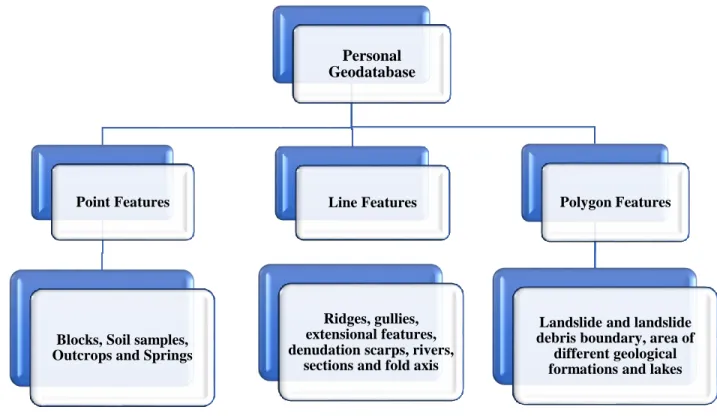
FIGURE 28FLOW CHART ILLUSTRATING THE STRUCTURE OF THE SPECIFICALLY DESIGNED GEODATABASE 50
FIGURE 29SCHEME OF HOW THE LINE DENSITY TOOL OPERATES 51
FIGURE 30SCHEME OF HOW THE POINT DENSITY TOOL OPERATES 52
FIGURE 31SCHEME OF HOW THE AGGREGATE TOOL OPERATES 53
FIGURE 32THE LANDSLIDE DEBRIS ZONATION BASED ON THE TONE, TEXTURE AND STRUCTURE OF THE AERIAL
PHOTOS 54
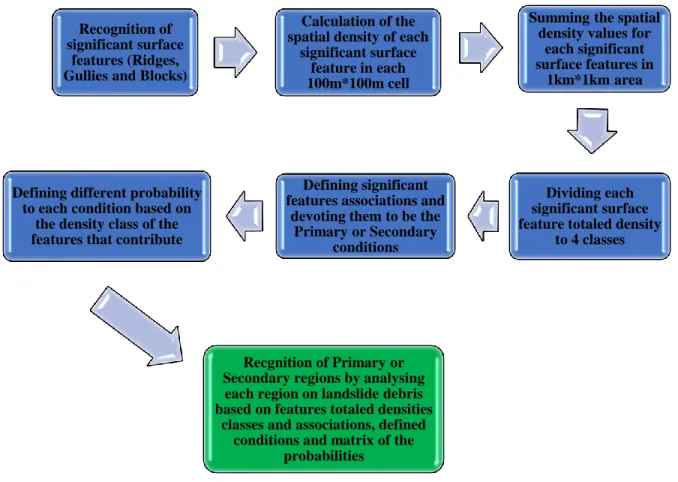
FIGURE 33FLOWCHART SHOWING THE HERE ADOPTED PROCEDURE FOR RECOGNITION OF PRIMARY OR
SECONDARY REGION 57
FIGURE 34EXAMPLES OF ZONES WITH DIFFERENT EVIDENCES FOR PRIMARY CONDITIONS DEDUCED BY
CONSIDERING DIFFERENT LANDFORM ASSOCIATIONS 60
FIGURE 35EXAMPLES OF ZONES WITH DIFFERENT EVIDENCES FOR SECONDARY CONDITIONS DEDUCED BY
CONSIDERING DIFFERENT LANDFORM ASSOCIATIONS 60
FIGURE 36ZONATION OF ORIGINAL (PRIMARY) AND RESHAPED (SECONDARY) REGIONS OF THE SEYMAREH
LANDSLIDE DEBRIS AND RELATED PROBABILITY 65
FIGURE 37GRAPHICAL VIEW OF THE AZIMUTHAL DISTRIBUTION OF THE KINEMATIC INDICATORS FOR EACH
6
FIGURE 38GEOMORPHOLOGICAL MAP INCLUDING THE MAIN LANDFORMS SURVEYED WITHIN THE DEBRIS OF
THE SEYMAREH LANDSLIDE 68
FIGURE 39RIDGES DENSITY ZONATION 69
FIGURE 40GULLIES DENSITY ZONATION 70
FIGURE 41BLOCKS DENSITY ZONATION 72
FIGURE 42WATERSHED AND LONGEST FLOW PATHS 73
FIGURE 43THE FULL IMAGE TO BE ANALYZED ON THE WORKING SURFACE OF THE BASEGRAIN SOFTWARE 75
FIGURE 44FINAL RESULT OF AUTOMATIC OBJECT DETECTION PROCEDURE.STRAIGHT LINES (COLOR PRINT:
BLUE) REPRESENT A-AXIS AND B-AXIS OF ELLIPSES FITTED TO EACH OBJECT USING NORMALIZED SECOND CENTRAL MOMENTS OF DETERMINED OBJECT AREAS.PIXELS OF GRAIN BOUNDARIES ARE HIGHLIGHTED
(COLOR PRINT: RED).GRAINS WITH CONTACT TO ENCLOSING FRAME ARE BLANKED OUT.FIRST
ESTIMATION OF FRACTIONAL WEIGHTED MEAN DIAMETER DM IS GIVEN AT BASELINE INFORMATION BAR. 77 FIGURE 45EFFECT OF INTERACTIVE POST-PROCESSING ON PRE¬CISION OF OBJECT DETECTION PROCEDURE.
LEFT: AFTER POST-PROCESSING, RIGHT: BEFORE POST PROCESSING. 78 FIGURE 46GRAPH OF D10-D60 OF SOIL SAMPLES IN THE ASMARI FORMATION DEBRIS 79
FIGURE 47GRAPH OF AVERAGE VALUE OF EACH CLASS BASED ON D10 AND D60 WITH THEIR STANDARD
DEVIATION IN THE ASMARI FORMATION DEBRIS 80
FIGURE 48GRAPH OF D50-CU OF ALL SAMPLES IN THE ASMARI FORMATION DEBRIS 81
FIGURE 49GRAPH OF AVERAGE VALUE OF EACH CLASS BASED ON D50 AND CU WITH THEIR STANDARD
DEVIATION IN THE ASMARI FORMATION DEBRIS 81
FIGURE 50TEXTURE OF THE SEYMAREH LANDSLIDE DEBRIS 82
FIGURE 51GRAPH OF EFFECTIVE STRESS VS. DENSITY AS DERIVED BY LABORATORY TESTS ON THE FINE-GRAINED
PORTION OF THE SAMPLES 84
FIGURE 52GRAPH OF PERMEABILITY VS. DENSITY AS DERIVED FROM THE PERFORMED LABORATORY TESTS 84
FIGURE 53GRAPH OF STRESS-DENSITY-DEPTH 85
FIGURE 54GRAPH OF STRESS VS. PERMEABILITY 85
FIGURE 55GRAPH OF DENSITY VS. DEPTH 86
FIGURE 56USCS CLASSIFICATION OF ALL SAMPLES 88
FIGURE 57GRAIN SIZE DISTRIBUTION OF SAMPLES IN THE ASMARI FORMATION DEBRIS 89 FIGURE 58GRAIN SIZE DISTRIBUTION OF SAMPLES IN THE PABDEH-GURPI FORMATION DEBRIS 90
FIGURE 59 DISTRIBUTION OF GRAIN SIZE CLASSES OF THE DEBRIS MATRIX IN THE ASMARI FORMATION AREA 91
FIGURE 60AREAS WITH DIFFERENT PERMEABILITY BASED ON THE LABORATORY TESTS PERFORMED ON THE
SAMPLES OF DEBRIS MATRIX 93
FIGURE 61PERMEABILITY SECTION ON THE DEBRIS 94
FIGURE 62OUT CROPS OF GACHSARAN FORMATION ALONG THE SEYMAREH RIVER 95
FIGURE 63THE LOCATION OF OUTCROPS OF GACHSARAN FORMATION AND SECTIONS 96
FIGURE 64SECTION 1-1’ AND 2-2’ 97
FIGURE 65SECTION 3-3’ AND 4-4’ 98
FIGURE 66SECTION 5-5’ AND 6-6’ 99
FIGURE 67SECTION 7-7’ 100
FIGURE 68SECTION 8-8’ AND 9-9’ 101
FIGURE 69SECTION 10-10’ AND 11-11’ 102
FIGURE 70SECTION 12-12’ AND 13-13’ 103
FIGURE 71KINEMATIC INDICATORS ON THE SEYMAREH LANDSLIDE DEBRIS 106
FIGURE 72STRESS ZONES FORMED ON THE LANDSLIDE DEBRIS DURING MASS EMPLACEMENT 108
FIGURE 73EVIDENCES THAT HELPS TO RECOGNIZE THE FAILURE MECHANISM OF THE LANDSLIDE DEBRIS
(GULLIES AZIMUTHAL DIRECTION IN THE SECONDARY REGIONS, SPRINGS AND PERMEABILITIES) 111
FIGURE 74USCS CLASSIFICATION OF THE FINE-GRAINED SAMPLES 129
7
List of Tables
TABLE 1TOTAL MONTHLY AVERAGE PRECIPITATION OF POL-E-DOKHTAR 27
TABLE 2TOTAL MONTHLY AVERAGE TEMPERATURE OF POL-E-DOKHTAR 27
TABLE 3DETAILS OF THE LAKES ON THE THE SEYMAREH LANDSLIDE DEBRIS 45
TABLE 4DETAILS OF THE SPRINGS AROUND THE SEYMAREH LANDSLIDE DEBRIS 45
TABLE 5DIFFERENT ZONES ON THE LANDSLIDE DEBRIS BASED ON TONE, TEXTURE AND STRUCTURE OF AERIAL
PHOTOS 54
TABLE 6DENSITY RANGES ADOPTED FOR RIDGES, GULLIES AND BLOCKS 58
TABLE 7THE RANGE OF TOTALED DENSITY VALUE FOR EACH 1KM2 58
TABLE 8THE RIDGES, GULLIES AND BLOCKS TOTALED DENSITIES CLASSES 58
TABLE 9LANDFORMS ASSOCIATIONS FOR DEFINING PRIMARY AND SECONDARY CONDITIONS 61
TABLE 10PROBABILITY OF LANDFORM ASSOCIATIONS WHICH PROVIDE A RANK TO THE ATTRIBUTION OF
PRIMARY OR SECONDARY CONDITIONS 61
TABLE 11MATRIX OF PROBABILITIES 62
TABLE 12RIDGES CLASSIFICATION BASED ON THEIR CURVATURE RANGE 66
TABLE 13 KINEMATIC INDICATORS CLASSIFICATION BASED ON THEIR AZIMUTHAL DIRECTION RANGES 66
TABLE 14GULLIES CLASSIFICATION BASED ON THEIR AZIMUTHAL DIRECTION RANGES 67
TABLE 15RANGE OF D10 AND D60 FOR EACH CLASS 80
TABLE 16MORPHOMETRIC PARAMETERS OF THE SEYMAREH LANDSLIDE 112
TABLE 17EVALUATION OF THE SEYMAREH AND KASHKAN LANDSLIDE DAMS BY SOME INDICES 112
TABLE 18LOCATION OF THE PHOTOS 127
8
List of Equation
LINE DENSITY= (L1 ∗ V1) + (L2 ∗ V2) (AREA OF CIRCLE) EQUATION 1LINE DENSITY ... 51 POINT DENSITY= (NUMBER OF POINTS) AREA OF CIRCLE EQUATION 2POINT DENSITY ... 52
9
Abstract
Understanding the landslide debris emplacement kinematics and the landslide failure mechanisms is essential for the definition of hazard and for the reconstruction of risk scenarios functional to mitigation strategies. Landslides in the southwest of Iran are particularly numerous, especially in the Zagros sedimentary basins. According to some estimates based on studies and research conducted to date, between 10,000 and 11,000 years ago, a large landslide (estimated maximum volume of 44 Gm3) took place in the city of Pol-e-Dokhtar near the Lorestan region (west sector of Iran). Because this landslide has blocked the course of the Seymareh River, it is known as the Seymareh landslide. This giga-landslide is considered the largest on the Earth's surface.
In the present PhD thesis, in order to find key interpretative elements and parameters for describing the longevity, the emplacement kinematics and the rupture style of the Seymareh landslide debris, morphological elements were found with high detail visible in the enormous landslide debris. After mapping the morphological elements, a zonation of the landforms in the landslide debris was performed by computing the spatial density of the main surface features including ridges, gullies and blocks. In the next step, using the zonation of the main surface features, a statistical approach was applied to zone the landslide debris in primary (original) and secondary (modified) regions which are respectively referred to the original shape of the landslide debris and to the one modified by erosions. This statistical approach in combination with kinematics indicators deduced from ridges direction and blocks distribution in primary regions provides a useful interpretation for the landslide kinematics as well as for the landslide debris emplacement.
During a specific campaign, soil samples, representative of the landslide debris matrix, were also taken at different points of the debris, to be able to characterize them in the laboratory and classify them according to the USCS standard and to derive the permeability of finer portions in view of future hydraulic models aiming at quantifying the natural dam durability.
The obtained results were useful for understanding the mechanism and kinematics of the Seymareh landslide debris and its evolution. They also helped us to better constrain the failure mechanism of the Seymareh landslide and will be useful for obtaining risk scenarios, quantifying the related hazard and plan mitigation strategies.
10
Moreover, the landslide debris emplacement mechanism and kinematics deduced from kinematic indicators in the primary regions of the landslide debris as well as some outcrops of geological bedrock observed during field surveys led to the recognition of the basal surface of the landslide debris, making it possible to hypothesize the buried morphology of the paleo-valley of the Seymareh River.
11
Introduction
Understanding the physical property and emplacement of landslide debris by recognition and zonation of surface features and the matrix of landslide debris in giant landslide mass can provide insights for the zonation in sectors characterized by different behavior helping to better constrain failure mechanisms; moreover, it is useful to define hazard and consequent risk scenarios for mitigation strategies.
This current PhD thesis aims to find key interpretative elements and parameters for describing the longevity, the emplacement kinematics and the rupture style of the giant Seymareh landslide dam (western Zagros Mts., Iran), as a function of dam morphometry, sedimentology and geotechnical properties.
Since natural landslide damming can occur at different scales and in different contexts worldwide, definition of the hazard and consequent risk scenario due to the formation and failure of the Seymareh natural dam could be an extreme reference for future events.
This study infers to the management of risks associated to the effects of landslide damming. The first risk condition can be associated to the upstream submersion and downstream flooding of lands previously inhabited and/or exploited for rural activities. The second risk condition is associated to increasing erosion rate by the river after dam cutting, which can cause increased sediment to supply downstream. Furthermore, as an effect of landslide damming, slope instabilities can be activated in the areas surrounding the lake (due to both submersion by the lake and increased river erosion). All these features can be generally recognized in worldwide cases, but since the Seymareh is one of the largest known landslide dams in the world, this study could provide extreme reference hazard conditions and related risks associated to landslide damming.
The main steps performed in this doctoral thesis can be summarized as follows:
Chapter 1: it provides a literature review regarding the landslide damming and performed investigation for understanding their complex behavior. This chapter also provides a literature review specifically on the Seymareh landslide.
Chapter 2: it focuses on the study area, according to geological setting, seismicity, climate and geomorphological features. It introduces the most important parameters that plays a significant role in shaping different landforms. Then, describes the morpho evolutionary processes in the study area.
12
Chapter 3: in this chapter of the thesis, the Seymareh landslide debris boundary, as well as the ridges, gullies, denudation scarps, extensional features, springs and blocks on the landslide debris are recognized and mapped in GIS through the interpretation of satellite optical images (Google Earth and aerial photos) followed by a field survey. Then a new statistical approach based on analyzing the spatial density of main features is proposed that recognizes the primary and secondary zones on the landslide debris area. Following the results of this chapter are demonstrated.
Chapter 4: in this chapter of the thesis, the grain size distribution of Seymareh landslide debris is determined by applying 2 sampling techniques and 3 analyzing methods and the permeability of debris is measured. Following the results of this chapter are demonstrated.
Chapter 5: it defines the geological model of the landslide debris.
Chapter 6: this chapter discusses the emplacement kinematics, the longevity and the rupture style of the Seymareh landslide debris.
13
Chapter 1- State of the art
1.1 Landslide damming
Landslide damming is a relatively common occurrence in hilly and mountainous areas caused by landslide which reaches a valley floor and closes the riverbed (Costa and Schuster 1988; Ermini and Casagli 2003; Korup 2004; Evans et al. 2011; Coico et al. 2013; Tacconi Stefanelli et al. 2016; Fan et al. 2017). If a lake forms upstream of a landslide dam, it may pose serious threats to people and their property due to upstream inundation and downstream flood generated by breaching of such dams, initiation of other landslides and debris flows (Chen et al. 2011; Evans et al. 2011; Peng and Zhang 2012; Fan et al. 2017). Most of the rockslide dams are emplaced during strong earthquakes and torrential rainfalls (Costa and Schuster 1988; Ermini and Casagli 2003; Korup 2004; Evans et al. 2011; Peng and Zhang 2012). The consequence of landslide damming in the regions with high population can be dramatic. By increasing the knowledge on landslide damming, in some cases, it is possible to mitigate these situations by planning some mitigation strategies. When this is not possible, for little knowledge on landslide damming and for technical limitations (related to available time and to size of the phenomenon), landslide dams may represent big hazards (Tacconi Stefanelli et al. 2015). Therefore, evaluation of the stability and potential hazard and risk of landslide dams is very important for the mitigation measures (Ermini and Casagli 2003; Dal Sasso et al. 2014).
Costa and Schuster (1988) by focusing on the relation between the landslide deposit and the underlying geomorphology classified landslide dams in six types (Figure 1). Despite the existence of different classification systems (Varnes 1978; Cruden 1996; Hungr et al. 2014) their classification system has been preferred since its development in 1988. Hermanns et al. (2011) by studying 20 landslide dams formed by landslides with volumes more than 106 m3 in Argentina found that some of them did not fit with the Costa and Schuster landslide dam classification and defined a further landslide dam type (Figure 1). The classes added are not new morphological forms of rock avalanche deposit, but instead represent varied river response to the Type II blockages of Costa and Schuster (1988).
Different morphological parameters control the emplacement mechanism, kinematics and behavior of landslide dams (Erminiand Casagli 2003, Tacconi Stefanelli et al. 2016, Rouhi et al.
2019). The parameters describing the geomorphology of the valley such as valley width, slope angle and the height of the release area exert control on the emplacement mechanism and
14
kinematics of the landslide deposit (Erminiand Casagli 2003, Tacconi Stefanelli et al. 2016, Rouhi et al. 2019), and indirectly control the likelihood of landslide dam formation (Nicoletti and Sorriso-Valvo 1991).
Landslide dams can be characterized by morphological parameters such as: the size and shape of the depositional feature (Tacconi Stefanelli et al. 2015). In the case of cut landslide dams, the size, shape and distribution of features on their surface helps to forecast the cutting process.
Some authors by extracting the geomorphic parameters of landslide dams conducted inventories for some countries in the world. These include New Zeland inventories which consist of 232 dams (Korup 2004) the Swiss inventories with 31 cases (Bonnard et al. 2011), Chinese inventories with 1239 cases (Peng and Zhang 2012), 828 cases during Wenchuan earthquake (Fan et al. 2012a, b), 51 cases in the Cordillera Blanca Mountains, Peru (Tacconi Stefanelli et al. 2018) and in Italy, some authors compiled landslide dams inventories covering different portions of the Italian territory (Pirocchi, 1992; Casagli and Ermini, 1999; Coico et al. 2013) at different scales and with different standards of detail. Tacconi Stefanelli et al. (2015) homogenized these inventories and new data to set a national-scale archive of 300 landslide dams occurred in Italy.
Figure 1 Landslide dam types I–VI by Costa and Schuster 1988 and new proposed dam types by Hermanns et al. 2011
15
Some inventories of landslide dams with the intention to investigate the longevity (Ermini and Casagli, 2003; Tacconi Stefanelli et al. 2015) and failure mechanism (Schuster and Costa
1988; Evans et al. 2011) of dams that fails were obtained so far. These inventories show that landslide dams fail by three processes including: overtopping, piping and sliding collapse. They also express that landslide dams may last for some minutes or several thousand days and 50% of failed rockslide dams, failed within 10 days of their formation.
The interpretation of landslide dam failure is a complex topic, because of the numerous variables involving the hydrodynamic interference between landslides, rivers and dam creation at the same time.
Numerous attempts have been made to investigate the complex behavior of the landslide dams. Some authors using landslide dams’ inventories, proposed some geomorphic indexes (Swanson et al. 1986; Ermini and Casagli 2003; Coico et al. 2013; Dal sasso 2014) to predict the formation and evolution of landslide dams. These indexes result from the composition of two or more morphological attributes that characterize the landslide (e.g. landslide volume or length) and the involved river valley (e.g. valley width). They proved that these indexes could be a useful tool for making accurate predictions concerning the stability of landslide dams. Nash (2003) took into consideration the block size and proposed Modified Dimensionless Blockage Index (MDBI) and show that the average block size (D50) of the dam material exerts significant influence on dam
longevity and evolution.
Recently, Tacconi Stefanelli et al. (2016) to overcome some limitations of other indexes, introduced two new ones: The Morphological Obstruction Index (MOI) and the Hydro morphological Dam Stability Index (HDSI) and analyzed about 300 landslide dam events extended all over Italy. The newly proposed indexes (Tacconi Stefanelli et al. 2016) show an improvement in the forecasting effectiveness and have the advantage of being based on morphometric input parameters that can be easily and quickly assessed on a distributed way even over large area.
These indexes consider mainly geomorphic variables characterizing both the landslide (e.g. landslide volume or length) and the river channel (e.g. valley width) to understand the key parameters controlling the stability and evolution of landslide dams, and to use them for providing a better modified geomorphic index. Generally, the stability and evolution of a landslide dam should be assessed based on numerical simulations or an experimental model (Chen et al, 2011). In most cases, numerous accurate parameters and materials are not easily accessible, therefore for
16
an immediate evaluation of landslide dams’ stability, geomorphic valley parameters and morphometric dam parameters should be analyzed (Jakobsen, 2016). A comprehensive formula or approach for assessing the behavior of landslide dams should consider all parameters related to the landslide, landslide dam and river.
Since the erosional processes on landslide dams which lead to their failures by overtopping or piping depends on grain size distribution of the debris material (Swanson et al., 1986;Costa and Schuster, 1988; Pirocchi, 1992; Casagli and Ermini, 1999) and its effects on the seepage rate through the debris, a branch of research activity directed to the prediction of landslide dam behavior is focused on the study of grain size distribution of the debris material composing a landslide dam (Casagli et al. 2003). The acquisition of grain size data is extremely important for the correct interpretation of the evolution of landslide dams. Despite its importance, the investigations aimed at determining the grain size distribution of landslide dams have never been standardized. This is mainly a consequence of the problems related to the phase of sampling debris materials and deposit heterogeneity that often range in size from blocks of tens of cubic meters, to very fine particles (Dufresne and Dunning 2017).
Casagli et al. (2003) applied different techniques for sampling and processing the grain size distribution of landslide dams in the Northern Apennines and concluded that the landslide dam debris sampling and grain size data processing remain very difficult and uncertain processes which requires further tests. They suggest that a complete description of the grain size distribution of heterogeneous materials composing landslide dams can be carried out only by integrating the results gathered by applying volumetric techniques to the finer material and grid by number to the coarser part.
Dunning et al. (2005) studied rock avalanche deposit and proposed three facies approach (the Carapace, Body, and Basal facies) for analyzing the rock avalanche deposits. Based on three facies approach, surface and near-surface material are Carapace facies and these facies can account for as much as 30 % of a deposit by thickness, but for considerably less by mass due to the large void spaces present. The Carapace is an assemblage of large, angular interlocking blocks created during the collapse of the bedrock slope and transported along the near surface of the rock avalanche and is characterized by high hydraulic conductivities, in the region of 0.1 ms-1 for a relatively fine carapace of argillite (Falling Mountain, New Zealand). The Body facies is beneath the carapace and forms the bulk of most rock avalanche deposits. The material of body facies is
17
angular, poorly sorted, and highly fragmented. The Body facies retains the original source stratigraphy in the final deposit, often as a series of sub-horizontal bands stretched during motion regardless of the original source rock orientations and an argillite sample in the interior of the Falling Mountain rock-avalanche deposit yielded hydraulic conductivity values of around 3 x 10
-3 ms-1 and porosity of around 20 % (Dunning et al. 2005). Dunning (2006) carried out field and
laboratory sieve method combined with laser granulometry to characterize the sedimentology of five rock avalanches deposits around the world and concluded that the grain size distributions of the deposits were controlled by their source lithological variation rather than transport mechanism. Therefore, different rock avalanches have different grain size distributions and compositions, but the broad grain-size distributions (from microns to meters) exist in all deposits. Dufresne et al. (2016) showed that rock avalanche and rockslide depositional facies are primarily process dependent, but that their degree of development can be strongly influenced by lithology, travel distance, and external influences such as shear-interruption by sediment injection. Later, in (2017) Dufresne and Dunning studied the deposits of two carbonate rock avalanches by sampling based on different defined facies for understanding the processes underlying rock avalanche emplacement and concluded that each facies produce a unique grain size distribution, and their histograms can serve as a tool for facies/process identification and for sensible comparison between deposits and lithologies.
Bianchi Fasani et al. (2011) evaluate possible erosion, overtopping and piping of the Scanno rockslide dam based on geological, geophysical and hydrogeological investigations and demonstrate the importance of geological models in understanding and predicting the longevity of rockslide dams. Later in 2014, Bianchi Fasani et al. hypothesized a cause–effect relationship between the geodynamic evolution of an orogenic belt and a rock avalanche. Della Seta et al. (2017) in the framework of morpho-structural evolution of an area has constrained the past rock avalanche events for depicting future hazard scenarios through numerical forward analysis. Longchamp et al. (2016) analyzed rock avalanche dynamics and deformation process by a detailed structural analysis of the deposits coming from data of 3-D measurements of mass movements which leads to the identification of three regimes (extensional, compressional and shearing) during the propagation of the mass.
Some authors tried to understand failure mechanism of landslide dam after their formation for mitigation measures based on experimental studies. For example, Zhang et al (2012) performed
18
13 flume experiments to calculate the erosion and sediment transport rate during the processes of dam break caused by overtopping and concluded that the maximum value of erosion coefficient always occurs near the downstream edge of the dam crest and the length of the dam crest, the inner slope and the dam composition affect the sediment transport during the dam breakage processes. Zhou et al (2013) through a set of model’s experiments investigated the landslide dams’ failures by upstream flows at Zhouqu and illustrated that both low and high flow discharges of upland flows can induce a cascading failure of landslide dams, after which the flow discharge can be significantly amplified. They also stated that the mechanisms behind the failures for the different flow rates are different. Okeke and Fawu (2016) studied the breach evolution mechanisms of landslide dams, as triggered by seepage and piping, they found that an increase in soil density and homogeneity of the dam materials reduced the potential to form a continuous piping hole through the dams. Furthermore, the potential for piping and progression of the piping hole through the dams increased with an increase in the percentage of fines and a decrease in hydraulic conductivity. The rate of pipe enlargement is related to the erodibility of the soil, which itself is inversely proportional to the soil density. Wang et al (2018) carried out four outdoor tests to investigate the premonitory factors of landslide dam failure, and stated that dam-crest settlement, seepage-water turbidity and self-potential changes can be regarded as premonitory factors of landslide dam failure. Experimental studies have mostly focused on dam failure triggered by overtopping and seepage.
1.2 Seymareh landslide
The prehistoric Seymareh landslide in the foreland margin of the Zagros Mountains, Iran is one of the largest known landslides on the Earth’s continental surface. The landslide occurred along the provincial border between Ilam and Lorestan, 60 km west of the Iraq border (Figure 2). A huge avalanche crossed two valleys and travelled about 19 km far, damming up two major rivers. Two large lakes formed and remained filled for a long period of time until they eventually breached the natural dam and eroded a channel through it
The first studies on the Seymareh landslide were done by DeMorgan (1895) who mistakenly examined the landslide debris as a glacial deposit. Harrison and Falcon (1937) were the first researchers who studied this landslide as a slip and provided a general description of the dimensions and morphology of the slip. In 1938, the same authors studied more in detail the landslide debris, scar area and the movement of the debris and concluded that the Seymareh
19
landslide was a single event. This idea was confirmed by Roberts and Evans (2013) who studied the failure mode and debris morphology and strongly suggested that the Seymareh rock avalanche was an instantaneous single event. Oberlander (1965) included a short appendix on the landslide in his study of the Zagros streams and discussed its origin in relation to the activity of the Seymareh River. Watson & Wright (1969) characterized the geomorphology and stratigraphy of the debris, discussed the origin of the initial rockslide and examined the debris avalanche emplacement mechanisms. They also express that evidence of large blocks on the surface probably reflects that a thick layer of limestone rock was above other rocks when the slide began. This agrees with Roberts and Evans (2013) who based on the distribution of limestone rocks in the distal debris suggested that during initial failure the upper plate overrode the lower plates to travel the farthest. Shoaei and Ghayoumian (2000) estimated that the volume of landslide is 24 to 32 billion cubic meters but according to new calculations performed by Roberts and Evans (2013), the volume of the landslide is estimated to be 44Gm3. Shayan (2006) based on geomorphologic field and documentary surveys and historical details concluded that the age of event was about 1100 years ago which is not in agreement with Roberts and Evans (2013) and Delchiaro et al. (2019a).
Roberts and Evans (2013) based on an accelerator mass spectrometry radiocarbon dates, indicates the rock avalanche occurrence between 8710 and 980014C years BP and Delchiaro et al.
(2019a) using OSL method, dated lacustrine terrace at a site with two different depths and reported that the age of the Seymareh lacustrine terrace is between 7.37 and 10.4 ka. Shayan (2006) also expressed that a thick layer of limestone rock departed from Kabir–Kuh anticline crest and moved by a NW direction toward Seymareh River valley but also this conclusion by Shayan (2006) is not in agreement with NE direction that has been reported by Roberts and Evans (2013) based on field measurements of bedding surface orientations. Yamani et al (2012) due to the thickness and extent of the lacustrine terrace, sedimentology of the lacustrine terrace, morphometric measurements of the lacustrine terrace and especially altitudes of lacustrine terrace argue that Seymareh landslide occurred in three or four stages which agrees with Azimi (2012) who investigated the morphological, geometric, and sedimentological characteristics of the Seymareh landslide, lake and its related terraces and concluded that Seymareh landslide occurred in 3 or 4 stages, too. Shoaei (2014) based on the lacustrine thickness, river discharge and sedimentation rate, calculated the longevity of Seymareh landslide dam equal to 933 years. Beiranvand et al. (2016) calculated the morphometric parameters of landslide and based on these calculation, the width of rupture
20
(Wr), length of rupture (Lr), depth of rupture (Dr), length of displaced mass (Ld), width of displaced
mass (Wd), depth of displaced mass (Dd) and volume of landslide are equal to 15.5 km, 7.81 km,
300 m, 16.06 km, 15.5 km, 300 m and 3.9 km3, respectively. Siamak Sharafi (2016) reconstructed the changes caused by the Seymareh landslide, and the formation of Seymareh and Jaidar lakes on ancient sites in various cultural periods. In ancient times, there might have been permanent living in the Seymareh River terraces where events such as landslides and the subsequent creation of a lake could have had a significant impact on the lives of the inhabitants of the area, because they had to leave or move from the place they were settled (Moghaddam et al. 2007). Delchiaro et al. (2019a) performed detailed geological and geomorphological surveys and mapped the Seymareh valley and dated with optically stimulated luminescence (OSL) two suites of fluvial terraces (one older and one younger than the Seymareh landslide) as well as a lacustrine terrace (formed after the temporary landslide damming), to provide time constraints to the main evolutionary stages of the valley before and after the emplacement of the landslide. Later, Delchiaro et al. (2019b) analyzed the multi-temporal hazard related to the sequence of events and processes linked to the landslide occurrence in terms of potential, effective, residual and inherited hazard.
Although a lot of researches on landslide damming events in various parts of the world have been done, their evolution and behavior are not understood well. These studies didn’t focus on the surface features of the landslide debris to recognize the original and reshaped regions in order to select the landforms more adapt for investigating the emplacement kinematics.
21
Chapter 2- Geological setting
2.1 Stratigraphic and Geo-structural features
The Seymareh landslide (SL) involved the north-eastern flank of the Kabir-Kuh fold, in the distinctive belt of Zagros (or Simply) folded belt (Talbot and Alavi 1996, Stampfli and Borel
2002, Golonka 2004, McQuarrie 2004, Agard et al. 2005, Mouthereau et al. 2012).
Structural setting of the outcropping formations represented an important predisposing factor for the giant landslide (Roberts and Evans 2013, Delchiaro et al. 2019a). In this regard, we referred to the geological map and the stratigraphic column of Figure 2 and Figure 3 and to the stratigraphy proposed by James and Wynd 1965, Alavi 2004 and by the detailed mapping of Kabir-Kuh conducted by Iran Oil Operating Companies (Setudehnia and Perry 1967, Takin et al. 1970, Macleod 1970). At the base of the stratigraphic column there is the Bangestan Group, composed by the Sarvak Formation (Cretaceous, thickness; 750 m) and the Ilam-Surgah Formation (Late Cretaceous, thickness about 250 m). The Sarvak Formation consists of a thick carbonate unit that represents one of the largest reservoirs for hydrocarbons in Iran (Elyasi et al. 2014). At the top of the Sarvak Formation there is the Ilam-Surgah Formation, consisting of limestone of transgressive-regressive foredeep facies deposited in the pro-foreland basin (Elyasi et al. 2014). The Ilam-Surgah Formation is limited at the top by Gurpi Formation (Late Cretaceous, thickness about 400 m) consisting of a marly limestone, marl and hemipelagic shales of deep marine facies associated to the progressive migration towards S of the pro-foreland areas, which are in unconformity with the Sarvak and in onlap with the Ilam-Surgah (Elyasi and Goshtasbi 2015). Within the Gurpi Formation it is possible to recognize a considerably more calcareous horizon called Emam Hassan Member (25 m thick). Above the Gurpi Formation there is the Pabdeh Formation (late Paleocene - early Oligocene, thickness about 350 m) consisting of hemipelagic-pelagic calcareous shales (Elyasi and Goshtasbi 2015). In the Kabir-Kuh anticline area, as described by the detailed mapping of Iran Oil Operating Companies and confirmed by direct field survey (Figure 2 and Figure 3), the Pabdeh Formation is composed of three members: i) the lower Pabdeh member (150 m thick), which is dominated by marls and shales, ii) the Taleh Zang member (50 m thick), consisting of platform limestone, and iii) the upper Pabdeh member (150 m thick), composed mainly of calcareous marl.
22
The succession is completed by the Asmari Formation (Oligocene – Miocene, thickness about 200 m), which creates a carapace originally covering the top of the Kabir-Kuh fold. The Asmari Formation consists of alternating fossiliferous, massive, and thinly stratified gray-brown limestone, microcrystalline limestone, dolomitic limestone, and marly limestone (Khoshboresh
23
2013). In the synclinal valleys between the Kabir-Kuh fold and the adjacent ones, the Asmari Formation is overlapped by a Miocene-Pliocene succession (Homke et al. 2004). Referring to the Changuleh syncline studied by Homke et al. 2004, the latter foreland stratigraphy include: i) the Gachsaran Formation (early Miocene - 12.3 Ma, thickness about 400 m), composed of salt, anhydrite, marl and gypsum; ii) the Agha Jari Formation (12.3 Ma – 3 Ma, thickness about 1400 m); and iii) the Bakhtiari Formation (3 Ma – early Pleistocene, thickness about 900 m). The Agha Jari Formation consists of sandstones and conglomerates, linked to the epicontinental evolution of the environment (Elyasi et al. 2014), while the Bakhtiari Formation consists of conglomerates characterized by coarse and mud-supported grains, sandstones, shales and silts (Shafiei and Dusseault 2008).
24
The Zagros mountain belt extends over 1800 km from Kurdistan in N Iraq to the Strait of Hormuz in Iran and results from the long-standing and ongoing convergence between the Eurasian and Arabian plates, during which time the Neo-Tethys oceanic basin was closed (Lacombe et al. 2011). The overall convergence of the two Eurasian and Arabian plates is estimated to be about 30 mm/year at 50°E and 40 mm/year at 60°E (De Mets et al. 1994, Jackson
1992). The Zagros is famous for its seismic activity and active deformation. The map in Figure 4 shows the earthquake epicenters and major faults of Lorestan and Ilam between 1900-2015. Based on the Iranian code of practice for seismic resistant design of buildings, named “Standard No. 2800”1, Pol-e-Dokhtar is rated as region with average seismic risk.
1 Buildings, Standard No. 2800” was published by the Building and Housing Research Centre (BHRC) in early 1988
and since then has contained the official requirements for seismic design in Iran. The second edition was published in 1999 while the third edition is currently published in 2007.
25
Figure 4 Earthquake Epicenter & Major Faults Map of Lorestan & Ilam, map n.12-B (collected by Dezvare, M., Naserieh, S., Rouhi, A & Boromand, B. 2015) Institute of Geophysics, Iranian Seismological Center (IRSC)
26
2.2 Geomorphological features
Ilam and Lorestan provinces are full of spectacular landforms shaped in response to active tectonics, therefore recognizing their characteristics in the study area is of great importance. The Lorestan province is part of the most external Zagros (western sector) characterized by "harmonic" fold systems passing eastward (i.e. in the internal zone of the Chain) to thrust-folds and imbricate systems. The study area consists of relatively high mountains with the general trend of northwest - southeast (Zagros process) (Figure 5).
27
The Kabir-Kuh and the Maleh-Kuh anticlines represent two main mountain range in the south and north of the study area, respectively (Figure 5). Maximum altitudes in the study area are in the Kabir-Kuh fold-ridge which reaches an altitude of about 2700 meters and minimum altitudes are in enclosed plains between the anticlines (the floor of the synclines) and in accordance with the Seymareh River with a height of less than 500 meters. The general trend of the Seymareh River is parallel to the general trend of the main structures of the region (northwest - south east) but in some parts due to the tectonic and geological reasons, its path is perpendicular to the structures of the region.
Meteorological information are important because firstly they specify the weather condition and the climate of each region and secondly, they play a decisive role in hydrologic (surface water) and hydrogeology studies. The use of meteorological stations data and statistics are essential to know the temporal and spatial variations of meteorological factors. Therefore, for understanding the climatic conditions of the study area, the average precipitation and temperature in the synoptic station of Pol-e-Dokhtar belongs to 16 years (from 2003 to 2018) were collected from the Ministry of Energy and Meteorology Organization of Iran and are reported in Table 1 and Table 2.
Table 1 Total Monthly Average Precipitation of Pol-e-Dokhtar
Table 2 Total Monthly Average Temperature of Pol-e-Dokhtar
The climate element of precipitation in the Pol-e-Dokhtar station shows that the average precipitation in the 16 years (from 2003 to 2018) was 32.80 mm. The study area in November with 63.5 mm had the highest precipitation and in July with 0.01 mm had the lowest precipitation.
Temperature is one of the most important parameters that, in addition to affecting other climatic elements, plays a significant role in shaping different landforms. As it is reported in Table 2, warm temperatures have coincided with the trend in the summer season and vice versa. The average temperature varies from about 9 degrees in the winter to 37 degrees in the summer. Due
Total Monthly Average Precipitation of Pol-e-Dokhtar (mm)
Month Jan Feb Mar Apr May Jun Jul Aug Sep Oct Nov Dec
Average Precipitation 56.55 45.9 50.1 62.98 22.96 0.36 0.01 0.85 1.3 26.03 63.50 63.10
Total Monthly Average Temperature of Pol-e-Dokhtar (ºC)
Month Jan Feb Mar Apr May Jun Jul Aug Sep Oct Nov Dec
28
to the influence of local factors and the regions low altitudes from the sea level, the temperature fluctuations in the hot seasons is lower. However, the effect of refrigeration systems in the cold season has led to a further decrease in the minimum temperature and the intensification of temperature fluctuations in the region. In the studied period, the lowest temperature was in the winter and the highest temperature was in the summer.
The Ombro-thermic curve (Figure 6) compares monthly changes in temperature relative to monthly rainfall changes throughout the 16 years period (2003-2018). The Ombro-thermic curve (Figure 6) demonstrate that from mid-April to mid-October, drought conditions dominate the area, and in other months the humidity conditions are above the drought. The simultaneous decrease of precipitation with increasing temperature in these months is a major cause of drought. Also, this curve represents two different seasons throughout the year. In spring and summer, with increasing the temperature and decreasing the precipitation, the region has warm and dry climate, in autumn and winter, with increasing rainfall and decreasing temperature, it has wet climate. Since the data of this curve has been extracted from 16 years period, the terms provided for each year can vary. In general, this diagram is suitable for understanding the general weather conditions of the area and do not have the details of other elements.
29
The Pol-e-Dokhtar and Darreh-Shahr watersheds terminate to the Seymareh landslide debris (Figure 7). Based on the report of Iranian Ministry of Energy, the total area of the Pol-e-Dokhtar and Darreh-Shahr watersheds are 2073.4 and 974.9km2, respectively. The Kashkan and Seymareh Rivers are the main rivers inside the Pol-e-Dokhtar and Darreh-Shahr watersheds with 1.1 and 0.12% slopes.
The outlet discharge of the Seymareh and Kashkan Rivers according to the Seymareh-Nazarabad and Pol-e-Dokhtar hydrometric station are 97.5 m3/s and 42.07 m3/s. By the reports of Iranian Ministry of Energy, the average discharge measured in the Seymareh-Nazarabad hydrometric station in the last 10 years leading up to 2012 has decreased by about 33% compared
30
to the long-term average of 45 years. The average discharge measured in the Pol-e-Dokhtar hydrometric station in the last 10 years leading up to 2012, also has decreased by about 28% compared to the average long-term average of 45 years. The statistics related to the discharge of the Seymareh and Kashkan Rivers shows that the joining of the Kashkan and Seymareh Rivers as the Karkheh River results in an unusual condition of high discharge and strong eroding force in the area.
The morpho evolutionary processes involving the study area are a function of mechanical and physical erosion of soil deposits and bedrock units outcropping in the mountain areas, erosion and degradation due to the simultaneous and combined operation of the dissolution and penetration of current water into the joints and fractures systems and rupture in the underlying layers. The study area has been affected by weathering, especially in past due to its high altitude, frosts and relatively high rainfall. Here the processes that are affected by the climatic factors are described below.
1. Mechanical weathering: in this type of weathering, the rocks are fragmented in pieces of different sizes without any significant changes in their nature. This type of weathering occurs by climatic elements such as temperature, freeze-thaw, wet-dry cycles. Frosts cause the rocks to change into the smaller particles due to the cracks and fissures in the rocks and faster soil formation occurs. At lower elevations, the effect of freezing on the destruction of rocks is less than the effect of temperature variations. The heat of the summer and the cold of the winter, but
mostly the temperature fluctuations of the daytime, since the dilatation coefficient of the minerals forming the rocks are not equal, has caused the formation of fine particles in the mountains. These particles fall into the slopes of the mountains due to gravity. Temperature changes affect the shale surface. The effects of temperature from the surface to the depth of the stone decreases. As a result, between the surface and the depth, there is a tensile that creates cracks and fissures parallel to the surface
31
in the rocks and rocks shatters in laminate form. This type of erosion that separates rocks to different sheets, is called laminar erosion (Baharvand, 2008) (Figure 8).
2. Chemical weathering: In this type of weathering, the nature of the rock changes and new materials forms. This type of weathering occurs in the presence of water and moisture and is usually by dissolution on carbonatic rocks. In the mountains of the region, due to cold and humidity in winter, this phenomenon prevails. The water mixes with carbon dioxide and solves the limestones which are made by calcium carbonate and changes them to the calcium bicarbonates which is soluble. This solution dissolves the rocks and creates holes and gaps when moving on the rock surface or inside it. All the karst forms are created by this phenomenon. The carbonate dissolved deposit in appropriate places and creates the cement (Figure 9).
32
3. Biologic weathering: This weathering is caused by the activity of plants, animals and humans. Ants and worms increase the penetration of water and weathering of the soil. Animals by digging the soil and destroying the vegetation cause soil washing and accelerate the erosion process. Root of plants and trees degrade the rocks, but in most cases, they stick soil particles together and prevent flooding and soil degradation. Humans are the most destructive factor among living creatures that by destroying the vegetation causes soil degradation. In the marneous hills where the soil can be used for construction purposes, humans, by digging the hills, accelerate soil erosion by flooding and eliminate plant growth potential in soil (Figure 10).
33
Due to the presence of erodible formations, conditions for the occurrence of various types of erosional processes are provided.
1. Water erosion: this type of erosion is most commonly found in the Agha Jari marly formation. In Jaydar plain, hills of marly formation can be seen. These striped hills are completely cut and destroyed in some areas by erosion caused by water erosion during heavy rainfall events. On the side of these hills, outcrops of Agha Jari Formation appear due to the destruction of vegetation and the resistant superficial layer which are ancient alluvial deposits. In all marly hills, this type of erosion is clearly visible (Figure 11).
Figure 10 Biologic Weathering
34
2. Badland erosion: in areas where the upstream erosion by drainage network removed the bottom of Tale Zang Formation characterized by a resistant lithology, the red or gray color of marls outcrop appears. Because of their high erodible nature, many parallel gullies are created which indicate severe erosion. This type of landscapes is called badlands. This type of erosion is most commonly seen in Pabdeh Formation (Figure 12).
3. Gully erosion: is the removal of soil along drainage lines by surface water runoff. Once started, gullies will continue to move by headward erosion or by slumping of the side walls. Gully erosion occurs when water is channeled across unprotected land and washes away the soil along the drainage lines. Under natural conditions, run-off is moderated by vegetation which generally holds the soil together, protecting it from excessive run-off and direct rainfall. This type of erosion is abundant in the marly hills and on the landslide debris surface (Figure 13).
35
4. Floods: flood events dominate more than other processes related to surface running water. Autumn and winter rainstorms cause the soil to be washed at the surface of the mountains and plains. Agricultural lands and areas that lie on the slope water and river's path are under flood erosion. In the event of severe rainfall, flood erosion washes hundreds of hectares of land (Figure 14).
36
5. River incision and lateral erosion: this type of erosion takes place further along the margin of the rivers of the region, specially the Seymareh and Kashkan Rivers, the rivers that originate from the mountain range and seasonal rivers. Since the paths of these rivers flow on loose sediments, these rivers have eroded these margins in their paths and made several meanders. The Kashkan and Seymareh Rivers with their sinuous path have cut and destroyed many of fertile agricultural lands, especially in the downstream. These two rivers also have created many of fertile agricultural lands. Seasonal rivers cut and destroy lands due to winter flood.
37
One of the most important and spectacular geomorphological landforms in the Zagros mountains are gorges. These valleys, which appear on the sides and slopes of anticlines, gradually cut both sides of the anticlines until reaching to the basement. These valleys are influenced by various factors such as rocks type, cracks and fissures, folding shape and tectonics, slope gradient, layering and amount of water. These valleys in the karstic areas have a greater depth and width due to its pure carbonatic content and its dissolution. In the past, these valleys have played a significant strategic role due to the proper security conditions that they have created naturally and have played an important role in the formation of civilization in the region. An example of these gorges is the case of Bahram Chubin gorge, which was used during the Sassanid dynasty (Figure 15).
Gorges are abundant on the anticlines (Figure 16).
Figure 15 Bahram Chubin gorge
38
V shape valleys are prospecting forms that are directly shaped by river erosion and slope processes. These valleys often formed along faults and have created various and spectacular landforms due to the resistance of rocks in the Seymareh landslide. The V shape erosion process affects pre-existing crack and fissures of rocks and it is strictly connected to the water discharge and slope gradient. If the rocks are hard, valley walls are vertical and dominant to the waterway and due to the hardness of the walls, water cannot erode the sides and erosion is vertical that creates V-shape valley. There are a lot of V-shaped valleys in the study area. Asmari limestone by the thin layer at the top and thick layer at the bottom causes more V-shape valleys form.
In loose and soluble areas, U-shaped valleys form more typically. These valleys are found in calcareous and karstic areas in the study area. Usually, both sides of the valley are in the shape of cliff which sometimes their heights are higher than 100 meters.
In the study area, cliffs due to landslide detachment are abundant. Some of these cliffs have been created due to the presence of transverse faults in the Maleh-Kuh on the north of Pol-e-Dokhtar. The walls of these cliffs have been stabilized due to the erosion of the valleys by the rivers and streams. In the Seymareh landslide (southwest Pol-e-Dokhtar), due to the detachment of a part of the Asmari Formation in the direction of the slope, there are lateral scarps on both sides of the Seymareh landslide scar area (Figure 17).
39
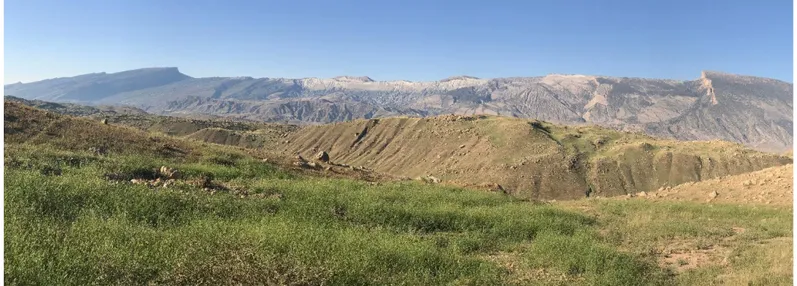
In the present climate conditions during the wet periods, precipitation is increased and as a result, the net power of the river is increased. Increasing the net power of the river, which is associated with increasing river discharge, causes the river bed to enlarge. Due to the high discharge volume and strong river floods in the Seymareh River, these flood plains are remarkably wide. According to the meandering pattern of the Seymareh River and its lateral erosion, these flood plains are formed on both sides of the rivers (Figure 18). These flood plains are composed of heterogeneous clay and gravel deposits which indicates the relevant transport power of the Seymareh River.
40
The study area is characterized by a high frequency of landslides. The occurrence of these landslides upstream of the Seymareh landslide dam in some places has led to a redirection of Seymareh River.
The landslide dam was stable for a long period of time then it was cut (Delchiaro et al.
2019a). At present there is no lake at the back of the Seymareh landslide dam. Different geomorphological features are formed in the study area because of the formation and failure of the Seymareh landslide dam.
Alluvial deposits on the left and right bank of Kashkan, Seymareh and Karkhe River, as well as on the surface of Seymareh landslide debris with variable thicknesses can be observed (Figure 19). The old river terraces in the upstream of Seymareh landslide debris are buried under the lacustrine deposits and are visible, only in some places where the lacustrine deposits are eroded. Among the old and new lacustrine deposits, river terraces due to the sovereignty of the river environment during the formation of the lakes can be seen (Delchiaro et al. 2019a). There is a visible layering in the grain size of river terraces. In the periods when the net power of the Seymareh and Kashkan rivers increased, the sediments are thickened and less rounded. Conversely, in periods where the net power of the river has decreased, sediments tend to be smaller and more rounded. In the Jaydar lake, the remnants of river terraces in places where the valley has larger width can be observed (Figure 19).
41
The lacustrine deposits represent the lakes fine-grained deposits formed after the formation of the Seymareh landslide dam. The vast range of these sediments are up to the downstream of Cham Borzu gorge and Maleh-Kuh Mountain range (up to 650 and 700 meters above sea level for Seymareh and Jaydar lakes) (Delchiaro et al. 2019a) (Figure 20).
Alluvial fans are mainly formed in the upstream of Seymareh landslide dam and in the Kabir-Kuh mountain range but there are some alluvial fans on the landslide debris surface (Figure 21). These alluvial fans originated from the drainage network of the basin, which, after reaching a low slope, or, in other words, exiting the valley and reaching the plain, formed the alluvial fans. The presence of alluvial fans in lacustrine sediments indicates the formation of some of these alluvial fans during the formation of Seymareh lake, while somewhere they formed also on the landslide debris.
42
There are several denudation scarps on the Seymareh landslide debris which could be due to the combined effect of mechanical and chemical weathering and erosion by running water or wind (Figure 22).
Figure 21 Alluvial fans on the Seymareh landslide debris
43
A ridge is a geomorphological feature consisting of elongated relief that form a continuous elevated crest for some distance. Ridges are usually termed hills or mountains as well, depending on size there are several main types of ridges (Karwariya 2013). On the Seymareh landslide debris there are many ridges which are formed due to the landslide debris emplacement or because of erosion processes (Figure 23). In the next chapter the ridges formation on the landslide debris will be discussed more in details.
There are six lakes in the southeast region of the landslide debris in the downstream (Figure 24) known as Tang-e-Fanni lakes. The lakes are fed by springs (Watson and Wright 1969) (Figure 24) close to them in the downstream as well as a series of spring along the gorge in Zaferan area. There are also a set of three lakes in the northeastern lobe of the debris west of the Valiasr village and are known as Valiasr lakes. These lakes are also fed by springs (Watson and Wright 1969). The detail of all lakes and springs in the study area are presented in Table 3 and Table 4.
44
45
Table 3 Details of the lakes on the the Seymareh landslide debris
Table 4 Details of the Springs around the Seymareh landslide debris Springs Name H Q_2000 (m3/s) Q_2018 (m3/s) Baba_Kharazm 578.99 15 5 Bagh-e-Jaydar1 715.18 5 1.2 Bagh-e-Jaydar2 727.94 2 2.9 Bagh-e-Jaydar3 873.04 No Data 0.8 Bagh-e-Jaydar4 739.22 No Data 1.6 Darreh Naghi 437.01 5 0.5 Gury Babakhan 560.057 10 4 Konar Balut 497.73 20 1 Sar Asiab 1 578.36 25 5 Sar Asiab 2 529.99 No Data 1 Sar Asiab 3 507.21 No Data 0.5 Sar Asiab 4 502.959 No Data 1.5
Sarab_Rajab 500 15 1.5 Valiasr 718.84 No Data 1 Zaferan1 494.34 25 6 Zaferan2 497.55 20 9 Zaferan3 471.76 No Data 5 Zaferan4 443.15 No Data 7 Lakes Name H (Above sea level) Type of the lakes Situation Max depth (m) Perimeter (m) Volume (m3) Discharge Regime Water quality Max Dimension (km) Min Dimension (km) Area (hectare)
Gury Pike 688 Natural Dry 0 350 0 Seasonal Salty 0.14 0.6 1 Gury Lafune 1 710 Natural Wet 6 900 360000 Permanent Fresh Water 0.26 0.24 6 Gury Lafune 2 710 Natural Wet 2 400 20000 Permanent Fresh Water 0.09 0.07 1 Gury Takane 705 Natural Wet 10 1200 1000000 Permanent Fresh Water 0.4 0.22 10 Gury Siah 761 Natural Dry 0 380 0 Seasonal Fresh Water 0.11 0.09 1 Gury Zard Ab 693 Natural Dry 0 650 0 Seasonal Fresh Water 0.3 0.1 3 Gury Otaf 2 501 Natural Wet 7 700 420000 Permanent Fresh Water 0.3 0.18 6 Gury Otaf 1 501 Natural Wet 4 600 120000 Permanent Fresh Water 0.2 0.08 3 Gury Balmak 750 Natural Wet 1 8000 20000 Seasonal Salty 3 2 20 Gury Kabud 3 500 Natural Wet 10 750 70000 Permanent Fresh Water 0.28 0.25 7 Gury Kabud 2 508 Natural Wet 8 800 40000 Permanent Fresh Water 0.3 0.2 0.5 Gury Kabud 1 508 Natural Wet 8 900 40000 Permanent Fresh Water 0.3 0.2 0.5 Gury Jomjme 484 Natural Wet 8 1100 720000 Permanent Fresh Water 0.3 0.25 9 Gury Golam Suze 720 Natural Dry 0 500 0 Seasonal Salty 0.1 0.02 0.2 Sabz 650 Natural Dry No data No data No data No data No data No data No data No data
46
In the southeast part of landslide debris, where Tang-e-Fanni lakes are spaced apart, there are extensional features in both sides of the lakes. These extensional features start with a short distance from both sides of the lake and ends toward the center of the lakes. The scarp of these extensional features has 1 to 5 m height, 5 to 10 m width and 1 to 3 m depth. The reason that these extensional trenches are formed could be because of solution of the formation at the base of the landslide debris or the settlement of landslide debris at that region. These extensional trenches are shown in Figure 25, Figure 26 and Figure 27.
Figure 25 Extensional trenches on the landslide debris
47
48
Chapter 3- Morphometric analysis
3.1 Material and methods
In the last decades, Geographic Information Systems (GIS) and DEMs allowed the detailed analysis of land surface by remote surveying. Before the introduction of Digital Elevation Models (DEMs), landforms were only manually identified by means of surveys when available through interpretation of aerial photographs (Schillaci et al. 2015) but over the years, scientists have conducted research and shown the usefulness of spatial technologies, remote sensing and field studies in landform mapping and understanding of geomorphic processes (Karwariya et al. 2013). Landforms are both the result of past geomorphic processes and the stage for present geomorphic processes which reshape it again for future geomorphic processes (Swanson et al.
1988; Dehn et al. 2001). Sparks (1986), Etzelmüller and Sulebak (2000) propose a switch from process study as the key for understanding landforms to morphologic description as key for assessment of process. Summerfield (1991) emphasizes both the form and the processes which create the form as equally important subjects for geomorphology and argued the need to think about physical processes and explain how forms are related to them.
Within geomorphology itself a distinction can be drawn between a qualitative and a quantitative branch (Straumann et al. 2009). The latter refers to a specific way of exploring geomorphological questions and takes its roots in the early debates between qualitative and quantitative approaches. Geomorphology now fundamentally relies on quantification to answer different questions, to characterize the magnitude and frequency of events and critical geomorphic phenomena, and to assess the evolution and organization of forms and their connections (Piégay
2017). Therefore, quantification is helpful for understanding land surface complexity as it can provide a wider set of solutions and make interpretations more robust.
In the present thesis, Aerial Photos of Geographical Mapping Organization of Iran related to the Seymareh landslide debris taken in 1955 and 2002 with the scale of 1:55000 and 1:40000, have been interpreted respectively in a preliminary step using stereoscope by separating the area of the debris in terms of tone, texture and structure characteristics.
Geological maps with the scale of 1: 100000 and 1: 250000 of Geological Survey of Iran, the digital elevation models of the area with a resolution of 10 and 30 meters2 and Google Earth
2 The digital elevation models of the area with a resolution of 10 meters was interpolated from vector topographic
49
images (CNES/Airbus from 2011 to 20017) for identification of different geomorphological features and measuring the blocks size were observed and interpreted.
This research required extensive field surveys, which were carried out in two 3-month periods, June to September 2017 and May to August 2018. To carry out the surveying activity, topographic map 1: 25000 of Geographical Mapping Organization of Iran and Google Earth image (CNES/Airbus 2017) for planning the routes been used. Field surveys have been performed for detection of the boundary surface between the landslide debris and the bedrock and of different outcrop location inside landslide debris, ground truthing of interpretations made from remotely sensed datasets, identifying the location of springs and measuring their discharge, sampling for laboratory tests, measuring the density of the debris at the surface in different part of the landslide debris for permeability tests. During the field surveying some more geomorphological features have been recognized and a part of blocks identified by remote surveying, some more blocks were measured by tape.
The ArcGIS 10 software package was used to manage and analyze the data acquired through remote surveying and field survey. A specifically designed geodatabase was populated with surface features on the landslide debris, firstly surveyed by remote sensing analysis and successively verified in the field. As the flowchart reported in Figure 28 shows, the structure of this geodatabase has been created in the Arc Map environment with line, point and polygon feature classes. Point features have been used to represent the location and specific details of the features that were too small to be represented as lines or polygons as well as point locations (such as GPS observations). Linear elements have been used in this research to represent the shape and location of the geographic objects and Polygon features represents the shape and location of homogeneous features. The reference system considered in this research is UTM projection system, with datum WGS84 (World Geodetic System of 1984) and zone 38North.