The Rockefeller University Press $30.00 J. Cell Biol. Vol. 203 No. 6 985–1001
A. Kassan, A. Herms, and A. Fernández-Vidal contributed equally to this paper. Correspondence to Robert G. Parton: [email protected]; or Albert Pol: [email protected]
Abbreviations used in this paper: ACSL, acyl-CoA synthetase long-chain family; LD, lipid droplet; OA, oleic acid; OFP, orange fluorescent protein; LD, pre-existing LD; qRT-PCR, quantitative RT-PCR.
Introduction
Lipid droplets (LDs) are ubiquitous organelles that collect,
store, and supply lipids (Walther and Farese, 2012).
Nonethe-less, excessive or reduced accumulations of LDs are hallmarks
of prevalent human diseases including steatohepatitis, obesity,
diabetes, myopathies, arteriosclerosis, or lipodystrophies.
How-ever, relatively little is known about the molecular processes
and sites that control LD formation. In eukaryotes, LDs likely
form de novo by accumulation of neutral lipids in the ER.
Con-sistent with this, the ER harbors enzymes required for neutral
lipid synthesis (Buhman et al., 2001), many ER proteins are
re-quired for LD formation and expansion (Brasaemle and Wolins,
2012), LDs can be generated in vitro with ER microsomes
(Lacey et al., 1999; Marchesan et al., 2003), and there exists
an active partitioning of proteins between the ER and LDs
(Jacquier et al., 2011). However, although it has been possible
to detect early LDs in the proximity of the ER (Pol et al., 2004;
Wolins et al., 2005; Turró et al., 2006; Kuerschner et al., 2008;
Skinner et al., 2009; Poppelreuther et al., 2012), whether these
are indeed nascent LDs, and whether specialized microdomains
existed before the recruitment of these proteins was unknown.
Indeed, it was commonly assumed that direct imaging of newly
forming LDs was impossible with the current methodology
(Salo et al., 2011; Suzuki et al., 2011).
The generally accepted model is that triglycerides are
deposited as a lens within the ER bilayer. This process is
presumably regulated by proteins, as LD formation is not
spontaneously triggered by accumulation of neutral lipids in
the ER (Gubern et al., 2008; Adeyo et al., 2011). Thus, ER
proteins that can extend hydrophobic domains into the
bi-layer are attractive candidates to recognize and organize the
sites of nucleation. We previously identified a localization
signal for sorting proteins with a hydrophobic domain within
C
ontrol of lipid droplet (LD) nucleation and copy
number are critical, yet poorly understood,
pro-cesses. We use model peptides that shift from the
endoplasmic reticulum (ER) to LDs in response to fatty
acids to characterize the initial steps of LD formation
occurring in lipid-starved cells. Initially, arriving lipids
are rapidly packed in LDs that are resistant to starvation
(pre-LDs). Pre-LDs are restricted ER microdomains with
a stable core of neutral lipids. Subsequently, a first round
of “emerging” LDs is nucleated, providing additional
lipid storage capacity. Finally, in proportion to lipid
concentration, new rounds of LDs progressively assemble.
Confocal microscopy and electron tomography suggest
that emerging LDs are nucleated in a limited number of
ER microdomains after a synchronized stepwise process
of protein gathering, lipid packaging, and recognition
by Plin3 and Plin2. A comparative analysis
demon-strates that the acyl-CoA synthetase 3 is recruited early
to the assembly sites, where it is required for efficient LD
nucleation and lipid storage.
Acyl-CoA synthetase 3 promotes lipid droplet
biogenesis in ER microdomains
Adam Kassan,
1Albert Herms,
1Andrea Fernández-Vidal,
1Marta Bosch,
1Nicole L. Schieber,
2,3Babu J.N. Reddy,
4Alba Fajardo,
1Mariona Gelabert-Baldrich,
1Francesc Tebar,
1,5Carlos Enrich,
1,5Steven P. Gross,
4Robert G. Parton,
2,3and Albert Pol
1,5,61Equip de Senyalització i Proliferació Cellular, Institut d’Investigacions Biomèdiques August Pi i Sunyer (IDIBAPS), 08036 Barcelona, Spain
2The Institute for Molecular Bioscience and 3Centre for Microscopy and Microanalysis, The University of Queensland, Brisbane, Queensland 4072, Australia 4Department of Developmental and Cell Biology, University of California, Irvine, Irvine, CA 92697
5Departament de Biologia Cellular, Immunologia i Neurociències, Facultat de Medicina, Universitat de Barcelona, 08036 Barcelona, Spain 6Institució Catalana de Recerca i Estudis Avançats (ICREA), 08010 Barcelona, Spain
© 2013 Kassan et al. This article is distributed under the terms of an Attribution– Noncommercial–Share Alike–No Mirror Sites license for the first six months after the pub-lication date (see http://www.rupress.org/terms). After six months it is available under a Creative Commons License (Attribution–Noncommercial–Share Alike 3.0 Unported license, as described at http://creativecommons.org/licenses/by-nc-sa/3.0/).
THE
JOURNAL
OF
CELL
BIOLOGY
on December 30, 2013
jcb.rupress.org
Downloaded from
http://jcb.rupress.org/content/suppl/2013/12/20/jcb.201305142.DC1.html Supplemental Material can be found at:on December 30, 2013
jcb.rupress.org
Downloaded from
on December 30, 2013
jcb.rupress.org
Downloaded from
on December 30, 2013
jcb.rupress.org
Downloaded from
on December 30, 2013
jcb.rupress.org
Downloaded from
on December 30, 2013
jcb.rupress.org
Downloaded from
on December 30, 2013
jcb.rupress.org
Downloaded from
on December 30, 2013
jcb.rupress.org
Downloaded from
Results
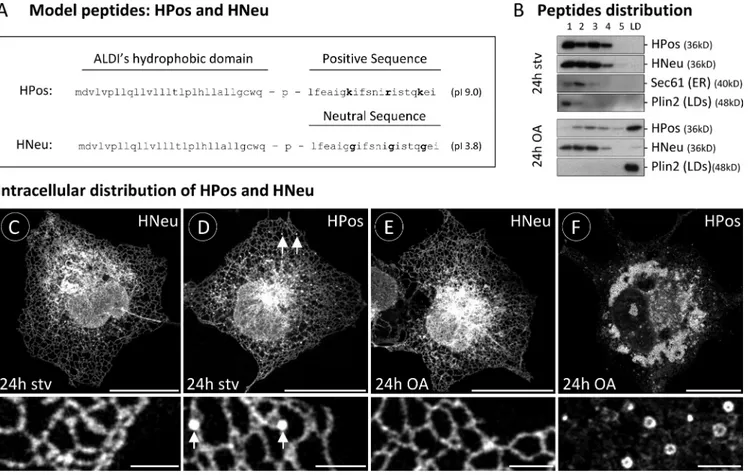
HPos but not HNeu is transported from the ER into LDs after lipid loading
A model peptide (HPos) was generated by fusion of the
hydro-phobic domain of ALDI with the last 20 residues of caveolin-1
(Fig. 1 A). This caveolin-1 sequence has an isoelectric point of
9.0 and targets caveolin-1 to LDs (Ingelmo-Torres et al., 2009).
As a negative control, we mutated to glycines the three positive
residues in the positive sequence (Fig. 1 A, bold letters). The
re-sulting peptide (HNeu) accumulates on the ER but is excluded
from LDs (Fig. 1). The peptides were N-terminally tagged with
fluorescent molecules (GFP or orange fluorescent protein [OFP]).
For these microscopy-based studies, we selected COS-1 cells,
commonly used to study trafficking of proteins within the ER
(Lippincott-Schwartz et al., 2001).
Initially, cells were transfected with HPos or
GFP-HNeu for 24 h in the absence of serum to reduce extracellular
lipids and LDs (referred to as starvation). After starvation, cells
were fractionated in sucrose density gradients, and there was no
visible LD fraction (Fig. 1 B and Nile red in Fig. 8 G). HPos
and HNeu were present in the same fraction as the endogenous
ER marker Sec61. Endogenous Plin2 was in the bottom of the
the ER into LDs (Ingelmo-Torres et al., 2009). The signal
includes the hydrophobic residues for initial association with
the ER, and a sequence enriched in positive amino acids for
subsequent targeting into LDs. One class of proteins with
endogenous sorting signals of this type are caveolins (Pol
et al., 2004), scaffolding molecules that organize specific
lipids in different membranes (Bosch et al., 2011) and are
re-quired for efficient LD formation (Fernández-Rojo et al.,
2012). However, caveolins dynamically associate with LDs
and traffic between the ER, LDs, the Golgi complex,
endo-somes, and the plasma membrane (Pol et al., 2005; Le Lay
et al., 2006). A second group of proteins interacting with
LDs by hydrophobic domains includes the methyl
transfer-ases ALDI, AAM-B, and Erg6. In contrast to caveolins, these
proteins shift exclusively between the ER and LDs (Turró
et al., 2006; Zehmer et al., 2008; Jacquier et al., 2011).
Be-cause such endogenous proteins potentially have additional
interactions and functions, we have generated here a minimal
model peptide by fusion of the hydrophobic domain of ALDI
in order to anchor the peptide to the ER, and the LD targeting
signal of caveolin-1, for sorting the peptide within the ER
into LDs. This model peptide has a high affinity for LDs and
has been used as a marker for LDs and related domains.
Figure 1. ER into LD segregation of HPos. (A) Model peptides used in this work. Bold letters indicate the three positive residues that were mutated to glycines. (B) Starved GFP-HPos– or GFP-HNeu–transfected cells (24 h stv) and cells additionally incubated 24 h with OA (24 h OA) were fractionated in sucrose density gradients. The distribution of the peptides in the gradients was analyzed by Western blotting with anti-GFP antibodies. Each panel shown represents a separate gradient. The figure also includes representative fractionations in separate gradients of an ER resident protein (Sec61) and a LD pro-tein (Plin2) detected with specific antibodies. (C–F) Distribution of GFP-HNeu and GFP-HPos in starved cells (C and D) or OA-loaded cells (E and F). Bottom panels show high-magnification areas selected from the corresponding panels on top. Arrows in D indicate pre-LDs. Bars: (top) 20 µm; (bottom) 2 µm.
on December 30, 2013
jcb.rupress.org
Downloaded from
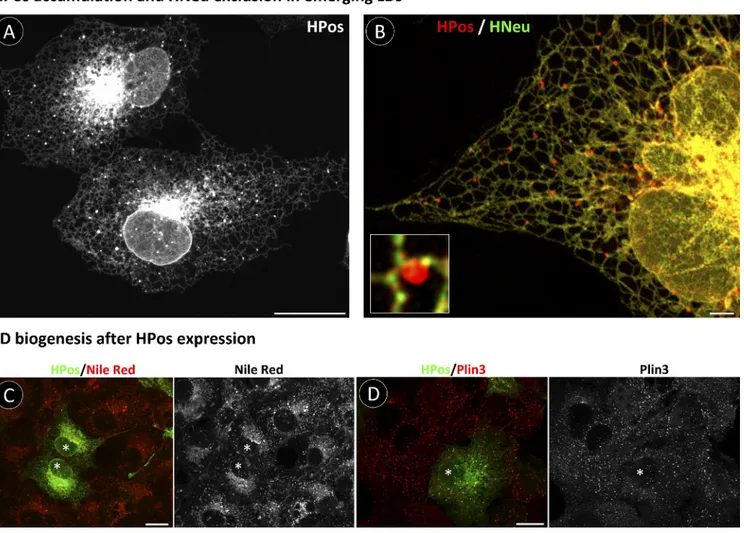
Lipid arrival promotes rapid segregation of HPos within the ER into LDs
To investigate the LD nucleation sites, we incubated starved
HPos-transfected cells with OA for short times. After 7.5 min,
HPos had already accumulated in rounded structures
consis-tently connected to the ER (Fig. 2 A). In cotransfected cells,
OFP-HPos and GFP-HNeu did not colocalize in these structures
(Fig. 2 B), which suggests that they are early LDs. Critically,
HPos did not modify the initial stages of LD formation. When
starved cells were loaded with OA for 30 min, formation of
Nile red–positive LDs was indistinguishable between
non-transfected and non-transfected cells (Fig. 2 C). Further, HPos did
not modify the recruitment of endogenous proteins, such as
Plin3, in the newly-formed LDs (Fig. 2 D).
We next examined the process with higher temporal
reso-lution using time-lapse confocal microscopy. In these
experi-ments, starved HPos-transfected cells were additionally treated
with cycloheximide to reduce the pool of newly synthesized
protein, and cells were selected for the labeling of well-defined
ER elements. As described above, several HPos-positive
struc-tures were present before OA addition (Fig. 3 A, white circles
gradient, which is consistent with a cytosolic distribution in
the absence of LDs. Confocal microscopy confirmed that the
peptides accumulated in the nuclear envelope, in central ER
sheet-like structures, and in tubules arranged in triple junction
polygons forming the branching ER network (Fig. 1, C and D).
Electron microscopy analysis confirmed that both markers were
completely restricted to the ER (unpublished data). Identical
results were obtained when transfected cells were incubated
for 24 h in a medium containing 5% of a delipidated FCS
(un-published data).
Next, starved HPos- and HNeu-transfected cells were
treated for 24 h with 175 µg/ml of oleic acid (OA) to induce LD
formation. The fractionation demonstrated the existence of a
LD fraction, enriched for Plin2 and HPos but not for HNeu
(Fig. 1 B). Confocal microscopy confirmed that HPos was on
LDs (Fig. 1 F) and that HNeu remained in the ER (Fig. 1 E). Thus,
HPos follows an OA-promoted transport pathway between the
ER and LDs. In addition to being found in the ER tubules of the
starved cells, HPos, but not HNeu, was found in small punctate
structures apparently connected to the ER (Fig. 1 D, arrows)
even though mature LDs were not visible in that cell.
Figure 2. Segregation of HPos into LD after lipid arrival. (A) Starved GFP-HPos–transfected cells were treated with OA for 7.5 min and analyzed by microscopy. (B) Starved OFP-HPos– and GFP-HNeu–cotransfected cells were loaded with OA for 7.5 min and analyzed by microscopy. The inset shows a high-magnification detail of an emerging LD. (C and D) Starved GFP-HPos–transfected cells were loaded with OA for 30 min. The distribution of neutral lipids was detected with Nile red (red in C), and the distribution of endogenous Plin3 was detected with antibodies (red in D). Asterisks indicate transfected cells. Bars: (A, C, and D) 20 µm; (B, main panel) 2 µm; (B, inset) 0.5 µm.
on December 30, 2013
jcb.rupress.org
black circles), and for emerging LDs there was a roughly 5-min
delay between OA addition and visible HPos accumulation
(Fig. 3 B, red circles). At the end of the video, 15 min after OA
addition, Nile red labeled the emerging LDs (Fig. 3 D, bottom),
which indicates that these sites are bona fide LDs. Similar to
caveolins recruited to LDs from the ER (Pol et al., 2004), but in
contrast to Plin2 (Soni et al., 2009), preincubation with brefeldin
A for 15 min before the addition of OA did not modify the
accumulation of HPos in emerging LDs (unpublished data),
which suggests that this peptide is not transported via vesicular
in -5 panel; and
Video 1
). These structures were apparently
stable in the ER. Because these structures exclude HNeu (see
Fig. 8), contain a core of neutral lipids (Fig. 3 D), and were
observed before the OA addition, we denote these as
“pre-existing LDs” (pre-LDs).
Once OA was added (+OA in Fig. 3 A and Video 1),
addi-tional HPos-positive structures appeared in 5–7 min (Fig. 3 A,
red circles), and we denote these as “emerging LDs.” The
treat-ment with OA caused accumulation of HPos into the puncta.
For pre-LDs, HPos was incorporated within 30–60 s (Fig. 3 B,
Figure 3. Dynamics of HPos incorporation into emerging LDs. (A) Starved GFP-HPos–transfected cells were analyzed by video microscopy (Video 1). Pre-LDs (white circles) were followed for 5 min and then cells were loaded with OA (+OA). Red circles indicate LDs emerging after 5 or 9 min. Bar, 2 µm. (B) Quantification of HPos fluorescence intensity and size of pre-LDs (black circles) and emerging LDs (red circles) in three independent experiments as in A. (C) Starved GFP-HPos–transfected cells were treated with increasing OA concentrations for 15 min. Cells were fixed and the sizes and numbers of emerg-ing LDs were quantified. **, P < 0.01; ***, P < 0.001. (D) Starved GFP-HPos–transfected cells (top) were loaded with OA for 15 min (bottom). Cells were fixed, neutral lipids were detected with Nile red (red), and the cells were analyzed by microscopy. Arrows indicate the HPos- and Nile red–positive structures. The insets show high-magnification details of pre-LDs (top and middle) and an emerging LD (bottom) labeled with Nile red. Bars: (top and bottom) 20 µm; (middle) 2 µm; (insets) 0.5 µm. Error bars indicate the standard deviation of at least 60 structures from three independent experiments.
on December 30, 2013
jcb.rupress.org
Downloaded from
(ACSL3) was recently described in nascent LDs (Poppelreuther
et al., 2012). Finally, although the presence of diacylglycerol
acyltransferase 2 (DGAT2) on LDs is controversial, the activity
of DGAT2 is required to form triglycerides (Kuerschner et al.,
2008; Stone et al., 2009; Brasaemle and Wolins, 2012). Thus,
these four proteins were tagged and cotransfected with HPos
in starved cells. Emerging LDs were promoted with OA for
7.5, 15, or 30 min, and colocalization between HPos and the
markers was quantified in fixed cells.
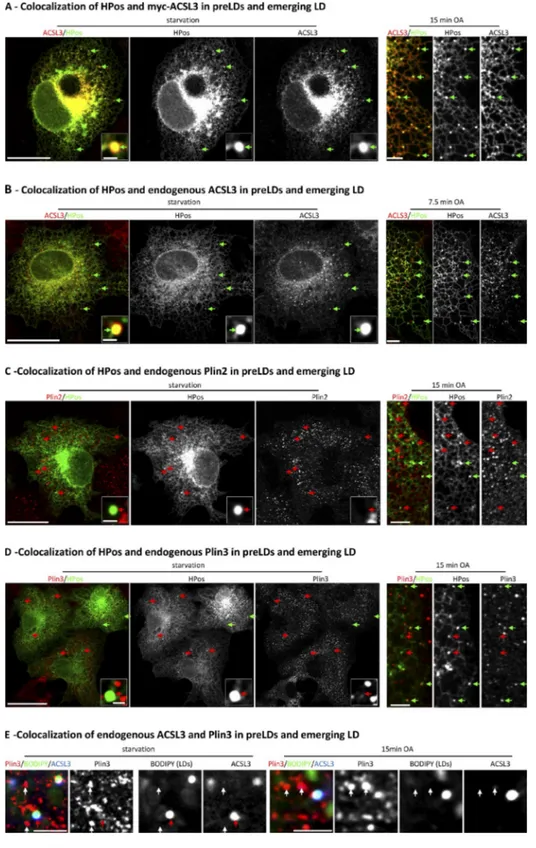
Interestingly, DGAT2 did not colocalize with HPos in
pre-LDs or emerging LDs (Fig. 5, A and B), which suggests
that neutral lipid generation does not necessarily occur at the
sites of storage. Plin2 and Plin3 demonstrated a low
colocal-ization with pre-LDs but progressively accumulated in
emerg-ing LDs. After 7.5 min, 50% of the emergemerg-ing LDs contained
Plin2 and Plin3. Recruitment of these proteins progressively
increased with longer incubations. In agreement with previous
studies (Wolins et al., 2005), Plin3 demonstrated a more rapid
accumulation in emerging LDs than Plin2 (Fig. 5, A and B).
A similar partial colocalization was observed between HPos
and endogenous Plin2 and Plin3 (
Fig. S1
). Interestingly, the
myc-tagged ACSL3 demonstrated an almost complete
colo-calization with HPos on pre-LDs and emerging LDs (Fig. 5,
A and B; and Fig. S1), which suggests that ACSL3 is recruited
earlier to LDs. Before and after OA, Plin3 additionally
accumu-lated in rounded structures that excluded ACSL3 but that were
not LDs as determined by the absence of BODIPY 493/503,
a neutral lipid dye (Fig. S1 E).
To examine whether the increased colocalization with
HPos reflects the progressive incorporation of the markers into
emerging LDs, we studied GFP-Plin2 incorporation via
time-lapse microscopy. Thus, OFP-HPos and GFP-Plin2 were
co-expressed in starved cells. After 5–7 min of OA addition,
HPos-positive emerging LDs were formed. Immediately after
formation these structures excluded Plin2 (Fig. 5 C). However,
Plin2 was recruited to emerging LDs after a mean time of 4.5 ±
1.8 min, which is consistent with the hypothesis that LD
assem-bly follows a coordinated sequence of protein recruitments
(Wolins et al., 2005).
Endogenous ACSL3 is on pre-LDs and emerging LDs
Initially, ACSL3 was defined as an abundant LD protein in
two proteomic screenings (Brasaemle et al., 2004; Fujimoto
et al., 2004). Subsequently, biochemical analysis suggested that
ACSL3 is the most abundant acyl-CoA synthetase long-chain
family (ACSL) on LDs, and the role of this enzyme in LD
for-mation was suggested (Fujimoto et al., 2007). In agreement
with this proposal, inhibition of the ACSLs activity with Triacsin C
blocks the fatty acid–induced formation of LDs (Brasaemle
et al., 2000; Fujimoto et al., 2007; Herms et al., 2013).
Re-cently, as commented above, a fragment of ACSL3 was shown
in nascent LDs (Poppelreuther et al., 2012). Now, we have
demonstrated that full-length ACSL3 is also early to arrive to
emerging LD.
Further, antibodies against ACSL3 demonstrated that the
endogenous enzyme (endACSL3) also accumulates in pre-LDs
trafficking. Thus, the results confirm that HPos shifts from the
ER into nascent LDs.
The assembly of lipoproteins occurs in defined
nucle-ation ER sites, but it has been proposed that LD assembly
initiates spontaneously, simply by accumulation of neutral
lip-ids in the ER (Sturley and Hussain, 2012). If this model is
cor-rect, more lipid arrival should promote more spontaneous LD
nucleation and more emerging LDs. To test this hypothesis,
starved HPos-transfected cells were treated for 15 min with
different OA concentrations, and the number and sizes of
emerging LDs were quantified. Interestingly, consistent with
the existence of a limiting step in LD assembly, lipid
con-centration determined the rate of growth of emerging LDs but
not the number of emerging structures, which was relatively
constant (Fig. 3 C).
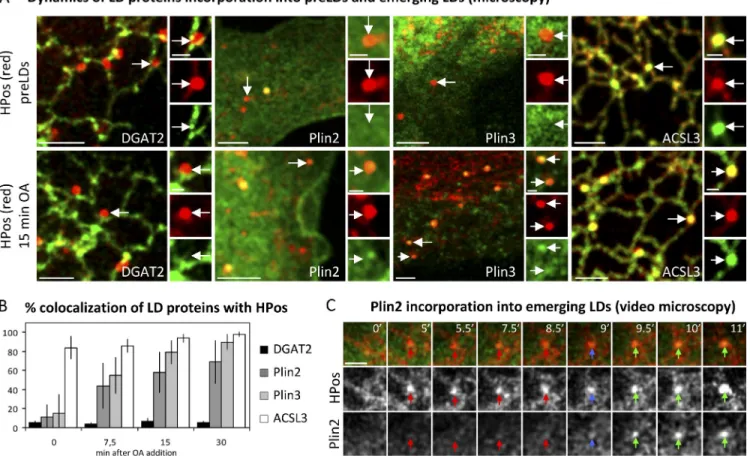
Dynamics of lipid incorporation into pre-LDs and emerging LDs
We next determined whether lipids were incorporating into
pre- and emerging LDs coincident with the HPos
accumula-tion. To visualize lipid dynamics, we used a BODIPY-tagged
fatty acid (FA-BODIPY). This FA-BODIPY is a convenient
tool because it can be followed in living cells and is esterified
(Carten et al., 2011). In COS cells, esterification was observed
early after lipid addition and was highly reduced with Triacsin C
(acyl-CoA synthetases inhibitor, Fig. 4 E), which suggests
lipid metabolism. Further, the signal corresponding to the
esterified fatty acid was lost after saponification of the samples
(not depicted).
Next, starved OFP-HPos–transfected cells were loaded
with OA and the FA-BODIPY (t = 0) and visualized via
time-lapse microscopy (
Videos 2
and
3
). After just 10–30 s, the
lipid accumulated within pre-LDs (Fig. 4 A, white circles).
Emerging LDs appeared 5–7 min after OA addition (Fig. 4 A,
red circles; and Video 3). In this image, two such emerging
LDs are clearly visible at t = 10 min, and by t = 13 one of
them has clearly started to accumulate FA-BODIPY (Fig. 4 A,
blue arrow). By quantifying FA-BODIPY incorporation in
multiple pre- and emerging LDs (Fig. 4 D), we observed that
significant lipid packaging was evident within seconds in
pre-LDs (Fig. 4 B), but for emerging pre-LDs there was a 2.3 ± 0.9 min
mean delay between initial formation of LDs and FA-BODIPY
accumulation (Fig. 4 C). After formation, the rate of lipid
in-corporation into emerging LDs was very similar to pre-LDs
(Fig. 4 D). In conclusion, both pre-LDs and emerging LDs are
bona fide sites of lipid accumulation but with different kinetics.
Dynamics of protein incorporation into pre-LDs and emerging LDsHPos is recruited to nascent LDs before lipid accumulation
be-comes evident, and thus provides a convenient marker to
char-acterize initial stages of LD formation. We therefore used HPos
as a temporal marker to examine the relative arrival of other
proteins involved in the process such as Plin2, Plin3, ACSL3,
and DGAT2. A current model suggests that nascent LDs are
coated with Plin3, which is progressively replaced by Plin2
(Wolins et al., 2005). A fragment of the acyl-CoA synthetase 3
on December 30, 2013
jcb.rupress.org
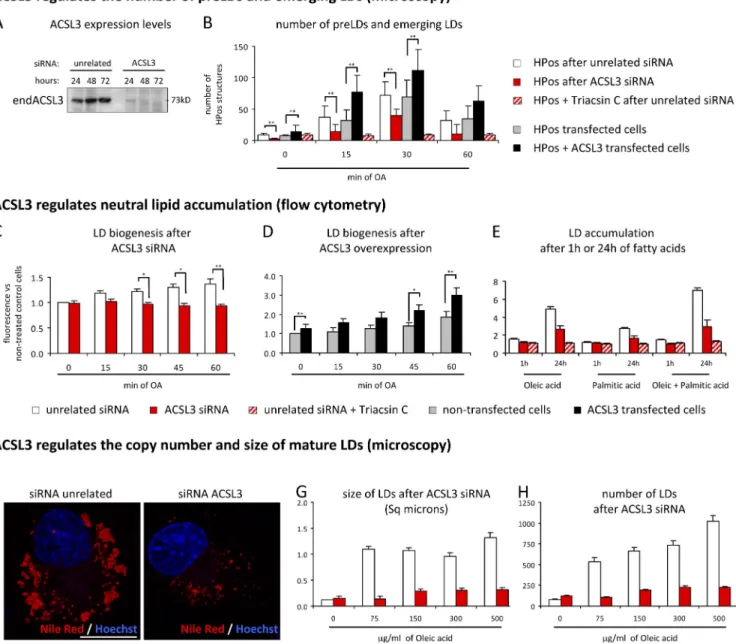
ACSL3 regulates biogenesis, accumulation, copy number, and size of LDs
We quantified the number of pre- and emerging LDs in
HPos-transfected cells with reduced or increased levels of ACSL3
(Fig. 7 A). The number of pre-LDs was significantly reduced
in starved cells with lowered levels of ACSL3 (achieved by
siRNA) and increased in cells cotransfected with the
myc-ACSL3 (Fig. 7 B). Further, the number of emerging LDs was
significantly reduced when the siRNA-treated cells were
in-cubated with OA (Fig. 7 B, red bars) but increased in the cells
cotransfected with the myc-ACSL3 (black bars). After 60 min,
mature LDs, with a ring-like distribution of HPos, accumulated
in more central regions of the cells. These larger LDs, which
(Figs. 6 A and S1) and emerging LDs (Figs. 6 D and S1). In
addition, colocalization between endACSL3 and HPos revealed
the existence of additional pre-LDs in the central regions of
starved cells that were not previously detected by
accumula-tion of HPos (Fig. 6 A, blue arrows). The complete
redistri-bution of ACSL3 from the ER into LDs was confirmed by
fractionation of starved and OA-treated cells (Fig. 6 B) and by
immunofluorescence microscopy (Fig. 6 C). The ACSL3
pro-tein levels were slightly but consistently higher in starved cells
than cells treated for 24 h with OA (Fig. 6 E). Altogether, these
results established that endACSL3 is either recruited early
into emerging LDs or, alternatively, that ACSL3 plays a role
in LD assembly.
Figure 4. Dynamics of lipid incorporation into pre- and emerging LDs. (A) Starved OFP-HPos–transfected cells (top) were treated with OA and FA-BODIPY (bottom) and followed after 15 min by video microscopy (Video 2). Blue and green arrows indicate FA-BODIPY accumulation in pre-LDs. White circles indicate pre-LDs, and red circles emerging LDs. Arrows indicate a representative pre-LD. The degree of colocalization between HPos and FA-BODIPY at different times is indicated by the color of the arrow; red denotes a lack of colocalization, blue partial colocalization, and green complete colocalization. (B) A high-magnification sequence of lipid incorporation into the pre-LD indicated with a red arrow in the first panel of A (Video 3). The arrows mark the pre-LD selected in A. (C) A high-magnification sequence of lipid incorporation into the emerging pre-LD indicated with a blue arrow in the last panel of A (Video 3). Arrows mark a representative emerging LD. (D) Cells were treated as in A, and the FA-BODIPY intensity in at least 30 pre-LDs (black circles), emerging LDs (red circles), and the cytosol (gray circles) was quantified before and after OA in three independent experiments. Error bars indicate the standard deviation between experiments. ***, P < 0.001. (E) Thin-layer chromatography of fluorescent lipids in cells incubated 30, 60, or 120 min with OA and FA-BODIPY or 120 min but in the presence of 10 µM Triacsin C (TC). Bars: (A) 2 µm; (B and C) 0.5 µm.
on December 30, 2013
jcb.rupress.org
Downloaded from
Figure 6. Endogenous ACSL3 colocalize with HPos in pre- and emerging LDs. (A) Starved GFP-HPos–transfected cells were fixed and labeled with an anti-body for ACSL3. Green arrows indicate colocalization, white arrows indicate equivalent structures to pre-LDs found in nontransfected cells, and blue arrows indicate pre-LDs in central regions of the cell. (B) Distribution of ACSL3, Sec61, and Plin2 in starved cells (top) and cells additionally treated with OA for 24 h (bottom) and fractionated in sucrose density gradients. (C) Distribution of ACSL3 in cells treated with OA for 24 h. (D) Starved GFP-HPos–transfected cells were additionally treated with OA for 7.5 or 15 min, and cells were fixed and labeled with the ACSL3 antibody. Green arrows indicate colocalization. (E) ACSL3 protein levels detected by Western blotting of homogenates of normal cells (control), starved cells (24 h stv), and cells additionally treated with OA for 24 h (24 h OA). Bars: (A and C) 20 µm; (D) 1 µm.
Figure 5. Dynamics of protein incorporation into emerging LDs. (A and B) Starved cells (top) cotransfected with OFP-HPos and tagged forms of DGAT2, Plin2, Plin3, and ACSL3 (green), were additionally treated with OA for 7.5, 15 (bottom), or 30 min and analyzed by microscopy. Arrows indicate the structures selected for the high-magnification panels. Bars: (main panels) 2 µm; (insets) 0.5 µm. (B) The percentage of HPos-positive pre- and emerging LDs that accumulated the cotransfected proteins. Error bars indicate the standard deviation of three independent experiments. (C) Starved OFP-HPos and GFP-Plin2 cotransfected cells were loaded with OA and followed for 15 min by video microscopy. After formation (t = 0), HPos-positive emerging LDs require a mean time of 4.5 ± 1.8 min to be recognized by Plin2 (blue and green arrows). Arrows mark a representative emerging LD, and the color of the arrow indicates the degree of colocalization between HPos and Plin2. Bar, 1 µm.
on December 30, 2013
jcb.rupress.org
absence of ACSL3 (Fig. 7 C) but accelerated by overexpression
of myc-ACSL3 (Fig. 7 D). Decreased LD biogenesis in the
absence of ACSL3 was also observed when LDs were
pro-moted with palmitic acid (Fig. 7 E). Further, lack of ACSL3
completely inhibited the incorporation of a radiolabeled OA
into triacylglycerols, as measured by thin layer chromatography
(unpublished data).
Changes in LD assembly should also determine long-term
neutral lipid accumulation. Thus, cells transfected with the
ACSL3 siRNA or with an unrelated siRNA were treated for 12 h
with increasing OA concentrations. LDs were labeled with Nile
were not considered in this initial analysis of emerging LDs,
coexisted with peripheral and small HPos structures,
suggest-ing that new rounds of emergsuggest-ing LDs occur after 30 min of the
lipid arrival (an example is shown in Fig. 1 F).
To demonstrate that the number of pre- and emerging
LDs correlates with the early storage of neutral lipids
occur-ring in these structures (Fig. 3 D), starved cells transfected with
the siRNA for ACSL3 or the myc-ACSL3 were loaded with
OA and labeled with neutral lipid dyes, then cellular
fluores-cence was measured via flow cytometry (Herms et al., 2013).
Accumulation of neutral lipids was completely inhibited in the
Figure 7. ACSL3 regulates LD biogenesis and neutral lipid accumulation. (A) After transfection with the ACSL3 siRNA or an unrelated siRNA, the protein levels of ACSL3 were determined by Western blotting. (B) The number of HPos-positive structures in starved cells (pre-LDs) or in cells additionally incubated with OA (emerging LDs) was quantified. Red and white bars correspond to cells treated for 24 h with the ACSL3 siRNA (red bars) or the unrelated siRNA (white bars), transfected with HPos, and additionally starved for 24 h. In some of these experiments Triacsin C (slashed bars) was present during starva-tion and loading. Gray and black bars correspond to cells transfected with HPos (gray bars) or cotransfected with HPos and myc-ACSL3 (black bars) and starved for an additional 24 h. (C–E) Neutral lipids were quantified by flow cytometry after starvation or the indicated times of fatty acid addition in cells previously transfected with the ACSL3 siRNA (red bars) or the unrelated siRNA (white bars), nontransfected cells (gray bars), or cells transfected with myc-ACSL3 (black bars). In some experiments cells were additionally incubated with Triacsin C (slashed bars). (F–H) Cells treated as in C were loaded with OA for 12 h and stained with Nile red (red in F) and Hoechst to visualize the nucleus (blue). In these images the size (G) and number (H) of LDs were quantified. Bar, 20 µm. Error bars indicate the standard deviation of three independent experiments. *, P < 0.05; **, P < 0.01.
on December 30, 2013
jcb.rupress.org
Downloaded from
proteins such as GFP-Dga1 (t
1/2= 82.9 s) proposed to laterally
move between the ER and LDs (Jacquier et al., 2011).
Pre-LDs could be mature LDs assembled before the
starvation and incompletely metabolized in a lipid-depleted
environment. However, pre-LDs were only partially recognized
by Plin2 and Plin3 (Figs. 5 and S1), which suggests that this is
not the case. Further, pre-LDs were not formed during the
starva-tion period, as the number of these domains was not reduced
by Triacsin C (Fig. 7 B). Thus, one possibility is that pre-LDs
are actually LDs that were forming before the time that cells
were submitted to lipid deprivation, and thus equivalent
struc-tures to the emerging LDs that are only partially recognized by
Plin proteins (Fig. 5, A and B; and Fig. S1). However, such a
model would require that in the absence of a lipid supply, emerging
LDs should be stable in the ER.
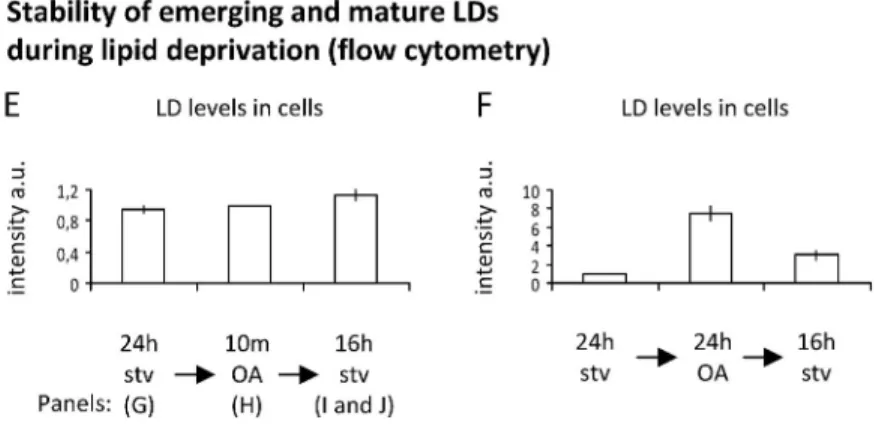
We therefore treated starved cells for 10 min with OA in
order to promote emerging LDs, and then cells were
resub-mitted to starvation for 16 h to test whether these LDs were
stable in the absence of extracellular lipids. Flow cytometry
analysis demonstrated that the accumulation of lipids
pro-moted by the lipid pulse was stable during the second starvation
period (Fig. 8 E). In contrast, mature LDs formed with OA for
24 h and submitted to an identical starvation were metabolized
(Fig. 8 F). The microscopy analysis of cells stained with Nile
red revealed that, in contrast to starved cells (Fig. 8 G), cells
submitted to the single pulse of lipids accumulated numerous
LDs (Fig. 8 H) and that the lipid accumulation persisted after
the second starvation (Fig. 8 I). The stability of these early
formed LDs was confirmed in other cell lines such as 3T3-L1
and mouse embryonic fibroblasts (unpublished data). These
structures excluded endogenous Plin3 (not depicted) and
accu-mulated endogenous ACSL3 (Fig. 8 J).
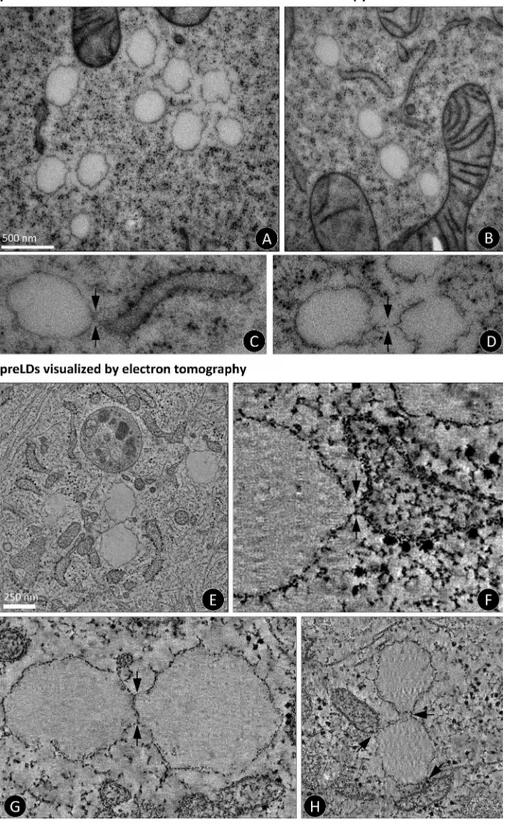
We then characterized the morphology of pre-LDs by
electron microscopy. Cells were treated as indicated above and
processed with no primary fixative and a very quick
nonper-turbing freeze substitution protocol. We found that after the
second starvation, cells accumulated numerous electron lucent
structures that were not present in starved cells (Fig. 9, A and B).
These pre-LDs were often close to the ER, clearly surrounded
by a monolayer, and demonstrated a very consistent size (257.6 ±
31 nm), as expected from a synchronized process of biogenesis
(Fig. 3). In some cases a likely interaction between the LDs
and the ER (Fig. 9 C, arrows) and with other LDs (Fig. 9 D,
arrows) was observed.
To get further structural details, we used electron
tomog-raphy (
Videos 4
and
5
). Cells were treated and processed as
above and the specimen (300 nm thick) was tilted ±60° in both
axes, taking images every 1 or 2° (Nixon et al., 2009). With
this 3D view we did not observe any completely spherical LDs
(Fig. 9 E), which suggests that pre-LDs may be relatively flat
structures (Figs. 9 A and 10). Tomography clearly illustrated
that pre-LDs are surrounded by a monolayer, which was
espe-cially obvious when compared with the ER bilayer
distin-guished by the presence of electron-dense ribosomes (Fig. 9 F
and Video 4). Interestingly, because tomography allows
visu-alization of the organelle at different levels, we observed that
almost all the pre-LDs showed at least one contact with the ER,
red, and final LD copy number and size were quantified in
microscopy images (Fig. 7 F). In control cells, LD size was
rela-tively constant over a broad range of OA concentrations (Fig. 7 G,
white bars), while the number of LDs increased as a function
of lipid concentration (Fig. 7 H, white bars). The lack of ACSL3
drastically reduced both the size and the number of LDs (Fig. 7,
G and H, red bars). The flow cytometry analysis also demonstrated
that cells with lowered levels of ACSL3 accumulated fewer
LDs when treated for 24 h with OA or palmitic acid (Fig. 7 E).
Further, the inhibition of LD formation after the ACSL3
siRNA was rescued by an ectopically expressed siRNA-resistant
ACSL3 (
Fig. S3, D and E
). In addition, ACSL3 also determined
the LD content of hepatic cells (
Fig. S4
).
To analyze whether the enzymatic activity of ACSL3
determines LD formation, cells were loaded with OA, but in
the presence of Triacsin C, an inhibitor of ACSL1, ACSL3, and
ACSL4 (Soupene and Kuypers, 2008). LD nucleation and
ac-cumulation were almost completely inhibited by Triacsin C
(Fig. 7, B and E, slashed bars). A quantitative RT-PCR
(qRT-PCR) analysis demonstrated that ACSL1 and ACSL4 are also
expressed in COS cells. When normalized to the ACSL3
ex-pression, ACSL4 was the most abundant member (×1.2), and
ACSL1 demonstrated a lower but consistent expression (×0.2).
However, siRNAs for these ACSLs did not affect LD
accu-mulation (
Fig. S2, A–E
). Further, when GFP-tagged forms
of these ACSLs were expressed to identical levels, only the
GFP-ACSL3 increased LD formation and accumulation (Fig. S2,
F–H), which suggests that ACSL3 is the member involved in
LD biogenesis. Interestingly, a transfected GFP-ACSL3
with-out the Gate domain (ACSL3gate), and thus with no
enzy-matic activity (Fig. S3), also accelerated the early storage of
neutral lipids and partially increased LD accumulation (Fig. S3,
F and G). This lends support to the hypothesis that although
the enzymatic activity of ACSL3 is required for LD nucleation
and expansion, other properties of the enzyme also cooperate
during the process.
Pre-LDs are stable LDs in restricted ER microdomains
Finally, we wanted to characterize the pre-LDs, and
hypothe-sized that these structures are LDs stably assembled in ER
membranes and specialized in the rapid packaging of arriving
lipids. As expected, pre-LDs accumulated different HPos
pep-tides (OFP-HPos and GFP-Hyd-ER3; Ingelmo-Torres et al.,
2009) but completely excluded HNeu (Fig. 8, B and A).
How-ever, pre-LDs were only partially recognized by ectopically
expressed or endogenous Plin proteins (Fig. 8 C and Fig. S1).
First, to address if pre-LDs are different from the rest of the
ER, we investigated the mobility of HPos and analyzed protein
dynamics by FRAP. Most ER-localized proteins are highly
mobile (Lippincott-Schwartz et al., 2001), and indeed when
GFP-HPos in tubules was photobleached demonstrated a
mo-bile fraction of 99% in 20 s (Fig. 8 D, white circles). In striking
contrast, when the protein on pre-LDs was photobleached, the
mobile fraction was 16% in 20 s (t
1/2= 62.8 s; Fig. 8 D, red
circles). Likely reflecting the smaller size of the peptide, these
kinetics are slightly more rapid but consistent with other LD
on December 30, 2013
jcb.rupress.org
Discussion
The ER is a continuous and dynamic system of connected
mem-branes organized in different subdomains, including the nuclear
envelope, central rough sheet-like structures, and a polygonal
network of tubules extending into the cell periphery (Park
and Blackstone, 2010). The rough ER participates
simulta-neously in protein synthesis, quality control, and protein and
and in some cases a likely continuity between the membranes
of both organelles was observed (Fig. 9 F, arrows). In addition,
pre-LDs were apparently connected to neighboring LDs by a
continuous monolayer (Fig. 9 G, arrows; and Video 4), perhaps
suggesting that those nearby pre-LDs were formed in the same
ER tubule. Some pre-LDs demonstrated a simultaneous triple
connection, for example, with two ER tubules and one LD
(Fig. 9 H, arrows).
Figure 8. Pre-LDs are restricted and stable ER microdomains. (A and B) Starved cells cotransfected with OFP-HPos and GFP-HNeu (A) or OFP-HPos and GFP-HydER3 (an HPos peptide with the positive sequence of ALDI; B) were fixed and analyzed by confocal microscopy. Bars: (left) 25 µm; (right) 2 µm; (insets) 0.5 µm. (C) Starved GFP-HPos–transfected cells were fixed, and distribution of endogenous Plin3 was analyzed with a specific antibody (red). Red arrows indicate the pre-LDs selected for the high-magnification panel. Bars: (main panels) 2 µm; (insets) 0.5 µm. (D) Starved GFP-HPos–transfected cells were photobleached in tubules (black circles) or in pre-LDs (red circles). Fluorescence recovery was quantified. (E and F) Starved cells (stv) were treated for 10 min (E) or 24 h (F) with OA and then submitted to a second starvation for an additional 16 h (16 h stv). Neutral lipids were labeled with Nile red and quantified by flow cytometry. (G–I) Cells treated as in E were stained with Nile red and analyzed by microscopy. Bars: (top) 25 µm; (bottom) 2 µm. (J) Cells submitted to the second starvation period as in E (16 h stv) were fixed and labeled with Nile red (red) and ACSL3 antibody (green). Bars (main panel) 25 µm; (insets) 0.5 µm. Error bars indicate the standard deviation of five (D) or three (E and F) independent experiments.
on December 30, 2013
jcb.rupress.org
Downloaded from
free fatty acids and cholesterol can be toxic, they are rapidly
esterified into neutral lipids that accumulate in LDs. In
mam-malian cells, the ER harbors enzymes required for neutral lipid
synthesis (Buhman et al., 2001), which suggests that this
organelle is also specialized in lipid storage. However, this
ER-generation model has been continuously challenged because sites
and mechanisms of LD nucleation remain poorly understood.
Here, with fluorescent peptides that shift between the ER
and forming LDs, we observed three early aspects of lipid
lipid secretion. The tubules specialize in detoxification, lipid
synthesis, and interaction with other organelles. Remarkably,
although all these ER subdomains and microdomains are
con-tiguous and physically in contact, highly selective yet poorly
understood mechanisms must exist to ensure that they are
func-tionally segregated.
Fatty acids and cholesterol are key molecules in many
cellular processes ranging from the production of metabolic
en-ergy to the regulation of membranes fluidity. However, because
Figure 9. Ultrastructure of pre-LDs. Cells submitted to the second starvation period as in Fig. 8 E (16 h stv) were analyzed by elec-tron microscopy (A–D) and elecelec-tron tomogra-phy (E–H). A, B, and E show a general view of the cells. Arrows in C, F, and H indicate possible interactions between the ER and pre-LDs. Arrows in D, G, and H indicate possible interactions between neighboring pre-LDs. For additional details, E and G correspond to the central pre-LD of Video 4, and F corresponds to the central pre-LD in Video 5.
on December 30, 2013
jcb.rupress.org
storage (Welte, 2007), protein degradation (Wang and Lee, 2012),
or immunity (Anand et al., 2012), the stability of the pre-LDs
might facilitate these roles even during a prolonged absence of
extracellular lipids.
How and where are these pre-LDs and LDs formed? Most
models suggest that LDs originate in the ER bilayer and then
remain connected to the ER, or alternatively bud off to become
independent organelles (Walther and Farese, 2012). Based on
freeze-fracture electron microscopy, it has been proposed that
the LDs grow within a concave depression of the ER or
“egg-cup” (Robenek et al., 2006). Other models hypothesize
vesic-ular budding (Walther and Farese, 2009) or bicelle excision
from the ER (Ploegh, 2007).
Here, our simultaneous visualization of emerging LDs
(HPos) and the neighboring ER tubules (HNeu), in conjunction
with the electron tomography, supports the overall hypothesis
that LDs do indeed originate in the ER. HPos rapidly moves
from the ER into pre- and nascent LDs and, at least during the
initial steps of biogenesis, all our images demonstrate that LDs
are in contact with the ER (Figs. 2, 5, 8, and S1). Electron
mi-croscopy and tomography confirm that LDs are clearly
sur-rounded by a single monolayer, which is consistent with the
idea that neutral lipid deposition occurs between the two leaflets
of the ER bilayer. Rather than an “eggcup,” the tomography
demonstrates multiple but discrete interactions between the
ER and LDs and in some cases a likely continuity between
both membranes. Real-time microscopy of emerging LD
forma-tion did not show perceptible budding or detachment processes
storage. First, arriving lipids are packed in preexisting, or
re-sistant to starvation, LDs. Second, the continuous lipid
ar-rival promotes the formation of a first round of emerging LDs.
This assembly is a synchronized stepwise process of protein
gathering, lipid accumulation, and recognition by Plin2 and
Plin3. The concentration of arriving lipids determines the rate
of growth of emerging LDs but not the copy number of
emerg-ing structures, which suggests that the nucleation domains are
predefined in the ER. Third, after this initial nucleation, and
proportionally to lipid availability, more LDs will be
progres-sively nucleated. Restricted by a relatively constant maximal
size of individual LDs, cells nucleate additional LDs to store
additional lipids (Fig. 7, G and H).
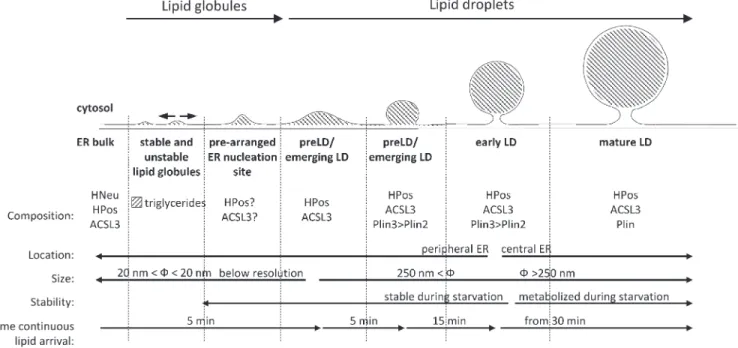
We hypothesize that these successive events reflect
dif-ferent stages of the same stepwise maturation process (Fig. 10).
This scenario is possible because emerging LDs are stable in
the absence of an additional lipid supply. Lipid arrival will
promote gradual progression of each step into the next, but lipid
depletion will stop progression, though not reverse it, until new
lipid arrives. A possible explanation for such stability is that
these early LDs may not have acquired the protein composition
that facilitates lipolysis, and thus, maturation of LDs may be
necessary to allow access of lipases. The existence of a set of
LDs resistant to starvation guarantees efficient packaging in
the ER of occasional lipids, and if lipid arrival persists, the
assembly of new LDs will allow medium- and long-term
stor-age. Further, because LDs are not simply sites of lipid storage
but are also involved in other cellular functions, such as protein
Figure 10. Model of a self-reinforcing stepwise LD formation. Continuous lipid arrival promotes the formation of emerging LDs in 5 min. Initially, newly synthesized neutral lipids can be integrated in the ER membrane. However, addition of new triglycerides to the globule will promote phase separation and the deposition of the globule between the two leaflets of the ER bilayer. These globules produce a transient curvature of the ER membrane or move two-dimensionally within the bilayer, fuse with other globules, and generate curvature of the ER. Proteins with amphipathic helices, such as HPos or ACSL3, are then attracted to these regions. The stable interaction of these proteins nucleates unstable globules and marks the onset of LD biogenesis. The enrichment of ACSL3 locally generates the acyl-CoA required for LD growth and expansion but also numerous bioactive lipid intermediates. Emerging LDs expand and the lipid intermediates are recognized by Plin proteins. If lipid supply ends, these structures become stable and remain connected to the peripheral ER. If lipid supply persists, emerging LDs increase in size to become early and mature LDs. Early and mature LDs accumulate in the central ER and are metabolized during starvation.
on December 30, 2013
jcb.rupress.org
Downloaded from
demonstrated that ACSL3 channels fatty acids into nascent LDs.
The absence of ACSL3 significantly reduces nucleation of
emerging LDs, short- and long-term accumulation of neutral
lipids, and the size and number of mature LDs. On the contrary,
down-regulation or overexpression of other family members
did not modify the process. Reduced ACSL3 levels in the
nucle-ation sites likely decrease local accumulnucle-ation of acyl-CoA,
decrease substrate availability for the reactions described above,
and thus reduce the efficiency of the process that relies on lipids
activated elsewhere. Interestingly, similarly to perilipins, the
expression of the ACSL family members is regulated during
differentiation of 3T3 fibroblasts into adipocytes. ACSL1 is
up-regulated (similar to Plin1) but ACSL3 is highly
down-regulated (similar to Plin2 and Plin3; Sandoval et al., 2008).
Thus, in mature 3T3 adipocytes it is likely that factors other
than ACSL3 assist LD nucleation and expansion.
Although the enzymatic activity of ACSL3 is crucial for
LD formation, clearly suggested by the complete inhibition
caused by Triacsin C, other functions might also be important,
as ACSL3 lacking enzymatic activity also increased LD
nucle-ation. Although this initial observation requires further analysis,
and ACSL3’s amphipathic helices might simply contribute to
membrane curvature as suggested above, the capacity of ACSL3
for interaction with other LD proteins could potentially
orga-nize specific regions within the complex mixture of proteins
and lipids residing in or in transit on the ER tubules. Indeed,
ACSL3 interacts with Spartin/SPG20 and AUP1 that are in turn
crucial scaffolding proteins that determine LD composition,
size, and numbers (Milewska et al., 2009; Klemm et al., 2011).
Accordingly, ACSL3 has been found in complexes with neutral
lipid synthesis enzymes (Wilfling et al., 2013). In addition,
dynamic relocation of the enzyme between the ER tubules,
pre-LDs, and LDs might represent a cellular homeostatic sensor
given that ACSL3 regulates the activity of key lipogenic
tran-scription factors such as PPAR-, ChREBP, SREBP1-c, and
LXR- (Bu et al., 2009).
In conclusion, the model proteins generated for this
study enabled us to anticipate, visualize, and characterize LDs
emerging from the ER membranes. We demonstrate that early
LDs are stable ER microdomains in the absence of lipid supply,
and that lipid storage occurs via multiple processes with
dif-ferent kinetics. Finally, we have shown that ACSL3 is important
for efficient LD nucleation and that ACSL3 is the family
mem-ber that efficiently channels lipids into nascent LDs.
Materials and methods
Antibodies and reagents
OA and mowiol were obtained from EMD Millipore. Fatty acid–free BSA (A8806), palmitic acid, sucrose, saponin, brefeldin A, platensimycin, cy-cloheximide, and Nile red were obtained from Sigma-Aldrich. BODIPY 493/503, Hoechst-33258, and BODIPY-FL C16 were from Molecular Probes. LipidTOX Deep Red Neutral Lipid Stain was from Life Technologies, Invitrogen. Paraformaldehyde was from Electron Microscopy Sciences and Triacsin C from Santa Cruz Biotechnology, Inc.
Rabbit polyclonal antibody anti-GFP (ab290), rabbit polyclonal anti-Plin2 (ab52355), rabbit polyclonal anti-ACSL1 (ab76702), rabbit monoclonal anti-ACSL4/FACL4 (ab155282), mouse monoclonal anti-actin (ab40864), and mouse monoclonal anti–c-myc (ab32) were from Abcam. Rabbit polyclonal anti-Sec61 (07–204) was from EMD Millipore. The
involving ER membranes (Fig. 3). Further, bicelle formation or
vesicular budding are inconsistent with the observation that
LDs often have extended connections with neighboring LDs.
Thus, we favor a “blister-like” organization of lipid
glob-ules in the bilayer, observed in early electron microscopy
stud-ies of the ER of plants and proposed using simulation models
(Wanner et al., 1981; Khandelia et al., 2010). Initially, newly
synthesized neutral lipids can be integrated in the ER
mem-brane (for review see Suzuki et al., 2011). However, continuous
lipid arrival increases the relative concentration of
triacyl-glycerols in the membrane, promoting phase separation, and the
deposition of globules of neutral lipids between the two
leaf-lets of the ER bilayer. Biophysical models predict that the
di-ameters of these primordial globules are 20 nm (Zanghellini
et al., 2010). These globules can already cause transient
curva-ture of the ER membrane, or move two-dimensionally within
the bilayer, fusing with other globules, and generate a more
pronounced curvature (Khandelia et al., 2010; Suzuki et al., 2011;
Fig. 10). Proteins with amphipathic helices anchored to the
cytosolic side of the ER can rapidly recognize curved
mem-branes, acting as neutral lipid sensors (McMahon and Gallop,
2005). Consistent with this hypothesis, a significant number of
proteins are anchored to LDs by amphipathic helices (for
re-view see Walther and Farese, 2012). The strong and stable
inter-action of these proteins with the membrane likely provides the
equilibrium required to nucleate unstable globules in defined
ER sites, mark the onset of LD biogenesis, and produce the
blister-like morphology of the ER bilayer.
The above mechanism could accumulate ACSL3 at
these ER sites, as this enzyme contains amphipathic helices
(Poppelreuther et al., 2012). Our preliminary in silico analysis
confirms this possibility for ACSL3 and HPos (
Fig. S5
). In any
case, enrichment of ACSL3 on emerging LDs will generate a
concomitant local enrichment of acyl-CoA, which is essential
to synthesize lysophosphatidic acid, diacylglycerol,
triacylglyc-erol, and phospholipids required to increase the size of the
primordial globule and the expansion of the emerging LD
(Kuerschner et al., 2008; Skinner et al., 2009; Adeyo et al.,
2011; Fei et al., 2011; Krahmer et al., 2011; Moessinger et al.,
2011; Wilfling et al., 2013). In parallel, transient generation of
active lipid intermediates, such as phosphatidic acid and
diacyl-glycerol, will also modify the shape of the membrane and
re-cruit proteins (for review see Brasaemle and Wolins, 2012).
Such a self-reinforcing process is consistent with the kinetics of
delayed formation of emerging LDs after lipid arrival and with
the observation that pre-LDs, containing ACSL3, are able to
initially pack arriving lipids more rapidly.
The ACSL family mediates the conversion of long-chain
fatty acids into acyl-CoA, and it is assumed that each ACSL
isoform channels with high specificity the fatty acid to distinct
metabolic fates (Ellis et al., 2010). Although the presence of
ACSL1 and ACSL4 on LDs was suggested by proteomic analysis
(Brasaemle et al., 2004; Liu et al., 2004; Wilfling et al., 2013),
this finding was questioned (Poppelreuther et al., 2012). In
con-trast, it seems accepted that the ACSL3 is on LDs, and
accord-ingly a role of this enzyme during LD biogenesis was proposed.
Here, we have experimentally addressed this possibility and
on December 30, 2013
jcb.rupress.org
Confocal microscopy
Cells were fixed in 4% PFA diluted in PBS for 1 h at room temperature. In some experiments, fixed cells were stained with Nile red added to Mowiol at 1:1,000 dilution (from saturated stock solution in acetone) or BODIPY 493/503 for 30 min in PBS. For immunofluorescence micros-copy, fixed cells were permeabilized in 0.1% saponin in PBS for 10 min at RT, and blocked with 0.2% BSA in PBS for 10 min at room tempera-ture. Then cells were incubated with anti-ACSL3 (1:200), anti-Plin2/ ADRP (1:100), anti-Plin3/TIP47 (1:200) or anti-myc (1:250) for 1 h at room temperature, followed by three washes in PBS and incubation with Alexa Fluor 555– or 647–conjugated anti–mouse or anti–rabbit IgG antibody (1:250) for 45 min, washed in PBS, and mounted in Mowiol (Sigma-Aldrich).
Cells were examined using a 63× oil immersion objective in a laser scanning confocal microscope (TCS SL; Leica) with a pinhole of 1.5 AU. All images are single confocal sections. For quantification, trans-fected cells were randomly selected, and image analysis was performed with Photoshop CS software (Adobe). The quantifications of size and number of pre-LDs and emerging LDs, and the colocalization of trans-fected proteins with HPos, were performed in three independent experi-ments and at least 20 cells per experiment using ImageJ software (National Institutes of Health).
The number and size of mature LDs (Fig. 7, G and H) was calculated using the custom-written MATLAB code. In these experiments, living cells were labeled by addition of 0.3 µM Hoechst-33258 and 0.83 µg/ml Nile red in the culture media. Cells were randomly selected, and images were captured in a laser scanning confocal spectral microscope (TCS SP5; Leica) equipped with an incubation control system (37°C and 5% CO2) with a 63× oil immersion objective lens with an NA of 1.4, using a 405-nm and 561-nm laser lines, respectively. Mean area of a single LD was calcu-lated by scoring all the structures that were <800 nm in diameter, which is the diameter of the largest single LD observed. Images were acquired with a pixel size of 80 nm to accurately resolve these structures, according to Nyquist theorem. The sum total of the areas of all LDs whose diameter was <800 nm was divided by the number of LDs <800 nm in diameter. Cells treated with high OA had clusters with inseparable LDs. To estimate the number of LDs/cell in such cells, the total area of LDs including the clusters was divided by the mean area of single LD in each cell.
Time-lapse video microscopy
Time-lapse video microscopy was performed with a laser scanning confo-cal spectral microscope (TCS SP5; Leica) equipped with an incubation control system (37°C, 5% CO2). Cells were transfected and treated as ex-plained above. In some experiments, cells were additionally treated with 10 µg/ml of cycloheximide for 3 h to reduce the pool of newly synthe-sized protein. Cells were selected for the labeling of well-defined ER elements. OA (175 µg/ml) and in some cases BODIPY-FLC16 (FA-BODIPY, 1 µM) were added and images were captured every 9 s with a 63× oil immersion objective lens with an NA of 1.4, at 6× zoom, using 488-nm and 561-nm laser lines. Movies were digitally treated with the Leica Ap-plication Suite software (3.10 build 8587). In the experiments using FA-BODIPY, the mean background fluorescence was calculated from at least three different cytosolic regions at time 0 (just before the addition of the green fatty acid). This background was identically subtracted from all the frames of the movies. In the case of the transfected peptides, the mean unspecific background was calculated from an extracellular region at time 0 and identically subtracted from all the frames of the movies. Finally, all the frames of the movies were identically filtered with a Gaussian blur filter using radius 2. Fluorescence intensity and LDs size were quantified using Photoshop CS software (Adobe) from three independent experi-ments and at least 20 structures per experiment.
FRAP
FRAP experiments were performed on a laser scanning confocal spectral microscope (TCS SP5; Leica) equipped with an incubation control system (37°C, 5% CO2). A defined region of interest (ROI, 0.5 µm of diameter) was photobleached at full laser power (100% power, 50–80 iterations), and recovery of fluorescence was monitored by scanning the ROI at low laser power (1–4% of laser power, 20 s of 0.75-s interval scans). Fluores-cence intensity was normalized to the prebleach intensity. Any loss of fluo-rescence during the recording was corrected with unbleached regions of the cell. The values were fitted to a nonlinear regression equation, F(t) = M[1 exp(t/t1/2)], where F is the fluorescence intensity, M is the mobile fraction, and t1/2 is the time constant.
mouse polyclonal anti-ACSL3 (B01P) was from Abnova. Guinea pig poly-clonal antibody against Plin3 was from Progen. Alexa Fluor 555– and 647– conjugated secondary antibodies were from Life Technologies, Invitrogen.
Silencer siRNAs against human ACSL1, ACSL3, and ACSL4 were obtained from QIAGEN in a FlexiTube format. The siRNA target sequences were as follows: For ACSL1, 5-AAGGATGCTTTGCTTATTCGA-3, 5-TCG-CAGCGGCATCATCAGAAA-3, 5-CAGGTGTTTGTCCACGGAGAA-3; for ACSL3, 5-CCGAAGTGTGGGACTACAATA-3, 5-AACCACGCAGC-GATTCATGAA-3, 5-ACCGCGTGAGTTAAGATTTAA-3, and 5-TAGCTC-GAAAGAAAGGACTTA-3; for ACSL4, 5-ATGCATCATAGCAATTTGATA-3, 5-TTGGAGCGATTTGAAATTCCA-3, 5-CAGATTATAGATCGTAAGAAA-3, and 5-AAGGGCAGAGTTACTTGATAA-3. The nonrelated siRNA used was against GFP from Thermo Fisher Scientific.
Plasmids
Mutant proteins were N-terminally tagged with the GFP (unless otherwise indicated). Standard YUX cloning, using primers containing BspEI (for-ward) and SmaI (back(for-ward) restriction sites, was used to synthesize GFP-HPos and GFP-HNeu. The orange-tagged HPos mutant was obtained after subcloning of the GFP-HPos into mOrange expression vector provided by R.Y. Tsien (Howard Hughes Medical Institute, Chevy Chase, MD). The mOrange expression vector was obtained by amplification of the fluores-cent protein with a 5 primer encoding an AgeI site and a 3 primer encod-ing a BspEI site and ligated into similarly digested pEGFP-C1 (Takara Bio Inc.) cloning vector backbones. The pEGFP-DGAT2 construct was derived from the plasmid pCDNA3-Flag-DGAT2 provided by R.V. Farese (Gladstone Institute of Cardiovascular Disease, San Francisco, CA) and subcloned into a pEGFP-C3 expression vector to generate a GFP fusion. The pCDNA4/TO-myc-ACSL3 was provided by N. Yamaguchi (Graduate School of Pharmaceutical Sciences, Chiba, Japan). The construct was gen-erated by subcloning human myc-ACSL3 cDNA into pCDNA4/TO vector (Invitrogen). pCDNA 3×myc-tagged Plin3 was provided by S. Pfeffer (Stanford University School of Medicine, Stanford, CA). The construct was obtained by amplification of the full length by PCR with the introduction of EcoRI and XbaI sites for cloning into pcDNA3.1 and a 5 EcoRV site for the insertion of the 3× Myc repeats generated by PCR. The pEFGP vector en-coding human Plin2 was provided by J. McLauchlan (Institute of Virology, Glasgow, Scotland).
For the expression vector encoding siRNA-resistant ACSL3, five si-lent mutations were introduced in each of the four siRNA target sequences. The construct ACSL3 Gate results from deletion of the amino acids 314–339 (fatty acid Gate domain; Soupene et al., 2010) from siRNA-resistant ACSL3. Both cDNAs were purchased from GenScript and sub-cloned in pEGFP vector. GFP-tagged expression vectors containing human cDNAs for ACSL1, ACSL4, and ACSL5 (catalog Nos. RG208196, RG205356, RG201076, respectively) were purchased from OriGene. Cell culture
COS-1 cells (African green monkey kidney fibroblast-like cell line) were cultured in 5% vol/vol FCS and Huh7 and HepG2 (human hepatoma cell lines) in 10% vol/vol FCS (Biological Industries). All cells were main-tained at 37°C and 5% CO2 in DMEM (Biological Industries) supplemented with 4 mM l-glutamine (Sigma-Aldrich), 1 mM pyruvate (Sigma-Aldrich), nonessential amino acids (Biological Industries), 50 U/ml penicillin, and 50 µg/ml streptomycin sulfate (Biological Industries). Starvation was per-formed by culturing cells in DMEM, l-glutamine, pyruvate, and nonessen-tial amino acids but in the absence of serum for 24 h. To promote the formation of LDs, cells were treated with OA and/or palmitic acid conju-gated to fatty acid–free BSA at a molar ratio of 6:1 and added to the cul-ture medium to give a final concentration of 175 µg/ml (unless other concentration is specified).
Transfections
The siRNA transfections were performed using Lipofectamine RNAiMAX reagent (Invitrogen, Life Technologies). All procedures were performed ac-cording to the manufacturer’s instructions. For DNA transfection experi-ments, cells plated at 18,000 cells/cm2 on glass coverslips the day before were transfected with the corresponding fusion proteins using Effectene Transfection Reagent (QIAGEN). To reduce the number of LDs, transfection was performed in DMEM supplemented with 0.5% FCS and changed to DMEM without serum 6 h after transfection. The precise concentration of each construct was specifically adjusted to get a similar expression and transfection efficiency. In experiments involving siRNA and DNA transfec-tions, the DNA was transfected 24 h later than the siRNA.