Facoltà di Medicina e Chirurgia
Corso di Dottorato in Salute dell’Uomo XXXII Ciclo
E
ARLY RETINAL FLOW CHANGES AFTER
VITREORETINAL SURGERY IN IDIOPATHIC
EPIRETINAL MEMBRANE USING SWEPT SOURCE
OPTICAL COHERENCE TOMOGRAPHY
ANGIOGRAPHY
PhD Candidate: Dott. Rodolfo Mastropasqua Main Supervisor: Prof. Cesare Mariotti
1. Abstract 3
2. Ocular vascularization 4
3. Optical Coherence Tomography Angiography (OCTA) 6
Overview on technical aspects 6
Visualization of OCTA images 7
Comparison with dye-‐based imaging techniques 8
Limitations and artifacts 9
OCTA quantitative metrics 11
Small field OCT Angiography 13
Wide field OCT Angiography 15
4. Epiretinal Membrane 16 Epidemiology 17 Clinical Features 17 Treatment 18 5. Experimental Section 19 Methods 20 Study participants 20 Image acquisition 21 Image processing 21 Surgical procedure 23 Statistical analysis 23 Results 24
Characteristics of diseased and healthy eyes at the baseline 24 Comparison between pre-‐operative and post-‐operative morphological and functional parameters
of diseased eyes 26
Discussion 28
3 1. Abstract
Background: The aim of this observational cross-sectional work was to investigate early retinal vascular changes in patients undergoing idiopathic epiretinal membrane (iERM) surgery using swept source optical coherence tomography angiography (SS-OCTA). Methods: 24 eyes of 24 patients who underwent vitrectomy with inner limiting membrane (ILM) peeling were evaluated pre- and postoperatively using SS-OCTA system (PLEX Elite 9000, Carl Zeiss Meditec Inc., Dublin, CA, USA). For each eye, five 6x6-mm OCTA volume scans were acquired by two observers independently. The en face images of superficial capillary plexus (SCP) were then exported to imageJ and a semi-automated algorithm was used for subsequent quantitative analysis. Perfusion density (PD), vessel length density (VLD), vessel diameter index (VDI) and vessel tortuosity (VT) of SCP were evaluated in both the parafoveal (2.5 mm diameter) and perifoveal areas (5.5 mm
diameter).
Results: At OCTA analysis statistically significant differences were found between controls and diseased eyes for all parameters in parafoveal and perifoveal regions (p<0.001; p<0.05) except for perifoveal VLD. 1 month after surgery, SCP VLD and VT significantly increased in parafoveal region (p= 0.043 and p= 0.045 respectively) compared to preoperative values.
Conclusions: SS-OCTA provides a quantitative and qualitative analysis of the superficial capillary plexus allowing for early vascular changes assessment after vitrectomy with iERM and ILM peeling.
2. Ocular vascularization
The ophthalmic artery provides the vascular supply to the eye. This artery arises from the internal carotid artery and divides to constitute the central retinal artery, the short and long posterior ciliary arteries (SPCAs and LPCAs, respectively), and the anterior ciliary
arteries[1].
The central retinal artery is contained in the optic nerve and from the optic nerve head to the retinal periphery progressively branches into smaller retinal arterioles. These retinal arterioles supply the inner retina, while the outer retina is supplied by the choroid. The central retinal vein drains the retinal tissue and leaves the eye through the optic nerve. Importantly, histological studies of the human retina have demonstrated that retinal vessels constitute three distinct capillary layers: the superficial (SCP), middle (MCP), and deep capillary (DCP) plexuses [2]. In addition, a fourth vascular layer, the radial peripapillary capillary plexus (RPCP), is mainly located within the superficial nerve fiber layer (NFL) surrounding the optic disc. In the latter vascular plexus, long capillary segments are oriented parallel to the direction of retinal ganglion cell axons [3, 4]. Noteworthy, the retinal capillaries are featured by walls without fenestrations and by tight junctions
5
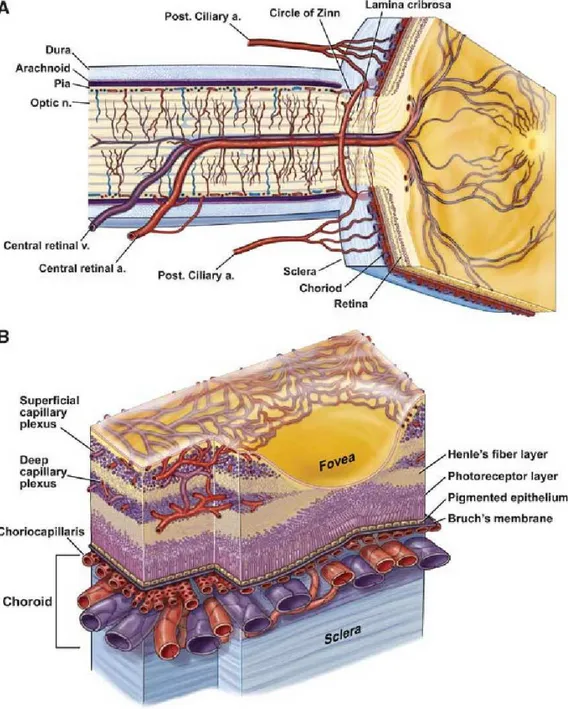
Figure 1: Ocular vascularization. A. Retinal and ciliary vessels entering the eye. B. Retinal and choroidal vessels networking in different capillary plexa.
The choroid is supplied by the short and long posterior ciliary arteries. Some branches of the SPCAs also supply the optic disc via an anastomotic ring named the circle of Zinn-Haller. Histological studies have demonstrated that the choroid is constituted of five sublayers: Bruch’s membrane, the choriocapillaris (CC), Haller’s and Sattler's layers, and
the suprachoroidal space[1]. The Haller’s and Sattler's layers contain larger diameter vessels which are directly supplied by the SPCAs and LPCAs. Conversely, the
choriocapillaris is a highly anastomosed network of capillaries arising from the arterioles in Sattler's layer and is located between Bruch’s membrane and the medium-sized
choroidal vessels. This vascular layer is organized into a series of hexagonal-shaped lobules, which were demonstrated to be progressively larger toward the periphery. In contrast with the retinal vessels, the CC is unique in that it is fenestrated and this facilitates the movement of even large macromolecules into the extra-capillary compartment. Four vortex veins drain the choroidal tissue and run posteriorly in the sclera leaving the eye well posterior to the equator [5].
The LPCAs run anteriorly between the sclera and choroid and connect to the anterior ciliary arteries shaping the major arterial circle of the iris. The anterior ciliary arteries reach the sclera near the limbus after travelling with the extraocular muscles [1].
3. Optical Coherence Tomography Angiography (OCTA)
OCTA has significantly expanded our knowledge on several ocular and systemic disorders [3, 4, 6-15].
Overview on technical aspects
Structural OCT can acquire volumetric images of the retina by executing successive single two-dimensional B-scans at different retinal locations. Conversely, OCTA devices perform several repeated B-scans at the same retinal location and the obtained structural data are compared to detect signal changes secondary to flowing erythrocytes (motion
contrast)[16]. Furthermore, each B-scan is composed of several A-scans that are acquired at sequential positions to cover the whole B-scan size. The A-scan rate is dependent on the
7
OCT instrument and is typically comprised between 70,000 A-scans per second (spectral domain devices) and 100,000 A-scans per second (swept source instruments). Of note, faster acquisition speeds may characterize research instruments.
The interscan time, which represents the delay between two B-scan repeated at the same retinal location, has a crucial role. Therefore, while a longer interscan time may increase sensitivity to motion, this also increase the occurrence of eye motion which can alter the motion signal.
In order to detect the motion contrast, three different methodologies may be used by OCTA devices, as follows: (i) phase-based; (ii) amplitude-based; and (iii) complex amplitude-based, in which OCTA algorithm uses both phase and amplitude information. The OCTA signal is typically normalized between 0 and 1. The interscan time and the background noise determine the slowest detectable flow. Erythrocytes must have covered enough distance within repeated B-scans to be detected. In addition, differences in signal must be higher than the background noise to be detected as flow[17]. This causes an intrinsic limitation to current OCTA technology which may not be able to distinguish the absence of flow from slow flow below a detectable threshold range.
Optical coherence tomography angiography may be captured with spectral domain OCT (SD-OCT), which in commercial devices employs a wavelength at around 840nm, or with swept-source OCT (SS-OCT), which uses a longer wavelength (∼1050nm).
Visualization of OCTA images
While OCT is considered a cross-sectional imaging modality, OCTA images are mainly displayed with en face visualization. The en face approach combines the 3-dimensional volumetric information obtained from previously established OCT techniques for the automated segmentation of anatomic reference planes, which allow the definition of
“slabs” and the segmentation of the volumetric OCTA scans at specific pre-set and/or customizable depths. Using this strategy, the flow data within any slab are summed or projected into a two-dimensional en face image that can be viewed and studied.
The creation of the 2-dimensional OCTA en face images can be obtained with different methods. The “maximal intensity projection” process projects the increased sensitivity to noise may occur. Other processes to obtain the 2-dimensional OCTA images include the “average intensity projection” process, which is less sensitive to noise and small vessels.
Figure 2: B-scan sectional and en face visualization of a 3×3 3 mm OCTA acquisition centered on the fovea of a healthy retina.
Noteworthy, while most OCTA studies use the en face visualization of the images, this visualization is more susceptible to segmentation errors or artifacts, especially in eyes with retinal and choroidal pathologies, such as macular neovascular disease. For this reason, cross-sectional OCTA scans may be helpful for studying these eyes [8]. These OCTA B-scans typically show flow in color (red or yellow) over the grayscale OCT image.
Comparison with dye-based imaging techniques
Fluorescein angiography (FA) and indocyanine green angiography (ICGA) have
traditionally been considered the gold standard for clinical assessment of the retinal and choroidal vasculature in vivo. Even though dye administration is generally safe in patients, serious allergic reactions may occur, and these techniques are considered invasive and
9
require considerable patient cooperation. On contrary, OCTA provides non-invasive assessment of the retinal and choroidal vasculatures. Moreover, OCTA has the additional advantage of depth-resolution with improved visualization of the deeper vascular plexuses. Despite these limitations, dye-based imaging provides other advantages including dynamic estimation of dye transit and dye leakage in diseases affecting the blood-retinal barrier (e.g. diabetic retinopathy, macular neovascular disease).
In addition, FA has some limitations in the assessment of the retinal vessels, given that visibility of the capillaries is lower with increasing distance from the fovea and for smaller vessels. Furthermore, FA has significant deficiencies in the visualization of the choroid, given that fluorescein is a small molecule which rapidly leaks from the choroidal vessels [18]. In contrast to FA, ICGA grants an improved visualization of the choroid. ICGA employs an alternative dye that is significantly (99%) bound to plasma lipoproteins thus limiting choriocapillaris leakage [19]. Furthermore, ICGA uses a longer excitation wavelength and emits fluorescence in the 800-860 nm range, allowing a more efficient penetration through RPE, other ocular pigments and even eventual emorrages [20].
Limitations and artifacts
Imaging the vascular plexuses with OCTA may also be challenging because of different artifacts which may alter their visualization [21].
Low signal strength may significantly affect the quality of the OCTA images. The signal to noise ratio between the signal component, which is the information dependent on the imaged tissue, and the non-signal component (or noise), is a mathematical relationship which may influence the image quality. As an example, media opacities may reduce the signal to noise ratio by decreasing the OCT signal [21]. A decreased signal to noise ratio leads to an adjustment of the grayscale range with a consequent increase in image noise and false OCTA signal. Averaging of multiple en face OCTA images may reduce noise, as well as significantly improve qualitative and quantitative measurements.
False OCTA signals may be also generated by movement of the eye, head, or body. Recent advancements in eye tracking systems have however significantly decreased the impact of these artifacts in OCTA imaging. Using eye tracking, the retina position is rapidly tracked, and corrective movements are applied.
Segmentation error represents a significant and recurring OCTA artifact. As discussed above, en face OCTA images are displayed by locating two boundaries throughout the retinal and/or choroidal structure and vessels are therefore visualized using different available processes. These boundaries may be set by selecting pre-defined layers which can be differentiated on the basis of reflectivity, texture or other attributes [22]. The main problem with this strategy is that these parameters used to differentiate retinal and
choroidal layers may be significantly modified in pathological conditions. As an example, the automatic segmentation of vascular layers may be challenging in eyes with myopia, even in the absence of chorioretinal complications. Of note, many OCTA devices employ software enabling manual correction of segmentation errors and propagation of corrections throughout multiple B-scans, but this process may result extremely time-consuming. Projection artifacts may affect the visualization of the deeper vascular layers (DCP, and CC). In order to image the deeper structures, the OCT beam passes through the retinal layers, and vessels included in these layers may be falsely detected in the deeper layers, even in the absence of real flow in these slabs [23]. Since the transmitted light diffuses through flowing blood, the deeper layers are thus reached by fluctuating light which can create a decorrelation between two successive B-scans at the same location. The projection artifact may also occur at high reflective layers, such as the RPE. In addition, projection artifacts from the retina are attenuated by the RPE, thereby limiting this confounding problem in the choroid. Several strategies have been evolved to limit projection artifacts.
11
However, unintentional removal of real blood flow can represent a relevant limit of this strategy.
Shadowing artifact represents another important artifact in the visualization of the deeper vascular layers. This artifact occurs when OCT beam is attenuated or blocked thereby impeding its passage to deeper layers. This may occur due to the presence of different structures, including vitreous opacities, hemorrhage, drusen. SS-OCTA systems have partially overcome this limitation, since a longer wavelength limits attenuation from media opacities and improves penetration into the deeper retinal and choroidal layers [24]. OCTA is still limited in the visualization of the larger vessels of the choroid. This limitation is secondary to the signal attenuation due to scattering by the RPE and by the CC vessels. In consequence of this, choroidal vessels may be typically displayed as silhouettes with complete loss of signal at greater depths. These limitations have been partially resolved with ultrahigh-speed SS-OCTA instruments. Noteworthy, such device was demonstrated to be even better than ICGA in the visualization of the medium-sized choroidal vessels [23].
OCTA quantitative metrics
Various different commercial devices use different algorithms to obtain OCTA images andquantifiable metrics applied to these images were demonstrated to be not comparable between devices. However, different studies have used quantitative variables to quantify the retinal and choroidal vasculature with OCTA [25, 26].
OCTA en face images are composed of pixels which may be in a grayscale range of
possible values from 0 to 255, where typically 0 is taken to be black, and 255 is taken to be white. In order to obtain quantitative analysis, a threshold may be applied to these images. Thresholding is used to create binary images (in which pixels over the applied threshold are displayed as white and pixels falling under the threshold are shown as black) from grayscale images. Moreover, thresholding may be obtained using different methodologies
that were demonstrated to significantly influence the final quantification. The binarized OCTA images may be also skeletonized, in order to obtain an image in which vessels are visualized as tracings of 1 pixel in width.
Binarized and skeletonized OCTA images may be used to provide different quantitative metrics (Figure 3). The perfusion density can be calculated as a unitless proportion of the number of pixels over the threshold divided by the total number of pixels in the analyzed area on the binarized image. The vessel length density is defined as the total length of the perfused vasculature divided by the total number of pixels in the analyzed area on the skeletonized image.
permits to examine different vascular parameters such as perfusion density (PD) and vessel length density (VLD) of the superficial capillary plexus (SCP), the deep retinal capillary plexuses (DCP) and the choriocapillaris plexus (CCP). In detail, PD reflects a
two-dimensional quantification of the retinal vasculature (length) and perfusion density; VLD a two-dimensional (length and width) measure thus a decrease of PD could be either a reduction of retinal vessel caliper or a decrease in branching patterns.
Clinical adoption of small field optical coherence tomography (OCT) angiography (OCTA) has provided clinicians with a noninvasive, volumetric modality for visualizing the retinal vasculature at micrometer resolutions. Critical to these assessments is the ability to accurately differentiate retinal arteries and veins in order to determine the location of vascular pathology. Furthermore, since the contrast between the retinal vessels and surrounding tissue is high, small field OCTA permits the quantitative analysis of retinal vascular changes [27].
Small field devices have a wavelengths for light sources of 840 nm.
Several types of their softwares identify blood flow by calculating the decorrelation of signal amplitude from consecutive B-scans performed at the same retinal acquisition plane by splitting the spectrum, improving the signal-to-noise-ratio, and enhancing flow
detection, using the Split Spectrum Amplitude Decorrelation Angiography (SSADA) algorithm [28].
Other devices work using the OMAG algorithm, which generates three-dimensional, microscopic resolution structural images and vasculature images by identifying differences in the scattered light due to movements of red blood cells in the vessels, between
consecutive B-scans at the same transversal location.
A limitation of the previous mentioned small field OCTA technology, however, is the limited scanning area which could be of 3x3 mm (Figure 4) or 6x6 mm (Figure 5), not very useful to investigate pathologies which interest peripheral retinal vascularization.
17
as idiopathic ERM (iERM) when no cause can be found. Importantly, iERM aetiology is still unclear, although seems to be related to an anomalous posterior vitreous detachment (PVD) [35, 36]. Some pathophysiological theories of iERM formation support a glial tissue origin. It has been suggested that after the onset of PVD, retinal glial cells deriving from Müller cells or astrocytes, proliferate and migrate, resulting in the fibrocellular tissue formation characterizing the scaffold of ERM recently formed. Fibroblasts and the
myofibroblasts, which are supposed to derive from Müller's cells, hyalocytes or retinal pigment epithelium (EPR), are the most represented cells of the most advanced ERM stages characterized from a rich tractional component.
Idiopathic ERM is still a frequent cause of visual impairment in working age population, due to traction of the membrane leading to the formation of retinal folds and consequently retinal thickening [32, 35].
Epidemiology
The prevalence of ERM is around 7-11.8 % with an age-related increasing trend. It is rare before the age of 60 (1.9 %) whereas the higher spike is over the age of 70 (11.6%). Up to 20 % of people with ERM is affected bilaterally [34]. Previous publications showed that ethnicity affects plays a role in the development of ERM. Particularly, the Chinese population has a higher prevalence (39%) compared to Caucasian (27.5) and Japanese (4%) [33].
Clinical Features
The ERM is a chronic disease and its clinical manifestation can be variable according to the severity of the disease. The heterogeneity of symptoms includes deterioration of the visual acuity and metamorphopsia; less frequently photopsia and macropsia can occur. At the fundoscopy ERMs appear as a thin translucent sheet, usually associated with retinal folds. Although the clinical aspect is usually sufficient for the diagnosis of ERM, optical
The recent development of SS-OCTA, thanks to use of a longer wavelength and a higher speed, allows a wider retinal field of view of superficial capillary plexus (SCP), deep capillary plexus (DCP) and choriocapillaris (CC) and a better visualization of deep layers such as CC and choroid [41].
The goal of this study was to report very early SCP vascular changes following idiopathic epiretinal membrane surgery using a widefield SS-OCTA device. Notably, these changes were determined in two different macular regions comparing the preoperative and post-operative vascular modifications.
Methods
Study participants
In this observational cross-sectional study, 24 subjects with a unilateral idiopathic ERM were enrolled at the Ophthalmology Clinic of University G. d’Annunzio, Chieti-Pescara, Italy. Twenty-four eyes of healthy people were considered as controls. The study was approved by our Institutional Review Board (IRB) (Department of Medicine and Science of Ageing, University G. d'Annunzio Chieti-Pescara) and adhered to the tenets of the Declaration of Helsinki. An IRB approved informed consent was obtained from all patients. All subjects with iERM underwent 25 G pars plana vitrectomy with ERM and internal limiting membrane (ILM) peeling and were imaged with the PLEX Elite 9000 device (Carl Zeiss Meditec Inc., Dublin, CA, USA) between January 2018 and January 2019. Moreover, all patients received a complete ophthalmologic examination, which included the measurement of best corrected visual acuity (BCVA), intraocular pressure (IOP) and ophthalmological evaluation. Inclusion criteria were: (i) diagnosis of iERM (3 stage, according to Govetto classification system [40]), (ii) no history of previous ocular surgery, (iii) iERM duration ≤ 6 years. Exclusion criteria were: (i) evidence or history of ocular conditions such as retinal detachment, retinal vascular occlusions, uveitis, high
21
myopia, trauma; (ii) evidence or history of systemic disorders, including diabetes and systemic hypertension; (iii) poor image quality.
Image acquisition
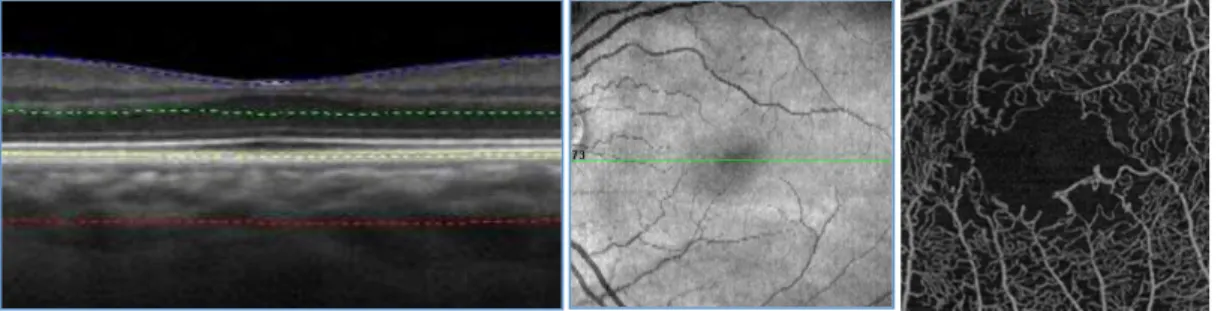
Subjects underwent OCTA imaging using the PLEX Elite 9000 device (Carl Zeiss Meditec Inc., Dublin, CA, USA) which uses a swept laser source with a central wavelength of 1050 nm (1000–1100 nm full bandwidth) and operates at 100,000 A-scans per second. For each eye, five 6x6 -mm OCTA volume scans were acquired by two independent graders (RM and RDA), preoperatively and at 1 month after surgery. FastTrac motion correction software was used while the images were acquired.
Poor quality images (signal strength index (SSI)<8) with either significant motion artifact or incorrect segmentation were excluded. All selected images were carefully visualized by the two retinal specialists independently to ascertain the correctness of segmentation and in case of erroneous recognition by the software of the position of the boundaries of the ILM and retinal pigment epithelium (RPE) manual correction was performed using the
segmentation and propagation editing tool from the device.
Image processing
The main outcome measures were: (i) SCP perfusion density (PD); (ii) SCP vessel length density (VLD); (iii) SCP vessel diameter index (VDI); (iv) SCP vessel tortuosity (VT). In order to quantify these variables, a slightly modified previously reported semi-automated algorithm was employed [22-23]. In brief, for each eye, en face OCTA images segmented at the SCP level were imported into ImageJ software version 1.50 (National Institutes of Health, Bethesda, MD; available at http://rsb.info.nih.gov/ij/index.html) and, consequently were processed with a ‘‘top-hat’’ filter. Each image was duplicated and two different binarizarion methods were then performed on the 2 resultant images: (i) 1 image was first processed by a ‘‘hessian’’ filter, followed by global thresholding using the ‘‘Huang’s
test was applied for assessing the comparison of the quantitative variables between baseline values and 1-month follow-up measurements.
Lin’s concordance correlation coefficient (CCC) with the 95% confidence intervals was calculated to assess the interobserver reproducibility of image acquisition.
Spearman’s Rho correlation coefficient was applied to evaluate the linear correlation among CMT and retinal perfusion variables in iERM patients group.
All statistical analyses were performed using R Statistical Software (version 3.5.3; R Foundation for Statistical Computing, Vienna, Austria). In all statistical tests the threshold of statistical significance was assumed equal to p=0.05.
Results
Characteristics of diseased and healthy eyes at the baseline
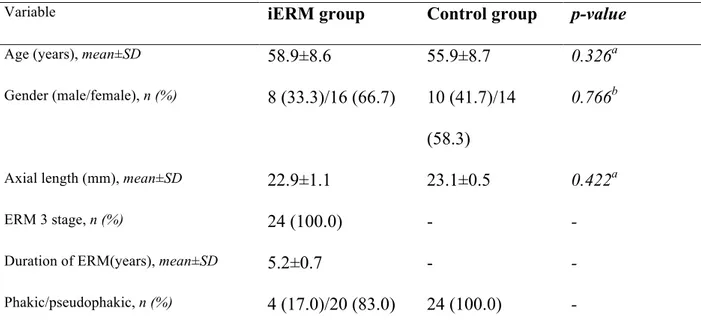
A total of 24 eyes of 24 people (16 females, 8 males; mean age of 58.9±8.6 years) with a diagnosis of 3-stage iERM were considered in the analysis. Clinical and demographic characteristics of diseased eyes enrolled are reported in Table 1.
25
Table 1. The clinical and demographics characteristics of diseased eyes (iERM group) and healthy eyes (control group). a Mann-Whitney U test; b Pearson chi-square test
A group of 24 healthy eyes of 24 subject were considered as controls (14 females, 10 males; mean age of 55.9±8.7 years). No statistically significant difference was found between diseased and normal eyes in terms of age, gender and axial length (Table 1). The central macula thickness (CMT) and average logMAR BCVA of iERM group were 512.3±23.4 µm at baseline and 0.78 ± 0.38 LogMAR (Snellen 20/121 equivalent) at baseline respectively (Table 2).
Table 2. Anatomical and functional parameters of healthy (control group) and diseased eyes (iERM group)
At
Variable iERM group Control group p-value
Age (years), mean±SD 58.9±8.6 55.9±8.7 0.326a
Gender (male/female), n (%) 8 (33.3)/16 (66.7) 10 (41.7)/14
(58.3)
0.766b
Axial length (mm), mean±SD 22.9±1.1 23.1±0.5 0.422a
ERM 3 stage, n (%) 24 (100.0) - -
Duration of ERM(years), mean±SD 5.2±0.7 - -
Phakic/pseudophakic, n (%) 4 (17.0)/20 (83.0) 24 (100.0) -
Variable
iERM Group Control Group
Baseline 1-‐‑ month Wilcoxon
p-‐‑value
Baseline Wilcoxon
p-‐‑value
CMT (µμm ) 512.3±23.4 374.5±31.7 <0.001 185.9±12.9 <0.001
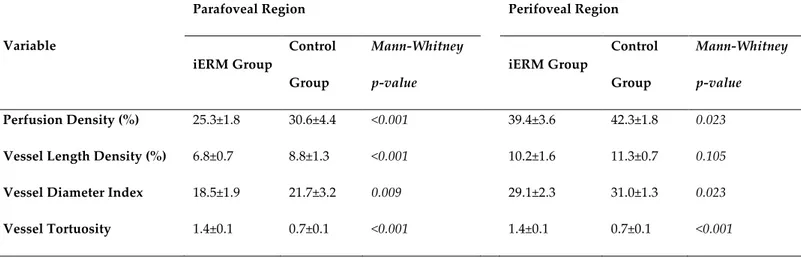
OCTA analysis statistically significant differences were found between controls and diseased eyes for all perfusion parameters in both parafoveal and perifoveal regions except for perifoveal VLD (Table 3).
Table 3. SCP analysis of parafoveal and perifoveal region at baseline of iERM and healthy groups
Variable
Parafoveal Region Perifoveal Region
iERM Group Control Group Mann-‐‑Whitney p-‐‑value iERM Group Control Group Mann-‐‑Whitney p-‐‑value Perfusion Density (%) 25.3±1.8 30.6±4.4 <0.001 39.4±3.6 42.3±1.8 0.023
Vessel Length Density (%) 6.8±0.7 8.8±1.3 <0.001 10.2±1.6 11.3±0.7 0.105
Vessel Diameter Index 18.5±1.9 21.7±3.2 0.009 29.1±2.3 31.0±1.3 0.023
Vessel Tortuosity 1.4±0.1 0.7±0.1 <0.001 1.4±0.1 0.7±0.1 <0.001
Comparison between pre-operative and post-operative morphological and functional parameters of diseased eyes
The logMAR BCVA of iERM group improved to 0.53±0.34 LogMAR (Snellen 20/68 equivalent) at 1 month after surgical treatment (Table 2).
CMT significantly decreased in iERM eyes at 1-month follow-up visit (374.5±31.7 micron, p<0.001), in comparison with preoperative values (Table 2).
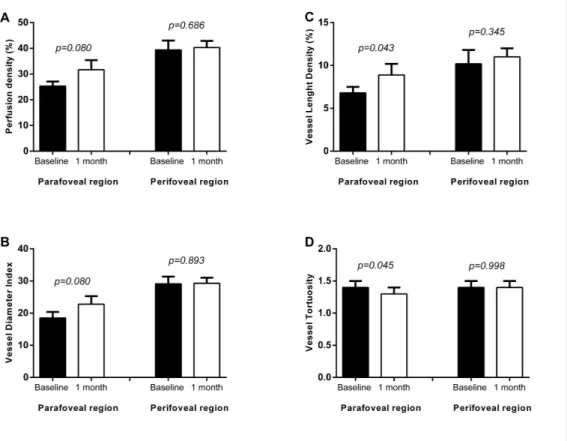
At OCTA analysis outcome measures of both groups were compared at baseline and 1 month after surgery. As shown in figure 3, at 1-month follow-up, VLD significantly increased from 6.8±0.7% to 8.9±1.3% in parafoveal region (p=0.043). Additionally, PD and VDI showed a trend of increase after vitrectomy in both parafoveal and perifoveal region (Figure 11).
27
Figure 11. Mean and standard deviation of retinal perfusion variables in iERM patients group at baseline and at 1-month follow-up after vitreoretinal surgery: (A) Perfusion Density (%); (B) Vessel Diameter Index; (C) Vessel Length Density (%); (D) Vessel Tortuosity. p-value reported in figure are relative to comparison between baseline and 1 months value evaluated by Wilcoxon test.
On the contrary, no statistically significant difference was observed in terms of PD and VLD before and after surgery in perifoveal region (p=0.686 and p=0.345 respectively, Figure 11).
In the analysis investigating the parafoveal region, we also found a significant decrease in VT from 1.4±0.1 to 1.3±0.1 at 1 month postoperatively (p=0.045). However, no significant VT changes in perifoveal region were observed (preoperative: 1.4±0.2 vs. postoperative: 1.4±0.1; p=0.998; Figure 11).
In the iERM group, no significant correlations were found between anatomical and functional parameters except for the vessel tortuosity that was significantly positively
associated with CMT (Rho=0.564 and p=0.021). The agreement between the two observers was excellent with a Lin’s CCC of 0.99 (95% CI: 0.98-0.99) in all analyzed parameters.
Discussion
It has been hypothesized that Müller cells play a main role in the pathological mechanism of ERM formation and in the support of foveolar structure. Their strong adhesion with ILM has been associated with a higher risk of ultrastructural damages of deep portions of the retina after peeling [43].
It has been widely reported a macular contraction and retinal vessel displacement in patients with a diagnosis of ERM due to tangential and centripetal forces exerted from ERM itself [40].
Tangential and vertical macular tractions are considered responsible of foveal
microarchitectural changes in the retinal vasculature with vessel occlusion and tortuosity [44].
The tangential force would drag the superficial retinal layers away from their original location thus straightening or curling retinal vessel of superficial capillary plexus.
ERM removal should release all tractions, thus letting main retinal vessels and capillaries come back to their original position. However some forces of traction could persist also after vitrectomy.
In addition ILM peeling procedure has been considered to be responsible of increased elasticity of the retina thus causing a foveal displacement of capillaries [45].
Kumagai et al described a centripetal movement of the inner retinal layer after ILM peeling with a centripetal shift of foveal capillaries [46]. Furthermore, authors reported changes in ganglion cell complex, where SCP is located, with its thickness reduction, due to a partial structural restoration after ILM peeling surgery and a likely disruption of the ganglion cell neurites included in the iERM [47].
29
The non-invasive nature of OCTA techniques has progressively and quickly gained much interest in clinical practice. OCTA is rapidly becoming a new important imaging modality for the retina/choroid, optic nerve head and even the anterior segment. It has shown a high reliability in perfusion assessment of the superficial retinal vasculature [48].
As already known, retinal vasculature is composed by three plexuses: the superficial, the intermediate and the deep capillary plexus. In detail, the superficial capillary plexus, located in the ganglion cell layer and nerve fiber layer, is characterized by a centripetal pattern vessel; while the vessels of deep capillary plexus, that is located in the inner nuclear layers, have typically a concentric distribution with vertical interconnections [49]. The recently introduced widefield SS-OCTA is able to provide quantitative and qualitative information of microvasculature of all three retinal capillary plexuses in central area and in midperiphery.
SS-OCTA uses tunable laser centered at 1060 nm and with at a scan speed of 100,000 A scans per second and an axial resolution of 6.3 µm. This device is based on optical micro angiography complex algorithm to analyse retinal microvasculature in detail and in depth. We aimed at evaluating retinal microvasculature parameters of superficial capillary plexus of a 6x6 mm scan area to identify early vascular changes at baseline and after vitrectomy with ILM peeling in terms of parafoveal and perifoveal retinal perfusion using SS-OCTA. In detail, at SCP level, PD, VDI, VLD and TV were investigated. We decided to focus only on the supeficial plexus in order to avoid ERM related projection artefacts. Indeed, traction of ERM and macular edema may alter OCTA signal quality of deep capillary plexus status. Although artefacts can be corrected with projection removal algorithms, OCTA remains susceptible to projection artefacts because of the superficial blood flow, thus leading a difficult interpretation of deep retinal vasculature feature with a potential loss of details.
Furthermore, ERM with rich intraretinal fluid component weakens the reflected OCTA signal intensity from deeper layers [50].
In our cohort we included only ERM of 3 stage to eliminate possible bias related to different severity of the disease. In addition we considered patients with a similar duration of ERM diagnosis that was a mean of ≤ 5.2±0.7 years.
A significant reduction in capillary blood flow velocity of iERM patients was observed using fluorescein angiography if compared with healthy age-matched eyes probably due to increase of venous resistance caused by vessel abnormalities [44, 51].
Six months after vitrectomy a statistically significant improvement in blood flow velocity was reported by the authors, related to capillary vessel recanalization [44, 51].
In our cohort, PD and VLD in iERM group were significantly different if compared to the control group likely due to a centripetal movement of microvessels exerted from traction with central vessel crowding. It can be hypothesized that partial capillary sub- /occlusion occurred related to ERM presence thus causing flow impairment in the foveal region [44]. Conversely, Nelis and coworkers [52] found a significant increase of the macular vessel density ratio (vessel density of the foveal and parafoveal region) of MER eyes in
comparison to healthy controls, that presumably reflected a vascular displacement from the perifoveal to the foveal area without a significant vessel occlusion component.
The degree of perifoveal hemodynamic changes is strictly associated with severity of ERM and depth and duration of traction, for this reason we preferred to evaluate eyes with the same ERM grade and with a duration of ≤ 6 years from the first diagnosis.
At 1-month post surgery although a trend of increase was observed, overall macular PD of iERM group not show any significant difference compared to preoperative values, both in perifoveal and parafoveal areas, probably because of the recanalization of occlused microvessels contemporaneously with the decrease of central vessel crowding toward perifovea.
31
On the contrary, parafoveal VLD significantly increased at 1-month follow-up. The vessel length density increase was likely due to a reopening of little vessels that were
sub-occlused in the preoperative period because of ERM traction release.
We speculate that forces exerted from ERMs could have a greater impact on tiny little vessels leading to a temporary sub-/occlusion of them. After vitrectomy these capillaries would open again due to the release of tractions as well as a recovery to the vessel original positions. Dell’Omo et al [53] have previously described as, after vitreoretinal surgery for retinal detachment, vessels seen with autofluorescence did not come back to their original position, on the contrary they would assume a new position.
Our results showed an initial increase in vessel diameter in both parafoveal and perifoveal regions because of the reopening and recanalization of microvessels, thus OCTA signal would consider also diameter of reopened smaller vessels in the overall analysis. Finally, our work investigated vascular tortuosity and it appears to be the first study describing this parameter in patients with iERMs using SS-OCTA.
A relatively recent study [53] has identified VT detected with OCTA as a useful
quantitative measure correlated to diabetic retinopathy (DR) stage. It has been reported that a higher VT is associated with a higher progression to proliferative diabetic retinopathy. Therefore VT seems to be an early indicator of microvascular damages in the retina and a quantitative marker to monitor the progression of DR [54].
In our work VT showed a statistically significant decrease postoperatively compared to preoperative values only in the parafoveal area. The latter region is probably mainly involved in the early modifications of VT recovery after surgery. Perifoveal area would need more time to a complete anatomical recovery. Although surgical treatment partially resolves tangential and vertical retinal tractions, thus improving macular microcirculation thanks to recanalization of capillary vessels, some tractional effects may persist also after surgery, explaining no significant change of perifoveal VT.
To the best of our knowledge this is the first study that analyses in detail retinal microvasculature features, quantifying contemporary perfusion and tortuosity as an elaboration of a single scan acquisition.
The comprehension of early changes of retinal circulation could be predictive of macular status at baseline and of macular morphology and function after surgery.
With further advancement in imaging technology, OCTA may serve as an alternative non-invasive device to the traditional fluorescein angiography in order to better identify ERM features and to predict visual prognosis after surgery.
In terms of functional changes, our findings showed a significant improvement in terms of visual outcome and CMT postoperatively, one month after surgery.
Our results suggest a relationship between early changes of capillary architecture after vitrectomy and postoperative retinal function in iERM patients. This issue could be helpful to better identify the pathophysiology of the disease, and to assess morphological markers (vascular) that could be helpful to predict the postoperative outcome.
The main limitation of this study is the relatively small sample and the cross sectional nature of analysis. The follow up was very small, nevertheless we wanted to focus
intentionally on early changes after surgery to identify predictive flow modifications of the macula over time. A longer follow up of the same parameters assessed with the same new swept source device is needed to possibly predict a prognosis of the final anatomical and functional success, by analyzing and following depth-selectively vessel behavior pre and postoperatively
33 References
1. Selvam, S., T. Kumar, and M. Fruttiger, Retinal vasculature development in health
and disease. Prog Retin Eye Res, 2018. 63: p. 1-19.
2. Zhu, Q., et al., A New Approach for the Segmentation of Three Distinct Retinal
Capillary Plexuses Using Optical Coherence Tomography Angiography. Transl Vis Sci
Technol, 2019. 8(3): p. 57.
3. Mase, T., et al., Radial Peripapillary Capillary Network Visualized Using
Wide-Field Montage Optical Coherence Tomography Angiography. Invest Ophthalmol Vis Sci,
2016. 57(9): p. Oct504-10.
4. Jia, Y., et al., Wide-Field OCT Angiography Investigation of the Relationship
Between Radial Peripapillary Capillary Plexus Density and Nerve Fiber Layer Thickness.
Invest Ophthalmol Vis Sci, 2017. 58(12): p. 5188-5194.
5. Adhi, M., et al., Characterization of Choroidal Layers in Normal Aging Eyes Using
Enface Swept-Source Optical Coherence Tomography. PLoS One, 2015. 10(7): p.
e0133080.
6. Mastropasqua, R., et al., Foveal avascular zone area and parafoveal vessel density
measurements in different stages of diabetic retinopathy by optical coherence tomography angiography. Int J Ophthalmol, 2017. 10(10): p. 1545-1551.
7. Borrelli, E., et al., In Vivo Mapping of the Choriocapillaris in Healthy Eyes: A
Widefield Swept-Source OCT Angiography Study. Ophthalmol Retina, 2019. 3(11): p.
979-984.
8. Borrelli, E., et al., OCT angiography and evaluation of the choroid and choroidal
vascular disorders. Prog Retin Eye Res, 2018. 67: p. 30-55.
9. Mastropasqua, L., et al., OPTICAL COHERENCE TOMOGRAPHY
AFLIBERCEPT INTRAVITREAL INJECTIONS IN TREATMENT-NAIVE PATIENTS WITH WET AGE-RELATED MACULAR DEGENERATION. Retina, 2017. 37(2): p.
247-256.
10. Mastropasqua, R., et al., Reproducibility and repeatability of foveal avascular zone
area measurements using swept-source optical coherence tomography angiography in healthy subjects. Eur J Ophthalmol, 2017. 27(3): p. 336-341.
11. Carpineto, P., et al., Reproducibility and repeatability of foveal avascular zone
measurements in healthy subjects by optical coherence tomography angiography. Br J
Ophthalmol, 2016. 100(5): p. 671-6.
12. Mastropasqua, R., et al., Widefield optical coherence tomography angiography in
diabetic retinopathy. Acta Diabetol, 2019. 56(12): p. 1293-1303.
13. Lupidi, M., et al., Chronic Neovascular Central Serous Chorioretinopathy: A
Stress/Rest Optical Coherence Tomography Angiography Study. Am J Ophthalmol, 2019.
14. Cerquaglia, A., et al., New Insights On Ocular Sarcoidosis: An Optical Coherence
Tomography Angiography Study. Ocul Immunol Inflamm, 2019. 27(7): p. 1057-1066.
15. Coscas, G., et al., Optical Coherence Tomography Angiography in Healthy
Subjects and Diabetic Patients. Ophthalmologica, 2018. 239(2-3): p. 61-73.
16. Wei, X., et al., Real-time cross-sectional and en face OCT angiography guiding
high-quality scan acquisition. Opt Lett, 2019. 44(6): p. 1431-1434.
17. Moult, E., et al., Ultrahigh-speed swept-source OCT angiography in exudative
AMD. Ophthalmic Surg Lasers Imaging Retina, 2014. 45(6): p. 496-505.
18. Tan, A.C.S., et al., An overview of the clinical applications of optical coherence
tomography angiography. Eye (Lond), 2018. 32(2): p. 262-286.
19. Told, R., et al., Comparison of SD-Optical Coherence Tomography Angiography
and Indocyanine Green Angiography in Type 1 and 2 Neovascular Age-related Macular Degeneration. Invest Ophthalmol Vis Sci, 2018. 59(6): p. 2393-2400.
35
20. Tanaka, K., et al., Comparison of OCT angiography and indocyanine green
angiographic findings with subtypes of polypoidal choroidal vasculopathy. Br J
Ophthalmol, 2017. 101(1): p. 51-55.
21. Spaide, R.F., J.G. Fujimoto, and N.K. Waheed, IMAGE ARTIFACTS IN OPTICAL
COHERENCE TOMOGRAPHY ANGIOGRAPHY. Retina, 2015. 35(11): p. 2163-80.
22. De Pretto, L.R., et al., Controlling for Artifacts in Widefield Optical Coherence
Tomography Angiography Measurements of Non-Perfusion Area. Sci Rep, 2019. 9(1): p.
9096.
23. Enders, C., et al., Quantity and quality of image artifacts in optical coherence
tomography angiography. PLoS One, 2019. 14(1): p. e0210505.
24. Ghasemi Falavarjani, K., et al., Image artefacts in swept-source optical coherence
tomography angiography. Br J Ophthalmol, 2017. 101(5): p. 564-568.
25. Lim, H.B., et al., The Importance of Signal Strength in Quantitative Assessment of
Retinal Vessel Density Using Optical Coherence Tomography Angiography. Sci Rep,
2018. 8(1): p. 12897.
26. Chu, Z., et al., Quantitative assessment of the retinal microvasculature using
optical coherence tomography angiography. J Biomed Opt, 2016. 21(6): p. 66008.
27. Durbin, M.K., et al., Quantification of Retinal Microvascular Density in Optical
Coherence Tomographic Angiography Images in Diabetic Retinopathy. JAMA
Ophthalmol, 2017. 135(4): p. 370-376.
28. Hirano, T., et al., Quantifying vascular density and morphology using different
swept-source optical coherence tomography angiographic scan patterns in diabetic retinopathy. Br J Ophthalmol, 2019. 103(2): p. 216-221.
29. Hirano, T., et al., Wide-field en face swept-source optical coherence tomography
angiography using extended field imaging in diabetic retinopathy. Br J Ophthalmol, 2018.
30. Novais, E.A., et al., Choroidal Neovascularization Analyzed on Ultrahigh-Speed
Swept-Source Optical Coherence Tomography Angiography Compared to Spectral-Domain Optical Coherence Tomography Angiography. Am J Ophthalmol, 2016. 164: p.
80-8.
31. Miller, A.R., et al., Comparison Between Spectral-Domain and Swept-Source
Optical Coherence Tomography Angiographic Imaging of Choroidal Neovascularization.
Invest Ophthalmol Vis Sci, 2017. 58(3): p. 1499-1505.
32. Inoue, M. and K. Kadonosono, Macular diseases: epiretinal membrane. Dev Ophthalmol, 2014. 54: p. 159-63.
33. Miyazaki, M., et al., Prevalence and risk factors for epiretinal membranes in a
Japanese population: the Hisayama study. Graefes Arch Clin Exp Ophthalmol, 2003.
241(8): p. 642-6.
34. McCarty, D.J., et al., Prevalence and associations of epiretinal membranes in the
visual impairment project. Am J Ophthalmol, 2005. 140(2): p. 288-94.
35. Smiddy, W.E., et al., Idiopathic epiretinal membranes. Ultrastructural
characteristics and clinicopathologic correlation. Ophthalmology, 1989. 96(6): p. 811-20;
discussion 821.
36. Kishi, S. and K. Shimizu, Oval defect in detached posterior hyaloid membrane in
idiopathic preretinal macular fibrosis. Am J Ophthalmol, 1994. 118(4): p. 451-6.
37. Carpineto, P., et al., EPIRETINAL MEMBRANE IN EYES WITH
VITREOMACULAR TRACTION. Retina, 2019. 39(6): p. 1061-1065.
38. Toto, L., et al., RETINAL VASCULAR PLEXUSES' CHANGES IN DRY
AGE-RELATED MACULAR DEGENERATION, EVALUATED BY MEANS OF OPTICAL COHERENCE TOMOGRAPHY ANGIOGRAPHY. Retina, 2016. 36(8): p. 1566-72.
37
39. Toto, L., et al., Association between outer retinal alterations and microvascular
changes in intermediate stage age-related macular degeneration: an optical coherence tomography angiography study. Br J Ophthalmol, 2017. 101(6): p. 774-779.
40. Govetto, A., et al., Insights Into Epiretinal Membranes: Presence of Ectopic Inner
Foveal Layers and a New Optical Coherence Tomography Staging Scheme. Am J
Ophthalmol, 2017. 175: p. 99-113.
41. Schaal, K.B., et al., VASCULAR ABNORMALITIES IN DIABETIC RETINOPATHY
ASSESSED WITH SWEPT-SOURCE OPTICAL COHERENCE TOMOGRAPHY ANGIOGRAPHY WIDEFIELD IMAGING. Retina, 2019. 39(1): p. 79-87.
42. Lee, H., et al., QUANTIFICATION OF RETINAL VESSEL TORTUOSITY IN
DIABETIC RETINOPATHY USING OPTICAL COHERENCE TOMOGRAPHY ANGIOGRAPHY. Retina, 2018. 38(5): p. 976-985.
43. Romano, M.R., et al., Deep and superficial OCT angiography changes after
macular peeling: idiopathic vs diabetic epiretinal membranes. Graefes Arch Clin Exp
Ophthalmol, 2017. 255(4): p. 681-689.
44. Yagi, T., et al., Evaluation of perifoveal capillary blood flow velocity before and
after vitreous surgery for epiretinal membrane. Graefes Arch Clin Exp Ophthalmol, 2012.
250(3): p. 459-60.
45. Okawa, Y., et al., Foveal structure and vasculature in eyes with idiopathic
epiretinal membrane. PLoS One, 2019. 14(4): p. e0214881.
46. Kumagai, K., et al., FOVEAL AVASCULAR ZONE AREA AFTER INTERNAL
LIMITING MEMBRANE PEELING FOR EPIRETINAL MEMBRANE AND MACULAR HOLE COMPARED WITH THAT OF FELLOW EYES AND HEALTHY CONTROLS.
47. Pierro, L., et al., Role of ganglion cell complex in visual recovery following
surgical internal limiting membrane peeling. Graefes Arch Clin Exp Ophthalmol, 2015.
253(1): p. 37-45.
48. Lei, J., et al., Repeatability and Reproducibility of Superficial Macular Retinal
Vessel Density Measurements Using Optical Coherence Tomography Angiography En Face Images. JAMA Ophthalmol, 2017. 135(10): p. 1092-1098.
49. Spaide, R.F., J.M. Klancnik, Jr., and M.J. Cooney, Retinal vascular layers imaged
by fluorescein angiography and optical coherence tomography angiography. JAMA
Ophthalmol, 2015. 133(1): p. 45-50.
50. Zhang, Q., et al., Wide-field optical coherence tomography based
microangiography for retinal imaging. Sci Rep, 2016. 6: p. 22017.
51. Kadonosono, K., et al., Perifoveal microcirculation in eyes with epiretinal
membranes. Br J Ophthalmol, 1999. 83(12): p. 1329-31.
52. Nelis, P., et al., Quantification of changes in foveal capillary architecture caused
by idiopathic epiretinal membrane using OCT angiography. Graefes Arch Clin Exp
Ophthalmol, 2017. 255(7): p. 1319-1324.
53. dell'Omo, R., et al., Restoration of foveal thickness and architecture after
macula-off retinal detachment repair. Invest Ophthalmol Vis Sci, 2015. 56(2): p. 1040-50.
54. Sasongko, M.B., et al., Retinal vascular tortuosity in persons with diabetes and