MARCO ALBERTINI
Who were and who are the poorest and the richest
people in Italy
The changing household’s characteristics of the people at the bottom and at the top of the income distribution
Quaderno n. 31
Quaderni del
DIPARTIMENTO DI SOCIOLOGIA E RICERCA SOCIALE Università degli Studi di Trento
I Quaderni del Dipartimento di Sociologia e Ricerca Sociale costituiscono una iniziativa editoriale finalizzata alla tempestiva diffusione in ambito universitario di materiale di ricerca, riflessioni
teoriche e resoconti di seminari di studio di particolare rilevanza. L’accettazione dei diversi contributi
è subordinata all’approvazione di un’apposita Commissione scientifica, che si avvale del parere di
referees esterni al Dipartimento. Le richieste dei Quaderni vanno inviate ai rispettivi autori.
1. E. BAUMGARTNER, L’identità nel cambiamento, 1983.
2. C. SARACENO, Changing the Gender Structure of Family Organization, 1984.
3. G. SARCHIELLI, M. DEPOLO e G. AVEZZU’, Rappresentazioni del lavoro e identità sociale in un gruppo di lavoratori irregolari, 1984.
4. S. GHERARDI, A. STRATI (a cura di), Sviluppo e declino. La dimensione temporale nello studio delle organizzazioni, 1984.
5/6. A. STRATI (a cura di), The Symbolics of Skill, 1985.
7. G. CHIARI, Guida bibliografica alle tecniche di ricerca sociale, 1986.
8. M. DEPOLO, R. FASOL, F. FRACCAROLI, G. SARCHIELLI, L’azione negoziale, 1986. 9. C. SARACENO, Corso della vita e approccio biografico, 1986.
10. R. PORRO (a cura di), Le comunicazioni di massa, 1987.
11/12. G. CHIARI, P. PERI, I modelli log-lineari nella ricerca sociologica, 1987. 13. S. GHERARDI, B. TURNER, Real Men Don’t Collect Soft Data, 1987.
14. D. LA VALLE, Utilitarismo e teoria sociale: verso più efficaci indicatori del benessere, 1988. 15. M. BIANCHI, R. FASOL, Il sistema dei servizi in Italia. Parte prima: Servizi sanitari e cultura
del cambiamento. A dieci anni dalla riforma sanitaria. Parte seconda: Modelli di analisi e filoni di ricerca. 1988.
16. B. GRANCELLI, Le dita invisibili della mano visibile. Mercati, gerarchie e clan nella crisi dell’economia di comando, 1990.
17. H.M. A. SCHADEE, A. SCHIZZEROTTO, Social Mobility of Men and Women in Contemporary Italy, 1990.
18. J. ECHEVERRIA, I rapporti tra stato, società ed economia in America Latina, 1991.
19. D. LA VALLE, La società della scelta. Effetti del mutamento sociale sull’economia e la politica, 1991.
20. A. MELUCCI, L’Aids come costruzione sociale, 1992.
21. S. GHERARDI, A. STRATI (a cura di), Processi cognitivi dell’agire organizzativo: strumenti di analisi, 1994.
22. E. SCHNABL, Maschile e femminile. Immagini della differenza sessuale in una ricerca tra i giovani, 1994.
23. D. LA VALLE, La considerazione come strumento di regolazione sociale, 1995.
24. S. GHERARDI, R. HOLTI e D. NICOLINI, When Technological Innovation is not Enough. Understanding the Take up of Advanced Energy Technology, 1999.
25. D. DANNA, Cattivi costumi: le politiche sulla prostituzione nell’Unione Europea negli anni Novanta, 2001.
26. F. BERNARDI, T. POGGIO, Home-ownership and Social Inequality in Italy, 2002
27. B. GRANCELLI, I metodi della comparazione: Alcuni area studies e una rilettura del dibattito, 2002.
28. M.L. ZANIER, Identità politica e immagine dell’immigrazione straniera, una ricerca tra gli elettori e i militanti di An e Ds a Bologna, 2002.
29. D. NICOLINI, A. BRUNI, R. FASOL, Telemedicina: Una rassegna bibliografica introduttiva, 2003.
30. G. CHIARI, Cooperative Learning in Italian School: Learning and Democracy, 2003. 31. M. ALBERTINI, Who were and who are the poorest and the richest people in Italy
The changing household’s characteristics of the people at the bottom and at the top of the income distribution, 2004.
Dipartimento di Sociologia e Ricerca Sociale Università di Trento
Via Verdi 26 - I - 38100 Trento - Italia Tel. 0461/881322
Telex 400674 UNITN I Telefax 0461/881348 Web: www.soc.unitn.it/dsrs/
Contents
Introduction 5
1. The theoretical framework. The nexus between economy, family and individuals’ welfare 6 2. The changing household characteristics of individuals at the top and at the bottom 11
of the Italian income distribution
2.1. The changing household characteristics of individual in the richest quintile 12 2.2. The changing household characteristics of individual in the poorest quintile 17 3. The changes of the income risks according to family characteristics 23
4. Summary and discussion 32
Who were and who are the poorest and the richest people in Italy
The changing household’s characteristics of the people at the
bottom and at the top of the income distribution
Marco Albertini1
INTRODUCTION
During the last decades there has been a deep change in the structure of inequality in western societies. Many authors have underlined the increasing social fragmentation which results from the “dramatic” transformations of the labour market, the family and the welfare state (see for example: Crouch 1999; Esping-Andersen 1999; Martinelli, Chiesi, Stefanizzi 1999; Mingione 1991; Ranci 2002; Standing 1999). A great part of the most recent debate on poverty and social exclusion is about the changes in causes and characteristics of social vulnerability affecting individuals in contemporary societies. The risk structure of post industrial societies is very different from the structure of social risks on which it was built the post-war welfare state (Esping-Andersen 1999). As a consequence, both the distribution of risks across the society and the structure of inequality in contemporary societies are completely different from those found in the mid-century compromise societies.
New risks are affecting new people, therefore it might be expected that the demographic and economic characteristics of families, and of individuals, at the extremes of the income distribution have also changed. The change in the structure of inequality, indeed, should have led to remarkable differences between who are and who were the poorest and the richest people in the society. Aim of the paper is to explore how they have changed the household’s characteristics of the poorest and the richest people in Italy between the late 1970s and the year 2000; next, it will be also briefly analysed how it has changed the risk structure. The study of this topic appears to be particularly relevant in the Italian case; as a matter of fact, not only it is often stressed the great relevance of family in Italy in ensuring individuals against low-income risks (Guerrero and Naldini; 1996; Saraceno, 1997, Esping-Andersen, 1999; Bentolila and Ichino, 2000), but it has also been stressed that in Italy, more than in other countries, poverty regards families: less single individuals and childless couples and more families with children (Saraceno, 2002: xv).
The first section sets the scene for the rest of the paper; there it is briefly explored the nexus between family2 and the individuals’ welfare and income. In the following section I
explore how they have changed the household’s demographic and economic characteristics of the individuals at the top and at the bottom of the income distribution. The third section concentrates on the analysis of the data of two years only, 1977 and 2000. There, by adopting a very simple technique, I briefly explore how it is changed the distribution of low/high
1 Marco Albertini, European University Institute, Department of Political and Social Sciences, Via dei
Roccettini, 9 – 50016 San Domenico di Fiesole, Firenze. E.mail: [email protected].
Acknowledgements: various parts of this article have benefited from stimulating comments and critics from many people. Thanks are due to Colin Crouch, Jaap Dronkers, Chiara Saraceno and to some anonymous referees of the Department of Sociology and Social Research of the University of Trento. Finally, a special thanks to Antonio Chiesi for his interest in, and encouragement of, this research.
2 Here and in the following I will use, for convenience, the two concepts of “household” and of “family” as
synonymous. However, I am absolutely aware of the non coincidence of the two terms (about the discussion on the definition of the two concepts see for example: Goody 1972; Hammel and Laslett 1974; Laslett 1972 and 1977; Naldini and Saraceno 2001; Wall 1983).
income risks between individuals with different household’s characteristics3. Section IV
summarises and discusses the findings of the research.
1. The theoretical framework. The nexus between economy, family and individuals’ welfare
The nexus between household, work and economy has been strong and explicit all through the human history4. This relation was probably stronger, or at least more explicit, in the past pre-capitalistic societies than in contemporary societies. In agricultural societies, indeed, the family as the basic unit of reproduction very often coincided with the main unit of economic production. Furthermore, family, work and business were considered a continuum from a legislative point of view, too. However, this “perfect” coincidence between the household and the business organisation was disrupted, in western societies, by the change to modern capitalistic economy. As a matter of fact, in the passage from agricultural to modern capitalistic societies ‘household and occupation become ecologically separated, and the household is no longer a unit of common production but of common consumption’ (Weber, 1978: 375). In addition, it has to be stressed that -in modern capitalistic societies - not only the household and the unit of production are physically separated, but also they are separated from a legislative point of view (Weber, 1978)5.
The process of separation between family and the formal unit of production, and between the different criteria regulating the relations within these two institutions, continued all through the development of industrialised societies of the post-war period. However, this increasing separation between the two spheres of family and formal economy leads to an increasing demand for a solution of the potential conflict between the different criteria governing the two institutions. In the mid-century compromise societies the solution was founded in the “segregation” of some members of families; namely women. In these societies, indeed, a large majority of married women were excluded from the formal economy (Crouch,
3 Here is important to stress that: first, I only consider income net of interest and financial assets, thus the paper
regards only the income status of individuals and it does not look at the phenomena of economic vulnerability or social exclusion; second, I only consider household characteristics separately, thus I do not propose here a unique typology of family forms; third, I only consider how it has changed the composition of lower and upper strata of the population in terms of their household characteristics, as a consequence, I do not look at the phenomena of impoverishment and enrichment of families, neither I look at the change of the individuals’ average location in the distribution according to their family characteristics (the analysis of this latter phenomenon can be found in Albertini, 2003).
4 The Greek word oíkos, from which it comes the word economy, means house/household.
5 ‘Whereas, originally, the personal funds and the business organisation were regulated by the same set of rules,
the situation gradually changed. Continuous capitalist acquisition became a special vocation performed in an increasingly separate enterprise. An autonomous rational association emerged out of the social action of the household (…) First, the household ceased to exist as a necessary basis of rational business association. Henceforth, the partner was not necessarily – or typically – a house member. Consequently, business assets had to be separated from the private property of the partners. Similarly, a distinction began to be made between the business employees and the domestic servants. […] This whole development is obviously a precise parallel to the separation of the bureaucratic office as a “vocation” from private life, the “bureau” from the private household, the official assets and liabilities from private property, and the official dealings from private dealings […] The capitalist enterprise, created by the household which eventually retreats from it, thus is related from the very beginning to the “bureau” and the now obvious bureaucratisation of the private economy. But the factor of decisive importance in this development is not the spatial differentiation or separation of the household from the work-shop and the store. What is crucial is the separation of household and business for accounting and legal purposes, and the development of a suitable body of laws, such as the commercial register, elimination of dependence of the association and the firm upon the family, separate property of the private firm or limited partnership and appropriate laws on bankruptcy […] This is one of the many phenomena characterizing most clearly the qualitative uniqueness of the development of modern capitalism’ (Weber, 1978: 379).
1999)6. Nevertheless, it should be noted that, to a lesser extent, the segregation from the formal economy regarded other family members, too. As a matter of fact, young people were involved in longer periods of training and, consequently, there were more people depending on their families and for longer periods. Moreover, it should be noted that – because of the increasing separation between family and the formal economy, and because of the developing of a growing number of institutions separated from the family – with the emergence of the industrial urban family the ‘family began to be less important institutions for their members, as not only the world of work opened up new possibilities of activities remoter from family control, but the general range of social institutions both increased in number and in their mutual separation’ (Crouch, 1999: 23).
In the most recent development from mid-century compromise societies to post industrial societies the relationship between family, work and economy has changed again. While, on the one hand, the spheres of household and of the formal economy – also from a legislative point of view – has remained separated, on the other hand, it has to be noted that the principle of segregation of women from the formal economy has been abandoned. In the post industrial (western) societies the female participation in paid work has remarkably increased. However, it has to be noted that – as it has been argued by Crouch (1999) – this latter change has led to a new type of women segregation. Sectors of activities and types of occupation are very differentiated between men and women, indeed; it seems that the segregation of women has shifted from home to the work place7. The increasing participation of women into the (paid) labour market has also implied that a growing part of unpaid work (such as child rearing, caring for the elderly people, cooking, etc.) – which, usually, was performed within the household by women – has been increasingly de-familialized and commodified (Esping-Andersen 1999)8. It is for this reason that the passage from mid-century compromise societies to post industrial societies can be seen as a further step in the process of separation between family and formal economy. When formerly domestic tasks are taken out
6 ‘A potential conflict between the criteria governing the formal economy and those governing another
institution, in this case the family, is in the ideal type of the mid-century social compromise resolved by a segregation rule, by specialisation and by specificity. Mid-century society, with its emphasis on the efficient pursuit of industrialism alongside the liberal principle of leaving separate spheres to themselves, requires institutions that keep family and work apart. The world of the family needs to be kept separate from that of formally defined work, partly because many of the rules that govern the two are different. For example, family members are not expected to calculate their relations with each other in strict exchange terms as they would do in business relations, buying and selling, but on the basis of the diffuse, affective ties that we usually call ‘love’ […] an important segregation of work and family was gradually achieved in industrial societies by the withdrawal of all but a tiny number of married women from the workplace. […] In this way the rules of family, rooted in affective ties, and those of work rooted in calculated exchange, could be separated and protected from one another through the work, behaviour, and indeed expected character traits of the two genders’ (Crouch, 1999:53-54).
7 ‘In some respects the post-industrial development can be seen as a break with the segregation of genders
characteristic of the mid-century social compromise, confirming hypotheses that post-industrialism transcends that society. Seen differently, however, it is simply taking that segregation in new directions. Much service activity as defined here is of a household replacing kind: caring and domestic activities that might be carried on within the home by family members are moved into the formal occupational sphere. In this sense, the process of moving work away from the family, central to the social compromise, is continued and indeed taken to new heights in post-industrial society. Also, while there is a kind of breach with mid-century principles in the increase in female participation in paid work, women are overwhelmingly represented in that part of the remunerated workforce that carries out the caring and formerly domestic tasks – the segregations of the social compromise are reproduced but at a different institutional location. In that sense, we are seeing, not a transcendence of mid-century principles of social organization but their extension – an extension that requires some reorganization of the gender division of labour and the position of the family’ (Crouch, 1999: 67).
8 However, it should be noted that a considerable number of time budget studies seem to indicate that, in
particular in southern European societies, women entered into the labour market “at their own cost”. A relevant part of unpaid work carried out by women has not been commodified (both because it is not possible to commodified some type of works and because it is too expensive). Thus, generally speaking, the amount of unpaid domestic work carried out by women has diminished, but women are still in charge of the larger part of unpaid domestic and caring activities.
from the boundaries of the household, it seems that what remains inside is mainly the emotional sphere. Wives, being increasingly included in the formal (paid) labour market, become less dependent on the wages of their husbands. But also family members, being previous intra-household unpaid work increasingly commodified, become more (economically) independent of the family itself. Hence, it seems that while the economic relations between household members decrease in their importance, the rules that regulate relations within family increasingly refers to affective ties between family members. Nonetheless, it is important to stress that, also in post industrial societies, family remains (both from a formal and an informal point of view) the main economic unit of aggregation of resources. Thus, the contemporary household ‘cannot be dismissed as an haven of intimacy and consumption. It is an all-important actor whose decisions and behaviour directly influence, and are influenced by, the welfare state and the labour market’ (Esping Andersen, 1999: 35). As a consequence, even after the formal separation of family and business, and after the decommodification of a large part of previous intra-household unpaid work, family does remain an important actor influencing formal economy9 and, more in general, individuals’ welfare and economic well-being.
To sum up, all along the human history an indissoluble connection between family, work and economy has existed. The economic dimension of the family is, in Weber’s view, the prerequisite to the social action of the family’s members; from this point of view it is also the prerequisite of the household as an institution (Weber, 1978)10. It has also been argued that the family itself works following (or at least it can be understood as an institution which follows) the same criteria as those regulating the modern capitalistic organizations and their relationships: maximising behaviour; stable preferences; and equilibrium in implicit and explicit markets (Becker, 1981). Moreover, the economic role of the family has been identified as the main explanatory factor of the stability and the strength of the relationships between family members (Becker, 1981; Weber, 1978)11.
The close link between household, work and economy implies that families play a relevant role in the determination of individuals’ welfare and, in general, in the process of income (re)distribution. Schematising, three main institutional actors responsible for (re)distributing resources between individuals can be identified: the state, the market and the household12. These three institutions, hence, strongly affect the adequacy, the stability and the
9 As an example, concerning the relation between family and work, Naldini and Saraceno (2001) have stressed
that the “work-family system” (Pleck, 1977), can be analysed according to four different points of view: (1) the family as one of the main factors influencing labour offer; (2) the domestic work as a factor influencing the organisation of both the family and the labour market; (3) the interferences between unpaid work time and paid work time; (4) the occupational condition of household members and its position in the system of social stratification.
10 ‘Sexual relationships and the relationships between children based on the fact of their common parent or
parents can engender social action only by becoming the normal, though not the only, bases of a specific economic organization: the household. The household cannot be regarded as simply a primitive institution. Its prerequisite is not a “household” in the present-day sense of the word, but rather a certain degree of organised cultivation of soil. The household does not seem to have existed in a primitive economy of hunters and nomads. […] In terms of economic and personal relationships, the household in its “pure”, though not necessary primitive, form implies solidarity in dealing with the outside and communism of property and consumption of everyday goods within (household communism)’ (Weber, 1978: 358-359).
11 ‘Separated from the household as a unit of economic maintenance, the sexually based relationship between
husband and wife, and the physiologically determined relationship between father and children are wholly unstable and tenuous’ (Weber, 1978: 357).
12 However, it is worth to remember that many scholars have argued that a fourth actor should be included in this
scheme: this is the no profit or ‘third sector’ (charities, co-operatives, voluntary associations). It is true, indeed, that this sector may have a strong effect on the individuals’ welfare; in particular, the welfare level of the most disadvantaged people is likely to be influenced by the level of services offered by the third sector (see for example Ranci, 1999; Ascoli and Pasquinelli, 1993). Therefore, according to many scholars it should be included
security of personal incomes (Standing, 1999); thus, the economic well being of individuals depends both on the structures and behaviours of these institutions and on the interactions between these three actors. It is clear, then, that family – as a component of the risk management structure made up by market, state and household (Esping Andersen 1990 and 1999) – and its characteristics strongly affect the income risks occurred by individuals.
At least three different levels of analysis, or different points of view, can be identified among studies on the relation between family, the distribution of economic resources and the individuals’ welfare.
(a) A first stream of the research on this topic concentrates on the role of unpaid work. Here, the term “unpaid work” refers to a whole set of domestic activities which are generally carried out within the home by family members; such as, for example, cooking, cleaning, child rearing, caring for elderly and children, etc. Not surprisingly this approach to the study of individuals’ welfare, and of the distribution of resources, has been mainly developed in the framework of gender studies. As a matter of fact, the largest part of (if not all) the domestic work has been traditionally carried out by the female members of the family and, in particular, by married women.
The ongoing assumption behind studies which concentrate on the relation between unpaid work, the amount of individuals’ welfare and its distribution in the population is that unpaid work can be fully accounted as an alternative (or at least is considered as an equivalent of money income. As a consequence, it has to be assumed that, somehow, the monetary value of household production (i.e. unpaid work) can be evaluated. Nevertheless, it has to be noted that the monetary evaluation of unpaid work is a difficult task; in the scientific literature many different methods to account for the value of the household production have been adopted (Bruy-Hundt, 1996). Thus, for example, unpaid work may be evaluated both according to a market alternative principle or according to an opportunity cost principle.
The value of the unpaid work carried out within the household is extremely relevant both at the level of national economies and at the level of individuals’ welfare. The value of this in-kind income has been estimated to 40-50 percent of GNP in most western countries (Bonke, 1992). The household production clearly affects the economic well-being and, in general, the welfare of the single household members; hence, its relevance does emerge not only at the GNP level, but also at the individuals’ level. Furthermore, since it has been found that different groups of the population differ in their reliance on this household production – think, for example, to the difference between children and adults family members, or to the difference between lower and upper classes -, then it can be argued that unpaid work strongly affects the distribution of economic resources and, thus, the inequality of individuals’ welfare. It has been found that the distribution of household production largely differs from the distribution of money income. As a consequence, the inclusion of unpaid work in the analysis of the distribution of economic resources has relevant consequences. In different studies, indeed, it has been found that the inclusion of household production in the evaluation of households’ economic resources leads to a reduction in measured inequality. Therefore, it has also been argued that women contribution to households’ economic resources, both via money and via in-kind income, tends to equalise the distribution of economic well-being in the population (Bonke, 1992; Bruy-Hundt, 1996; Bryan and Zick, 1985).
in the scheme as one of the main welfare providers (Kuhnle and Selle, 1992; Paci, 1989). On the other hand, about this “enlargement” of the welfare triad, Esping-Andersen has argued that ‘in principle, [he] would have no objections. In practice, it may make little empirical difference …[because] where its role is more than peripheral it is because it is subsidized by the state – i.e. a semi-public delivery agency’ (1999: 36, footnote #5). However, the interesting discussion about how the relevant role of the third sector should be included in the interpretation and classification of the different welfare regimes is beyond the restricted scope of this article.
(b) A second approach to the study of the relation between family characteristics and individuals’ welfare concentrates on the intra-household (re)distribution of economic resources. The usual assumption that resources are equally redistributed between family members does not hold under this approach. On the contrary, while solidarity and “communism of property and consumption” (Weber, 1978; see footnote 7) are often stressed in the study of household relations, this approach tends to stress the conflictual aspects of the (re)distribution of resources within the family. Therefore, this type of studies generally concentrate on factors affecting the unequal (re)distribution of economic resources within households. In particular, the analysis concentrates on the different levels of power of family members and, thus, on the “power structure” of families. The argument is that different levels of power correspond to different levels of individual welfare; that is to say that the consumption of resources by individuals depends on the power structure of their families. Thus, for example, it can be argued that in the traditional bread-winner model the husband, having more market power than other members, enjoys a larger part of economic resources than the children and the wife. According to this approach, then, the allocation of resources is largely determined by the power relations within the family and, thus, if household differed in its structure of power, then the distribution of resources between members would be different. As a consequence it can be argued that the household power structures also influence the aggregate level of inequality (Curtis, 1986)13.
(c) A third approach to the study of the relation between family and the individuals’ welfare concentrates on the “structural” characteristics of the household, i.e. its demographic and economic characteristics. Contrary to what has been noted above, with regards to the two previous approaches, usual assumption in studies following this third approach is that economic resources are equally redistributed within family. Moreover, it has to be noted that in these studies, generally speaking, unpaid work is not taken into account – both because of problems related to data availability and because of problems related to the monetary evaluation of household production. Hence, the argument is that the individuals’ welfare and the distribution of resources between members of society depend not only on their own characteristics (sex, age, education, ability, etc.), but also on the demographic and economic characteristics of their families. Research in framework of this approach generally explores: (i) how household characteristics influence individuals’ welfare and individuals’ position in the income distribution; (ii) to what extent household characteristics affect the inequality of the distribution of economic resources across the society; (iii) which are the prevalent household characteristics of individuals according to their position in the income distribution (see for example: Andress and Strengmann, 1994; Bolssfeld and Drobnič, 2001; Breen, 1999; Del Boca and Pasqua, 2001; Fritzell, 1993; Jenkins, 1995 and 2000; Kangas and Ritakallio, 1998; Karoly and Burtless, 1995; Ranci, 2002).
It is important to stress that, despite the differences examined above, there is one common assumption behind all these three approaches: all of them consider family as the main economic unit of aggregation. That is to say that even in the case in which the unit of analysis is the single individual, the household is considered the optimal level at which
13 ‘Societal rewards (such as economic resources), are redistributed among households, but households
redistribute those rewards among their members. Such redistribution affects aggregate inequality in many ways. Households are often (though by no means always) composed of families, and therefore familial power structure is the organization that translates what resources come into a household into the share that accrues to each member. Authority is one of many factors affecting the power of family members, and has special importance because of its part in explaining the persistence of power structures. Patterns of familial authority are widely shared, and thus help to explain the ubiquity as well as the persistence of power differences between adults and children, men and women. Familial authority is therefore an important, if somewhat indirect, part of the explanation of aggregate inequality’ (Curtis, 1986: 170-171).
income data have to be registered. Hence, the relevance of the family to individuals’ welfare and its redistributive role are recognised in all the three approaches.
The present paper will stay in the framework of the third of these approaches; namely, in the next section, I will examine which are the prevalent household characteristics of individuals at the top and at the bottom of the Italian income distribution. In particular, the analysis will concentrate on how these characteristics have changed during the two last decades.
2. The changing household characteristics of individuals at the top and at the bottom of the Italian income distribution.14
In the two following paragraphs I analyse the households’ demographic and economic characteristics of individuals located in the highest and in the lowest quintile of the income distribution15. In particular, different partitions of the population have been considered according to different household demographic and economic characteristics; moreover, each partition of the population “generates” different subgroups of individuals with different characteristics. The analysis, then, concentrates on the changes of the composition of the specific quintiles of the Italian population in terms of the different subgroups16.
The following demographic and economic characteristics of households have been considered: (a) sex and number of household heads17; (b) reference age of the family18; (c) presence of other household members, beside the main couple and their age (at least one minor vs. all adults); (d) household size; (e) economic status of the male head; (f) economic status of the female head; (g) presence of other income receivers beside the main couple; (h) value of the ratio between the number of household’s income receivers and the number of household members.
14 The source of the data used in this article is the Bank of Italy, Survey of Household Income and Wealth
(SHIW-HA, - Version 2.0, February2002). But the author and not the Bank of Italy, is personally responsible for the research.
15 In particular here and in the following analyses it is considered the distribution of equivalent disposable
income between persons. In the choice of the equivalent scale I follow the approach generally adopted by the Luxembourg Income Study (LIS): equivalence coefficients equal to N , where N is the number of household 0.5 members. Income is net of interest and financial assets.
16 There are two exceptions to this type of analysis; they regard the analyses of the data about the household size
and about the value of the ratio between income receivers and family members. In the analyses of these two characteristics averages have been considered.
17 With regard to the number of household heads, families have been classified in two categories: those where
the main couple (a male head plus a female head) is present: “couples”, and the so called “single headed” families, where only one member of the main couple is present. For a similar use of the concept of household head see Karoly and Burtless (1995).
18 Individuals have been grouped according to the age class of the female head. If a female head is not present in
the household (i.e. single male head households), then the age of the male head is considered as the reference one. Since, generally speaking, the males tend to marry younger females, here I consider the age of the female head as the reference one to be sure that in (almost) all cases both the heads are older than the reference age considered. This way of classifying families proves to be particularly relevant when making a distinction between those people living in elderly families (>65), which are likely to be “pensioner families”, and those living in younger families – who might be still active in the labour market
2.1. The changing household characteristics of individual in the richest quintile
As argued above, the recent change in the structures of the labour market, the welfare state and the household have strongly affected the distribution of risks and, thus, the structure of inequality. The analysis presented in the following figures aim at exploring how it is changed the composition of the richest part of the Italian population from the late 1970s to the year 200019.
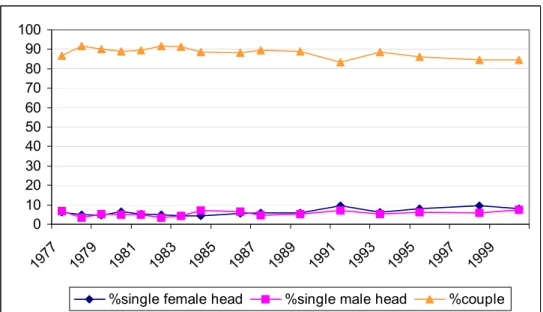
First of all, considering results of the analysis of the quintile composition according to the number and sex of the household heads (figure 1), it is interesting to note that the percentage of rich people living in “couple” families has slightly decreased in the last decade – namely, from about 91 percent in 1993 to about 85 percent in 2000. However, generally speaking, the quintile composition, in terms of this first partition of the population, has not remarkably changed from late 1970s to the end of the 1990s.
Figure 1. Top quintile composition according to the number and sex of household heads. Italy, 1977-2000.
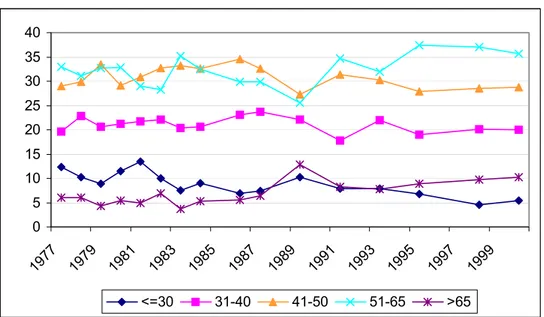
The analysis of the top quintile composition according to the reference age of the household (figure 2) enlightens remarkable changes from the 1977 to 2000: (a) a decreasing proportion of individuals from young families and (b) an increasing percentage of people from households older than 50 years.
The most striking change is probably the large decrease in the percentage of people living in families of the youngest subgroup (i.e. <= 30 years). Starting from the end of the 1980s the proportion of these individuals in the top income group has constantly decreased, with the only exception of a really moderate increase from 1998 to 2000. Furthermore, it should be noted that the presence of this group in the richest quintile had already remarkably decreased in the years from 1981 to 1987. As a matter of fact, the percentage of people from young families in this quintile has more than halved in the last two decades; namely, it has decreased from 12 percent in 1977 to about 5 percent in 2000.
The second most notable change in the age group composition of the richest part of the population is the increasing percentage of individuals living in families belonging to the two
19 It should be stressed that here and in the following analyses all years available in the SHIW-HA survey have
been utilised; in particular, the data are available for the following years: 1977, 1978, 1979, 1980, 1981, 1982, 1983, 1984, 1986, 1987, 1989, 1991, 1993, 1995, 1998, 2000. 0 10 20 30 40 50 60 70 80 90 100 1977 1979 1981 1983 1985 1987 1989 1991 1993 1995 1997 1999
oldest subgroups: i.e. families aged between 51 and 65 years, and families older than 65 years. The proportion of the first of these subgroups fluctuated between 28 and 35 percent from 1977 to 1983, then it decreased reaching its lowest value – 26 percent – in the 1989. After this year the percentage of rich people in families aged between 51 and 65 years increased – with some fluctuations – up to 36 percent in 2000. The analysis of the changes in the proportion of the oldest subgroup results to be really interesting, particularly considering that the heads of families older than 65 years are likely to be pensioner. What emerges from the analysis is that this proportion had continuously increased since the beginning of the 1980s and reached its peak in 1989. Next, after a remarkable decrease from 1989 to 1991, the percentage of rich people living in elderly families has increased until the last year of the survey, 2000. Thus, during the 23 years here considered the proportion of this subgroup has growth from less than 4 percent up to more than 10 percent in year 2000.
With respect to the other two age groups identified it has to be noted that significant fluctuations have been registered all along the period considered. Nevertheless, it does not emerge a particular trend and, indeed, the proportion at the beginning and at the end of the period are very similar.
The analysis of the age group composition of the top quintile, thus, reveals that during the last decades there has been an increase in the proportion of richest people who live in elderly families. Hence, it can be argued that there has been an ageing of the richest part of the population or at least of the families of the richest people. Thus, considering the composition of the richest quintile, it is important to note that: first, at the end of the period the presence of people living in families aged between 51 and 65 years is significantly higher than the presence of people from families aged between 41 and 50 years; whereas, the proportions of these two subgroups were quite similar until year 1995. Second, in the last three years of the survey (i.e. 1995, 1998 and 2000) the proportion of the richest people living in elderly families resulted to be remarkably higher than the percentage of the richest people living in young families.
The analysis of the top income group composition by age class has enlightened opposite changes with respect to the presence of people from two vulnerable subgroups: people living in young families and people living in elderly families; while the first group has decreased in the richest part of the population, the second has significantly increased.
Figure 2. Top quintile composition according to the household reference age. Italy, 1977-2000.
0 5 10 15 20 25 30 35 40 1977 1979 1981 1983 1985 1987 1989 1991 1993 1995 1997 1999 <=30 31-40 41-50 51-65 >65
The analysis presented in figure 3 enlightens two remarkable changes in the top income group composition: (1) it has considerably decreased the percentage of rich individuals who live in a family with at least one minor member; (2) the proportion of rich people living in families with no other members beside the heads has increased quite a lot.
Considering the changes in the top income group composition, all along the period considered, it emerges that after a period of small fluctuations the percentage of individuals living in families made up only by heads has increased almost constantly since the year 1983; thus, it reaches the value of about the 20 percent in year 2000. Similarly the trend in the proportion of people from “all adults” families has been continuously on the increase since the year 1984, with the only significant exception of the period between 1991 and 1993.
Finally, analysing the changes in the proportion of people living in families with minors, it results that after the 1981 the presence of this subgroup in the richest quintile decreased almost continuously until the beginning of the 1990s. Then, after a significant increase between 1993 and 1995, the proportion of this subgroup reached its lowest level in 1998.
This last analysis of the top income group composition, thus, reveals that the early-mid 1980s were a crucial period with respect to the changes in the composition of the richest strata of the Italian population. As a matter of fact, in 1983 the proportion of people from families without other members beside the heads has started to increase; next, in 1981/1984 the proportion of individuals from families with minor members has started to decrease; finally after 1986 the proportion of rich people from “all adults” families has always been higher than that of people from families with minor members.
Figure 3. Top quintile composition according to the presence of other household members beside the heads, and their age. Italy, 1977-2000.
So far only the changes in the individuals’ household demographic characteristics have been analysed; in the next part of this paragraph the economic characteristics of the families will be considered. Thus, it will be analysed the top income group composition according to the economic status of the male head20, the economic status of the female head and the presence of other income receivers beside the heads.
20 In particular five different groups have been identified according to the economic status of the household male
(/female) head: first, it has been identified a group of families where the male (/female) head is not present; the second group is made up of people living in families with a male (/female) head in paid work; third, another
0 10 20 30 40 50 60 1977 1979 1981 1983 1985 1987 1989 1991 1993 1995 1997 1999
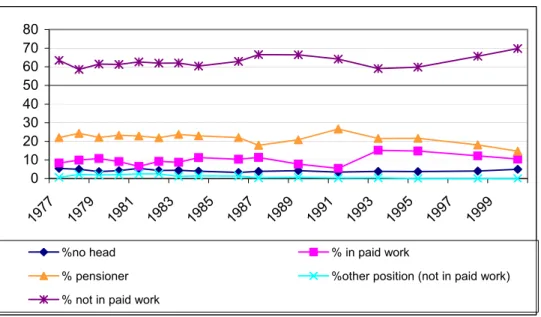
What emerges from the analyses about the first two household economic characteristics mentioned above is that, on the one hand, (a) it has increased the proportion of rich individuals who live in families with a pensioner male head, in families with a pensioner female head, and in families with a female head in paid work; on the other hand, (b) it has decreased the proportion of rich people from families with a male head in paid work and from families with a female head not in paid work (figure 4 and 5).
The percentage of people, in the top quintile, who live in a household with a male head in paid work has diminished from 83 to 66 percent in the last decades. In particular, the negative trend seems to start around the mid 1980s. On the opposite, in the same period it has taken place an increase in the proportion of people living in families with a pensioner male head. However, it emerges from the figure 4 that the growth has been particularly relevant after the 1989 and during the 1990s.
Remarkable changes also emerge from the analysis of the income group composition according to the economic status of the female head. First of all, at the end of the 1970s the proportions of the two subgroups “female head in paid work” and “female head not in paid work” were quite similar. Then, after that period, the percentage of the first group has increased quite a lot – even if the trend shows numerous fluctuations – reaching its peak in 1993; at the end of the period the subgroup makes up more than 50 percent of the top quintile. On the contrary, after the end of the 1970s, the percentage of the second subgroup has dramatically diminished and, despite a slight growth during the 1990s, it decreases to the value of 21 percent in 2000. A second big change in the top quintile composition is the growing proportion of people living in families with a pensioner female head. This proportion was quite stable until the end of the 1980s, but then it has considerably increased. It is important to note that, in the last decade, the size of this subgroup is very similar to that of people living in families with a female head not in paid work.
Figure 4. Top income group composition according to the economic status of the male head. Italy, 1977-2000. 0 10 20 30 40 50 60 70 80 90 100 1977 1979 1981 1983 1985 1987 1989 1991 1993 1995 1997 1999
%no head %in paid work
%pensioner %other position (not in paid work)/wealthy
%not in paid work
subgroup is made up by people living with a pensioner male (/female) head; fourthly, it has been distinguished a group of families where the male (/female) head is in one of the following positions (not in paid work): first job seekers, unemployed, student, homemaker; finally, the fifth group is made up of families with a male (/female) head who is in another position (not in paid work) or wealthy. Here it is worth to note that the decision of building up this “strange” combination of wealthy people and people in “other positions (not in paid work)” come from a careful analysis of the incomes of these subgroups in all the available years in the SHIW-HA data base; more information about that can be obtained from the author.
Figure 5. Top income group composition according to the economic status of the female head. Italy, 1977-2000
Considering the last figure about the top income group composition (figure 6), it is interesting to note the increasing proportion of people living in families with other income receivers beside the heads (from 50 to 55 percent) and, on the opposite, the decreasing proportion of people living in families with other non income receiver members beside the heads (from 12 to 20 percent).
It is clear, then, that in the last decades an increasing part of rich people live in families with a more complex income package.
Figure 6. Top income group composition according to the presence of other income receivers beside the heads. Italy, 1977-2000.
In this paragraph we saw how it has changed the composition of the top income group according to individuals’ household characteristics. To sum up the main changes, it emerges that in the last two decades: (a) it has slightly decreased the proportion of rich people who live in “couple” families; (b) the percentage of individuals living in elderly families has
0 10 20 30 40 50 60 1977 1979 1981 1983 1985 1987 1989 1991 1993 1995 1997 1999
%no head %in paid work
%pensioner %other position (not in paid work)/wealthy
%not in paid work
0 10 20 30 40 50 60 70 1977 1979 1981 1983 1985 1987 1989 1991 1993 1995 1997 1999
considerably increased, particularly it has increased the proportion of the subgroup of people living in households aged more than 65 years; (c) it has more than halved the proportion of rich people living in young families (<=30); (d) an increasing part of the fifth quintile is made up of people living in families without other members beside the heads, on the opposite the proportion of individuals living in families with at least one minor member is on the decrease; (e) the presence of people from an household with a pensioner male head and/or from an household with a pensioner female head has increased, in particular the increase has been registered in the period after the late 1980s; (f) people living with a female head not in paid work and/or with a male head in paid work has diminished, whereas it has increased the proportion of those living with a female head in paid work.
These are the main changes in the top part of the income distribution, but how these changes reflect in the bottom part of the distribution? How has the bottom income group composition changed, in the same way or in the opposite way? In the next paragraph I will try to answer these questions.
2.2. The changing household characteristics of individual in the poorest quintile
Single elderly, one parent families with minor children, couples with three or more children, couple with children and only one head working: these are the poorest families at the beginning of the XXI century (Brandolini and D’Alessio, 2001; Negri and Saraceno, 2000; Ranci, 2002; Saraceno, 2000 and 2002). In this paragraph I will analyse how this particular composition of the bottom income group was reached.
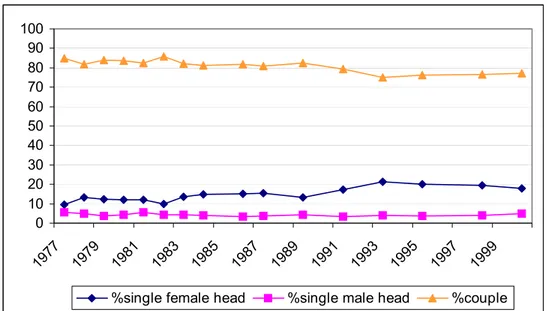
Figure 7 shows the transformations in the bottom income group composition according to the number and sex of household heads. What emerges from the analysis is that it is on the decrease the proportion of poor people living in a family where both members of the main couple are present. However, the most striking change shown in figure 7 is the growth in the percentage of people living in “single female head” families. The presence of this subgroup, at the bottom of income distribution, has increased in particular during the late 1980s and the early 1990s. The percentage of these people was about 10 percent in 1977, then it grew up to 13 percent in 1989 and it reached a peak in 1993. During the mid-late 1990s this percentage has slightly diminished and, in year 2000, is about 18 percent.
Figure 7. Bottom quintile composition according to the number and sex of household heads. Italy, 1977-2000. 0 10 20 30 40 50 60 70 80 90 100 1977 1979 1981 1983 1985 1987 1989 1991 1993 1995 1997 1999
The analysis of the pattern of transformations in the bottom income group composition according to the household age class results to be quite complicated, especially with regards to the period between late 1970s and late 1980s (figure 8).
Considering the proportions of the two extreme age groups (younger than 30 years and older than 65 years) – which were deeply analysed in the previous paragraph – opposite trends emerge. On the one hand, the percentage of people from young families increased in the late 1970s, remaining around the value of 15 percent all along the 1980s; then, since the 1989 it has continuously decreased reaching the level of 10 percent in 2000. On the other hand, the line showing the trend in the proportion of people living in elderly families is “U” shaped. The percentage of this subgroup diminished from early to late 1980s, but after that period it increased and in 2000 it has reached the same level as in 1977.
The most interesting change enlightened by the analysis presented in figure 8 is the considerable growth in the percentage of poor people living in families aged between 31 and 40. The trend fluctuated around values of 23, 24 percent until year 1989, after that year the increase is really remarkable; at the end of the period considered this age group makes up one third of the poorest quintile.
The proportion of the two other age groups fluctuated quite a lot. The trend in the percentage of people from household aged between 51 and 65 years stabilised after the year 1993; its level in 2000 is about 4 percentage points lower than that in 1977. In 2000 the proportion of poor people from households aged between 41 and 50 years is almost equal to that in 1977, however the trend fluctuated a lot all along the period considered.
To sum up, what emerges from the analysis shown in figure 8 is that: (a) during the 1980s it has been registered an increase in the proportion of poor people from young families and, at the same time, a decrease in the proportion of poor people from elderly families. However, at the end of the period the second subgroup remains more numerous than the first one; in fact, 18 percent of poor individuals live in elderly families whereas only 10 percent live in young families; (b) the proportion of the second youngest age group has considerably augmented. In 2000, indeed, more than 30 percent of poor people live in families aged between 31 and 40 years.
Figure 8. Bottom quintile composition according to the household reference age. Italy, 1977-2000.
0 5 10 15 20 25 30 35 1977 1979 1981 1983 1985 1987 1989 1991 1993 1995 1997 1999 <=30 31-40 41-50 51-65 >65
On the contrary to what was observed in the previous paragraph, about the top income group, the composition of the poorest quintile according to the presence and age of other family members has not changed very much (figure 9). The percentage of people living in families with at least one minor member has slightly decreased (from 59 to 55 percent), as well as the proportion of people living in families without other members beside the heads (from 25 to 21 percent). The percentages of these subgroups in the top quintile, on the opposite, have remarkably changed in the last decades.
The most interesting result emerging from figure 9 is the increasing number of people from “all adults” families (from 15 to 24 percent); at the end of the period considered, this group is more numerous than those of people from families made up only by the main couple. After analysing the changes in the individuals’ household demographic characteristics, the next part of the paragraph will be devoted to the study of the changes in the household economic characteristics of individuals in the bottom income group.
Figure 9. Bottom quintile composition according to the presence of other household members beside the heads, and their age. Italy, 1977-2000.
The analysis of the transformations in the bottom quintile composition, according to the heads economic position (figures 10 and 11), reveals that: (a) it has decreased the proportion of individuals living in families with a male head in paid work and in families with a pensioner head; (b) they are increased poor people living in a family with a head not in paid work.
Similarly to what observed in the top income group composition, also in the bottom quintile it has diminished the proportion of people from families with a male head in paid work. The decrease started in late 1980s, whereas in the last period a slight growth was registered; however, in 2000, this subgroup still makes up more than the absolute majority of the bottom quintile. Since the decrease has been registered both in the top and in the bottom quintile, it might be that it is due to a decrease of this subgroup in the overall population. Thus, more than a change in the structure of inequality this transformation may signal a change in the structure of the population.
The trend in the percentage of poor people living with a pensioner male head has been on the decrease, particularly after the 1989; the 2000 level, indeed, is 7 percentage points lower than the level in 1977.
0 10 20 30 40 50 60 70 1977 1979 1981 1983 1985 1987 1989 1991 1993 1995 1997 1999
The most striking result shown in figure 10 is the considerable increase, starting from the mid-late 1980s, of poor people living in families with a male head not in paid work. The proportion of this subgroup is absolutely negligible in the top quintile group and in the bottom quintile from 1977 to 1983; but in 1998 this subgroup made up 17 percent of poor people, and in 2000 this percentage has only slightly decreased to 11 percent.
It is quite interesting, considering income group composition by the economic status of the female head, to compare changes observed in the bottom and in the top quintile. In the bottom quintile the percentage of people from families with a female head not in paid work has slightly increased (from 63 to 70 percent), whereas in the top income group there was a deep decrease in the proportion of this subgroup. Moreover, while poor people living with a pensioner female head has diminished from 22 to 15 percent, in the richest part of the Italian population individuals living with a pensioner female head were 12 percent in 1977, but 19 percent in 2000. These opposite trends seem to indicate a remarkable change in the structure of inequality.
With regard to the proportion of the group of people living with a female head in paid work it has to be noted that the value fluctuated a lot in the decade from 1987 to 1997. In 2000 this subgroup makes up about 10 percent of the lowest quintile, that is to say about 2 percentage point less than in 1977.
Figure 10. Bottom income group composition according to the economic status of the male head. Italy, 1977-2000. 0 10 20 30 40 50 60 70 1977 1979 1981 1983 1985 1987 1989 1991 1993 1995 1997 1999
%no head % in paid work
% pensioner %other position (not in paid work)
Figure 11. Bottom income group composition according to the economic status of the female head. Italy, 1977-2000.
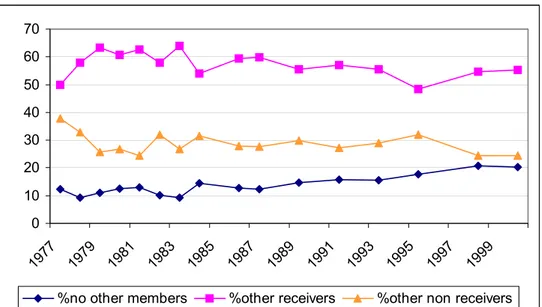
Figure 12 shows the changes in the bottom income group composition according to the presence and economic status of other family members beside the heads. The trends in the proportion of the two subgroups “other receivers” and “other non receivers” fluctuated quite a lot during all the period considered; moreover, it can also be noted that the two trends are more or less symmetric. As a matter of fact, comparing the starting and the final level, it results that the proportion of the first subgroup has doubled (from 17 to 34 percent); whereas the proportion of the second subgroup has diminished from 58 to 46 percent. Finally, contrary to what was observed in the richest quintile, the presence of the subgroup of people from household without other members beside the heads has slightly diminished.
Hence, it can be argued that, similarly to what has been noted for the top income group, an increasing part of poor people live in families with a more complex income package.
Figure 12. Bottom income group composition according to the presence of other income receivers beside the heads. Italy, 1977-2000.
0 10 20 30 40 50 60 70 1977 1979 1981 1983 1985 1987 1989 1991 1993 1995 1997 1999
%no other members %other receivers %other non receivers 0 10 20 30 40 50 60 70 80 1977 1979 1981 1983 1985 1987 1989 1991 1993 1995 1997 1999
%no head % in paid work
% pensioner %other position (not in paid work)
Finally, in the two figures 13 and 14, they have been plotted the values of: (a) the average household size of individuals located at the top and at the bottom of the income distribution; and (b) the average ratio between income receivers and household members (receiver ratio) of the households of those individuals located at the top and at the bottom of the income distribution.
It emerges that, both in the first and in the fifth quintile, people live in smaller households today than in 1977. With regard to figure 14, it is interesting to note that while the average receiver ratio has slightly decreased in families of the poorest individuals, on the contrary, the richest people in 2000 tend to live in families with a markedly higher receiver ratio than families of the rich people in 1977. Namely, the average receiver ratio in the fifth quintile has increased from 64 percent in 1977 to more than 76 percent in 2000.
Considering the period between 1977 and 2000, it emerges from the analysis that the composition of the bottom income group has changed quite a lot. First of all, an increasing percentage of poor people live in “singles female head” families; in year 2000 almost one fifth of the poorest part of the Italian population live in families without a male head. Second, an increasing proportion of poor people live in families aged between 31 and 40 years, whereas it is on the decrease the percentage of those individuals living in families aged between 51 and 65 years. A fourth remarkable change is the increasing proportion of poor people from “all adults” families. Considering the economic characteristics of households, then, the main changes are; the impressive increase in the proportion of poor people living with a male head not in paid work; the decrease in the proportion of people from families with a pensioner head; and the fact that it has doubled the percentage of poor people living in families with other income receivers beside the heads.
So far I have explored two main issues concerning the relation between family and individuals’ welfare. First, it was analysed the change in the household economic and demographic characteristics of individuals located at the top of the income distribution; second, the same study was replicated looking at the bottom part of the income distribution. However, these analyses does not tell us anything about how it has changed the structure of income risks in the Italian population in the last two decades. Thus, form example, observing the increase in the proportion of rich people living in families with a pensioner head, we do not know if this change occurred because of an improvement, on average, of the economic position of pensioner or just because it has increased the population of pensioners in the overall population. In the next section, by adopting a very simple technique, I will briefly analyse how it has changed, from 1977 to 2000, the income risks structure according to the household characteristics of individuals.
Figure 13. Average household size of individuals located at the top and at the bottom of the income distribution. Italy, 1977-2000.
Figure 14. Average ratio between income receivers and household members of the households of those individuals located at the top and at the bottom of the income distribution. Italy, 1977-2000.
3. The changes of the income risks according to family characteristics
In this paragraph I summarise the location of different subgroups of individuals in different parts of the Italian income distribution in the years 1977 and 2000 – these are the first and the last year for which there are data available in the data set of the Bank of Italy (SHIW-HA). The location of individuals within the income distribution is determined by the specific quintile of the distribution to which they belong.
Several graphs are shown below, they summarise the composition of each of the five income groups accounted for by different subgroup types – the same used in the previous analyses. Moreover, in each graph it is also provided the proportion of each subgroup type in the population as a whole. This latter data is particularly useful to evaluate the “income risk” associated to each particular subgroup of the population. If the risk of low income, or high
2,5 2,7 2,9 3,1 3,3 3,5 3,7 3,9 4,1 4,3 1977 1979 1981 1983 1985 1987 1989 1991 1993 1995 1997 1999
Average household size in the first decile Average household size in the fifth decile
10 20 30 40 50 60 70 80 90 1977 1979 1981 1983 1985 1987 1989 1991 1993 1995 1997 1999
income, were spread equally across the population, then one would expect to see each group represented in every income group in exactly the same proportion as in the population as a whole. On the contrary, any deviation from these proportions indicates over or under representation in different parts of the income distribution and, consequently, an unequal distribution of income risks21.
First, the breakdown by the number and sex of household heads is considered (figures 15 and 16). Considering the two figures separately, what immediately emerges is the difference in income risks occurred by “single female head” families and by “single male head” families. Next, the study of the changes in the population and in the different income groups composition is quite interesting too. In particular, it enlightens the changes in the income risks occurred by different subgroups of the population.
In both the years considered, individuals living in families where the single head is a male one are slightly over represented at the top of the Italian income distribution. On the opposite, people living in a “single female head” family are largely over represented at the bottom of the distribution. Thus, while people living in “single female head” families are strongly affected by low income risks, people living in “single male head” households are at risk of being located in the top part of the distribution.
The analysis of the changes between the two years reveals that the most remarkable changes in the population composition are the same as those noted above for the extreme income groups composition: i.e. a decreasing proportion of people living in “couple” families and a considerable increase of people living in families without a male head. However, it is interesting to compare the size of these changes across the income distribution to detect changes in income risks. Thus, it emerges that the proportion of the “couple” subgroup has proportionally diminished much more in the lowest income group (about 9 percent) than in the top income group (2 percent). Next, the proportion of people from “single female head” households has augmented both in the top and in the bottom income group; but, it has increased by 33 percent in the richest group versus an increase of 80 percent in the poorest quintile. Therefore, it seems that the most relevant change emerging from this analysis is the worsening of the relative economic position –which was already bad – of people living in “single female head” households.
21 Nevertheless, it should be stressed that, considering that for each individual it has been considered the
Figure 15. Income group composition by number and sex of household heads, year 1977. 0,10 0,07 0,05 0,05 0,06 0,07 0,05 0,04 0,04 0,07 0,07 0,06 0,85 0,89 0,91 0,88 0,87 0,88 0% 10% 20% 30% 40% 50% 60% 70% 80% 90% 100% 1,00 2,00 3,00 4,00 5,00 Total
single head female single heah male couple
Figure 16. Income group composition by number and sex of household heads, year 2000.
0,18 0,15 0,15 0,12 0,08 0,13 0,05 0,05 0,06 0,05 0,07 0,06 0,77 0,80 0,79 0,83 0,85 0,81 0% 10% 20% 30% 40% 50% 60% 70% 80% 90% 100% 1,00 2,00 3,00 4,00 5,00 Total
single head female single heah male couple
As noted above it emerges from the data a relevant change in the age profile of the poorest and the richest groups of the Italian population. Moreover, the income risks associated to the different age groups has changed quite a lot (figures 17 and 18).
First of all, it seems that, in the last decades, the economic situation of people living in families younger than 40 years has significantly worsened. In 1977 these individuals were slightly under represented in the bottom quintile (34 percent of the poorest people versus 36 percent of the population), but 23 years later they are largely over represented in the poorest group. In 2000, these people, indeed, make up 40 percent of the bottom quintile, but only 32 percent of the population. In particular, considering the youngest subgroup (<=30), it emerges that its proportion in the population has diminished by 46 percent, but in the bottom quintile it has been registered a reduction of 9 percent only. Thus, while the proportion of people living in families younger than 40 years has augmented in the bottom income group, at the same time, it has decreased in the top quintile (i.e. from 32 to 25 percent).
Second, the economic situation of the oldest subgroups of the population seems to have considerably improved. The proportion of people living in families older than 65 years has
increased, in the population, by 70 percent in the last decades. The increase in the top income group has also been remarkable, i.e. 67 percent. However, the percentage of these individuals among the poorest people has not changed at all from 1977 to 2000 – even if it should be noted that it has increased by 140 percent in the second quintile. The analysis reveals that is has also improved the economic situation of people living in families aged between 50 and 65 years. As a matter of fact, their presence in the top income group has increased by 9 percent, whereas their proportion in the population has diminished. Furthermore, it has also to be noted that their proportion in the bottom income group has decreased more than in the population (-21 percent versus –4 percent).
Summing up the results of this analysis it can be argued that: (a) while the two youngest subgroups of population in 1977 were under represented in the poorest quintile, in 2000 they are affected by low income risks; (b) people living in the oldest families (> 65 years), at the end of the 1970s, were over represented in the bottom income group, whereas in 2000 they are over represented in the second and in the third quintile. Thus, a slight improvement in their economic situation has been registered; (c) people in families aged between 51 and 65 years, in both the years considered, are over represented in the richest group. However, the analysis enlightens a remarkable improvement in their relative economic position.
Figure 17. Income group composition by the reference age of the family, year 1977.
0,11 0,14 0,13 0,15 0,12 0,13 0,23 0,25 0,24 0,23 0,20 0,23 0,25 0,26 0,27 0,30 0,29 0,27 0,24 0,24 0,26 0,26 0,33 0,27 0,18 0,10 0,09 0,06 0,06 0,10 0% 10% 20% 30% 40% 50% 60% 70% 80% 90% 100% 1,00 2,00 3,00 4,00 5,00 Total <=30 31-40 41-50 51-65 >65
Figure 18. Income group composition by the reference age of the family, year 2000.
0,10 0,05 0,07 0,06 0,05 0,07 0,30 0,29 0,26 0,22 0,20 0,25 0,23 0,23 0,24 0,27 0,29 0,25 0,19 0,18 0,25 0,31 0,36 0,26 0,18 0,24 0,19 0,14 0,10 0,17 0% 10% 20% 30% 40% 50% 60% 70% 80% 90% 100% 1,00 2,00 3,00 4,00 5,00 Total <=30 31-40 41-50 51-65 >65