PhD Course
Translational Medicine
Accademic Year
2016/2017
Role of TBX5 controlled miRNAs in Holt-Oram
Syndrome: deciphering regulatory circuitries
responsible for cardiac malformations
Author
Dr. Elena Guzzolino
Supervisor
Prof. Vincenzo Lionetti
Tutor
“Be always like the sea, than breaking up against cliffs it finds always the force to try again” – cit. Dedico questo lavoro a tutti gli ostacoli che mi hanno reso più forte, alla mia testardaggine, ma soprattutto alla stella polare della mia vita: a mio fratello Paolo
i
C
ONTENTS
Abstract ... 1 1 Introduction... 3 1.1 Cardiogenesis ... 3 1.1.1 Cardiogenesis in mouse ... 4 1.1.2 Cardiogenesis in zebrafish ... 7 1.2 TBX5 ... 10 1.3 MicroRNAs ... 131.3.1 microRNAs in cardiovascular development ... 16
1.4 Zebrafish as a model to study Congenital Heart Disease (CHD) ... 21
2 Materials And Methods... 23
2.1 Reagents... 23
2.2 MiRNA profiling ... 25
2.3 Zebrafish lines and Microinjection in zebrafish embryos ... 26
2.4 Imaging ... 26
2.5 In situ hybridization ... 27
2.6 RNA extraction and Quantitative Real Time RT-PCR. ... 27
2.7 Digital Droplet PCR ... 27
2.8 Heart dissectioning and immunohistochemistry ... 28
2.9 Cell shape analysis ... 28
2.10 Proliferation assay in vivo ... 28
2.11 Migration assay in vivo ... 29
2.12 In vitro assays ... 29
2.12.1 Cell culture and transfection ... 29
2.12.2 Proliferation assay ... 31
2.12.3 Migration assay ... 32
2.12.4 Cardiomyocyte differentiation assay ... 32
2.13 Gateway Technology ... 32
2.14 Physiological analysis ... 34
2.15 Pharmacological analysis ... 34
3 Results ... 35
3.1 Identification of microRnas controlled by Tbx5 and involved in heart development of mammals ... 35
ii 3.2 Preliminary functional characterization of miR-10a with gain and loss of function
experiments ... 38
3.3 Functional Characterization of MIR-182 ... 41
3.3.1 Mir-182 overexpression affects heart morphology ... 41
3.3.2 MiR-182 downregulation has not effects on heart development ... 46
3.3.3 MiR-182 overexpression alters the expression of cardiac markers of HOS phenotype ... 48
3.4 Rescue of HOS phenotype ... 50
3.4.1 Microinjection of MO-182 in HET Tbx5a mutants ... 55
3.4.2 Tbx5B is not a miR-182 target ... 56
3.5 MiR-182 expression in zebrafish heart ... 60
3.5.1 MiR-182 affects myocardial cells proliferation and differentiation ... 62
3.5.2 MiR-182 affects migration of cardiac precursors during early stages of cardiogenesys ... 66
3.6 In vitro experiments to evaluate the role of miR-182 in murine cell lines ... 68
3.6.1 Analysis of proliferation rate in HL1 cells overexpressing miR-182 ... 69
3.6.2 MiR-182 affects migration of mouse myocardial cells in vitro ... 70
3.6.3 MiR-182 overexpression affects cardiac cell differentiation in P19CL6 ... 70
3.7 Identification of putative 182 regulators on the promoter of miR-183/96/182 cluster ... 72
3.7.1 In vitro characterization of the putative Tbx5 binding sites in miR-183/96/182 promoter ... 74
3.8 In silico analysis for searching miR-182 target genes ... 75
3.9 Validation of miR-182 target ... 78
3.9.1 Mef2C ... 78
3.9.2 Isl1 ... 78
3.9.3 dHand ... 81
3.9.4 Calcium channels ... 82
3.9.4.1 MiR-182 overexpression affects heart physiology ... 82
3.9.4.2 Pharmacological treatment with L-type calcium channels agonist ... 90
3.9.4.3 Molecular Validation ... 91
3.10 Production of the transgenic line, tg(Myl7:Gal4,eGFP; 4xUAS:miR-182, Cry:eGFP) and tg(Myl7:Gal4,eGFP; 4xUAS: RFP sponge-miR-182, Cry:eGFP) ... 94
3.10.1 The transgenic line Tg(Myl7:GAL4, EGFP) ... 95
iii
3.10.1.2 Generation of the transgenic fish ... 96
3.10.2 The transgenic line Tg(Sce.4xUAS:miR-182, Cry:EGFP) ... 97
3.10.2.1 Generation of the plasmid ... 97
3.10.2.2 Generation of the transgenic fish ... 98
3.10.3 The transgenic line Tg(Sce.4xUAS:RFP-sponge-miR-182, Cry:EGFP) ... 99
3.10.3.1 Generation of the transgenic fish ... 100
3.10.4 The transgenic line Tg(Myl7:GAL4, EGFP, 4XSCE-UAS:miR-182, Cry:EGFP) 100 3.10.5 The transgenic line Tg(Myl7:Gal4,eGFP; 4XUAS: RFP sponge-miR-182, CRY:eGFP) ... 104
3.10.6 Funtional analysis of Tg(Myl7:182) and Tg(Myl7:sponge182) embryos ... 104
3.10.7 Stable down-regulation of miR-182 in myocardium is able to partially rescue HOS phenotype ... 105
3.11 miR-182 and cardiac sarcomere formation: new prospective between calcium deregulation and sarcomere morphology ... 107
4 Discussion ... 112
5 Bibliography ... 119
I
NDEX OF
F
IGURES
Figure 1.1 – Molecular players involved in sequential steps of heart morphogenesis, from specification to differentiation of myocardial precursors. Each step is related to a specific phase of gestation in mouse, perfectly overlapped with heart formation in chicken. Image from (Abu-Issa and Kirby, 2007). ... 4Figure 1.2 – Transversal section of murine embryo at E7.5 in the level of pre-cardiac field. Different colours were used to highlight different tissues and for each one is presented the main set of molecular players with relative interactions. Image from (Rana et al., 2013). ... 5
Figure 1.3 – Cardiac cells derivatives from the multipotent precursor under the control of different signals of differentiation. Image from (van Weerd et al., 2011). ... 6
Figure 1.4 – Morphological developmental stages of mammalian heart: A) E7.75 stage where coelom separates splanchnic mesoderm from somatic mesoderm. B) Cardiac progenitors move ventrally to form heart tube. C) From E8.5-E10.5 heart tube elongates and loops into a rightward spiral. D) Remodelling phase and sequential trabeculae formation. Image from (Stennard and Harvey, 2005). ... 7
Figure 1.5 – Schematic representation of TBX5 protein domains and mutations discovered with relative position in the sequence. The majority localized in the DNA- binding domain. NLS1= nuclear localization segment 1, NLS2= nuclear localization segment 2, NES= nuclear export segment. Image from (Al-Qattan and Abou Al-Shaar, 2015). ... 12
iv
Figure 1.6 – Function of miR-1 and miR-133 in heart and skeletal muscle. Image from (Lliu
and Oslon 2003). ... 18
Figure 1.7 – List of main tools which can be used in zebrafish model. ... 21 Figure 1.8 – Euler-Venn diagram of orthologous genes shared among the different model
organisms (Howe et al., 2013). ... 22
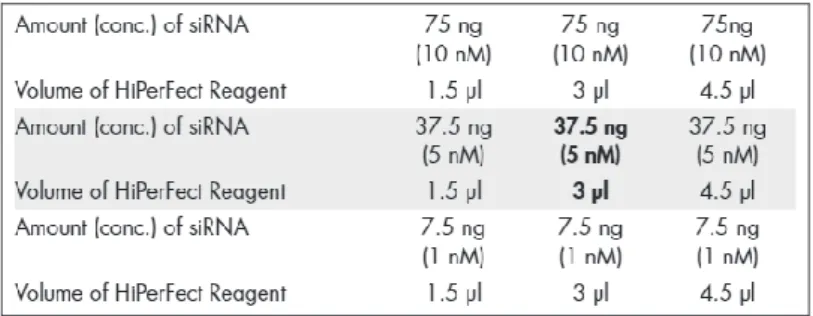
Figure 2.1 – Guidelines to transfect cell lines with Lipofectamine 2000. ... 30 Figure 2.2 - Guidelines to transfect cell lines with Hiperfect. ... 31 Figure 3.1 – Relative expression level of selected microRNAs from miRNA profiling on wt,
CRE, Tbx5lox/+ e Tbx5del/+ cDNA samples, by Real-Time PCR. Each column is the normalized
value of the media of three quantifications. We used U6 as standard. ... 37
Figure 3.2 – Histogram showing the normalized number of reads of selected cardiac
microRNAs, found in wt murine hearts at E11.5-E12.0 embryonic stage. ... 38
Figure 3.3 - Quantification of cardiac phenotypes in fluorescence in embryos
microinjected with 4ng of MO-10, or MO-CT as control. Each column is the media of two comparable experiments based on the screening of at least 100 embryos. Statistic “t test” with α=0.05. ... 39
Figure 3.4 – A: Bright field observation of 72hpf embryos microinjected with miR-10a
(right) or miR-CT as control (left). The arrow points the cardiac edema. Scale bar= 200 µm. B: quantification of cardiac phenotypes in fluorescence in embryos microinjected with increasing doses of miR-10a, or miR-CT as control. Each column is the media of three comparable experiments based on the screening of at least 100 embryos. Statistic “t test” with α=0.05. On the right example of wt heart at 72hpf from embryo microinjected with miR-CT and example of a no-looped heart from an embryo microinjected with miR-10a. A=atrium; V=ventricle; scale bar=100 µm. ... 40
Figure 3.5 – Quantification of embryos showing cardiac defects after injection of Mo-Ct or MO-10a/b in Tbx5a morphants. The histogram shows the normalized media of two
rescue experiments for each sample, at least 100 embryos were analysed. T test with α=0.05 ... 41
Figure 3.6 – Alignment of mature miR-182 sequences among human, mouse and
zebrafish and relative percentage conservation of each position. ... 42
Figure 3.7 – A: Bright field observation of 72hpf embryos microinjected with miR-182
(right) or miR-CT (left). Scale bar= 100 µm.B1: dark field observation of 72 hpf embryos microinjected with miR-182, or miR-CT. Yellow arrows point to fins, red arrow points to the cardiac edema. Scale bar= 100 µm. B2: in situ hybridization of Tbx18 at 48hpf to highlight fin development in embryos microinjected with 0,5ng miR-182, or miR-CT . Scale bar= 100 µm. ... 43
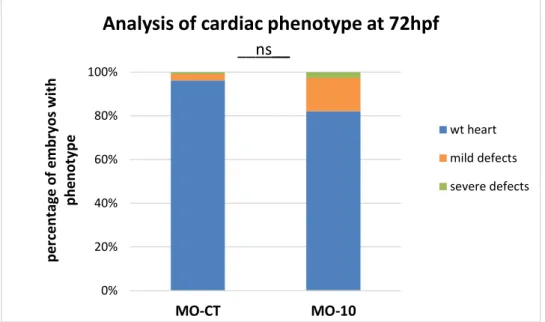
Figure 3.8 – MiR-182 overexpression causes cardiac defects. A: quantification of cardiac
phenotypes observed by fluorescence microscopy in embryos microinjected with increasing doses of miR-182, or miR-CT. Each column is the media of three comparable experiments based on the screening of at least 100 embryos. Statistic “t test” α=0.05. B1: stylized image of a zebrafish frontally positioned embryo showing how heart is
directionally organized. B2: representative images of 72 hpf Tg(Myl7:EGFP) (top) or Tg(flk1:eGFP;Myl7:RFP) (bottom) embryos injected with 0,5 ng of miR-182 mimic. A: atrium; V=ventricle; scale bar= 30µm. ... 44
v
Figure 3.9 – MiR-182 affects myocardial cell shape. A: histogram representing the
normalized cell area of ventricular myocardial cells after the microinjection of 0.5ng of miR-182, or miR-CT . Cells positioned in the outer curvature (OC) and in the inner
curvature (IC) of the ventricle were separately analysed. Analysis performed at 48hpf. B: phalloidin immunostaining on dissected hearts at 48hpf. In the selected area there is a portion of the ventricular outer curvature showing an example of subpopulation of rounded cells in miR-182 overexpressing heart (red arrow). MiR-CT: n=13; miR-182: n=11. Statistic: t test with α=0.05. Scale bar= 30 µm. ... 45
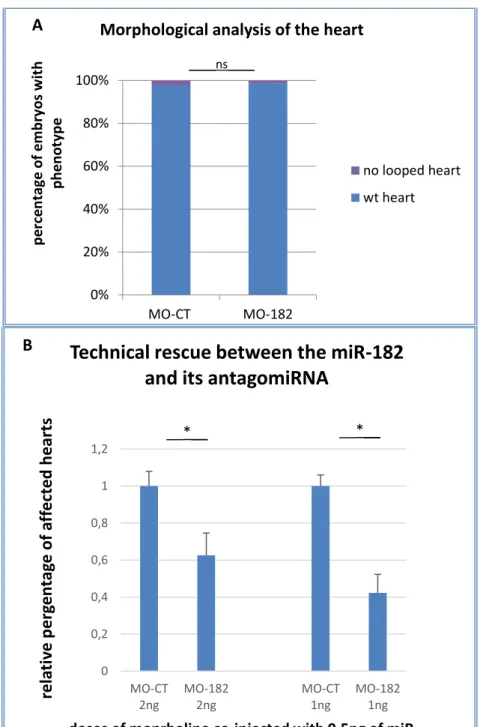
Figure 3.10 – Downregulation of miR-182 does not affect cardiac development. A
histogram showing the heart morphology analysis in miR-182 morphants. Each value is the media of two experiments where at least 100 embryos were analysed for each thesis. B: Histogram representing the technical rescue between miR-182 and its antago-miRNA. Each value is the media, in percentage, of two experiments where at least 100 embryos were analysed for each thesis. T test with α=0.05 ... 47
Figure 3.11 – MiR-182 affects the expression of cardiac markers altered in HOS phenotype- A) In situ hybridization of several cardiac markers. B) Quantifications of
different phenotypes. Statistics χ² analysis with α=0.05 ... 49
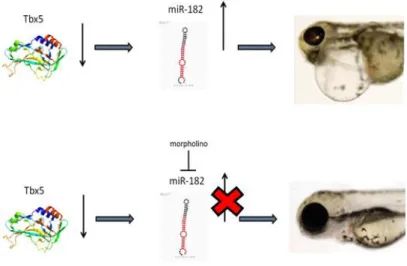
Figure 3.12 – Molecular model of hypothetical heartstring rescue by morpholino against miR-182 administration. ... 50 Figure 3.13 – MiR-182 partially rescues Tbx5a morphants. The histogram shows the
normalized media of three rescue experiments for each dose. For each sample at least 100 embryos were analysed. T test with α=0.05. ... 51
Figure 3.14 – In situ hybridization of Tbx18, Wt1 and Versican at 48hpf (frontal view), in rescue experiments performed microinjecting 1.5ng of MO-tbx5a with 0.5ng of MO-182 or MO-CT. The pattern of morphants phenotypes is compared with the one of not
injected embryos. A2:Tbx18 ISH lateral view of framed embryos in A1 to allow the bud fin observation.. Red arrows point to the signal of Tbx18 in the heart, green arrow points to the fin. B1-B2-B3= Quantifications of hybridization signals for Tbx18, Wt1 and Versican respectively. Statistics χ² analysis with α=0.05. ... 52
Figure 3.15 – Quantification of cardiac phenotypes in embryos microinjected with low dose of miR-182, or miR-CT together with low dose of MO-tbx5a. Each column is the
media of two comparable experiments based on the screening of at least 100 embryos. Statistic “t test” α=0.05 ... 53
Figure 3.16 – The morpholino against miR-182 is able to partially rescue the heartstring phenotype in Tbx5a mutants. A: example of mutant embryo microinjected with MO-182,
or MO-CT. The red circles highlight the lack of pectoral fins in both heartstring and recued embryos. B: The histogram shows the normalized media of two (8ng of mopholino and 4ng of morpholino) or three (1ng of morpholino) rescue experiments for each dose in Tbx5as296 mutants, 20-50 embryos were analysed, depending on the stochastic number of
homozygous we obtained for each cross. Statistic T test with α=0.05. ... 54
Figure 3.17 – MO-182 causes mild heart defects in dosage dependant manner in Tbx5a heterozygous mutants – Histogram representing heart morphology analysis in Tbx5a HET.
vi
Figure 3.18 – Schematic representation of the 3’-UTR of Tbx5b. Red circles show the two putative seed match for miR-182. Image from TargetScanFish. ... 57 Figure 3.19 – Histogram representing cardiac phenotypes obtained after microinjection of increasing doses of Tbx5b. As comparison the phenotypes obtained after
microinjection of the highest dose of RFP are shown. At least 100 embryos for each thesis were analysed. Statistics χ² analysis with α=0.05. ... 58
Figure 3.20 – Tbx5b does not rescue heart defects due to miR-182 overexpression –
Histogram representing the quantification of cardiac phenotypes in embryos
microinjected with 0.25ng of miR-182 and increasing doses of Tbx5b mRNA, or RFP as control. Each value is the media, in percentage, of two experiments where, for each case, at least 100 embryos were counted. T test with α=0.05 ... 59
Figure 3.21 – Chosen classes for eye phenotype description in rescue experiment of Tbx5b and miR-182 microinjection. ... 59 Figure 3.22 – Quantification of eye phenotypes in embryos microinjected with 200pg of Tbx5b mRNA, or RFP mRNA and 0.25ng of miR-182 or miR-CT. Each value is the media, in
percentage, of two experiments where at least 100 embryos were counted for each thesis. T test with α=0.05 ... 60
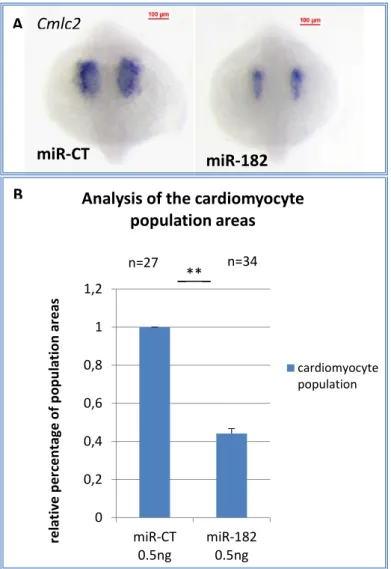
Figure 3.23 – MiR-182, miR-183 and miR-96 detection using LNA at 5dpf (Kloosterman et al., 2006). ... 61 Figure 3.24 – MiR-183/182-96 cluster amplified by PCR from mixed cDNA samples of zebrafish. ... 62 Figure 3.25 – MiR-182 overexpression causes a reduction of myocardial cell populations.
A: in situ hybridization of cmlc2 in embryos microinjected with 0.5ng of 182, or miR-CT. Scale bar=100 µm. B: Calculation of cardiomyocyte population area at 18 somites. Results are normalized on the control. T test with α=0.05 ... 63
Figure 3.26 – MiR-182 overexpression does not significantly affect the cardiac
population of Nkx2.5 expressing cells. A: Examples of in situ hybridization with nkx2.5 on
14 somites stage embryos microinjected with 0.5ng of miR-182, or miR-CT. Scale bar= 100 µm. B: Relative quantification of the population areas of nkx2.5 probe expressing of cardiomyocytes; Statistic t test with α=0.05. ... 64
Figure 3.27 – A: Examples of in situ hybridization with cmlc2 on 14 somites stage
embryos microinjected with 0.5ng of miR-182, or miR-CT. Scale bar= 100 µm. B: Relative
quantification of embryos with normal, reduced or absent expression of cmlc2. Scale bar= 100µm; statistic t test with α=0.05 ... 65
Figure 3.28 – MiR-182 affects myocardial cells proliferation. Bromodeoxyuridine (BrdU)
assay of cardiomyocyte cells undergoing DNA replication spanning 36hpf to 48 hpf period of cardiac development. A: double labelled cell quantification. Statistic t test with α= 0.05. B) immunostaining with anti-BuDR antibody (green) in dissected Tg(Myl7:nuDsRED) hearts at 48hpf, after the microinjection of miR-182, or miR-CT. Blu arrows point to examples of cardiomyocytes that incorporated the BuDR in the red nucleus. ... 66
Figure 3.29 – MiR-182 affects myocardial cells migration during their route toward the midline of the embryo. A: in situ hybridization of cmlc2 at subsequent developmental
stages of early cardiogenesis, in embryos microinjected with miR-182 or miR-CT as control. Scale bar= 100µm. B1: histogram representing the relative movement of
vii myocardial cells toward the middle line in embryos microinjected with 182, or miR-CT. Each column is the normalized averaged value of 30 embryos. Statistic t test with α=0.05. B2: histogram representing quantitatively the averaged segment reverted in µm, connecting the middle point of the two myocardial precursors populations. More little is the connecting segment and more close are the opposite myocardial populations. Each column is the average of 30 values. Statistic t test with α=0.05 ... 67
Figure 3.30 – Confocal imaging of 18 somites stage Tg(Flk1:EGFP) embryos microinjected with miR-182 or miR-CT (dorsal view). The red rectangles circumscribe the cardiac field.
Scale bar=50µm. ... 68
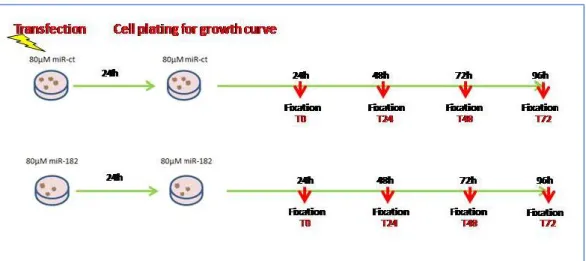
Figure 3.31 – In situ hybridization with fn1 probe on embryos microinjected with miR-182 or miR-CT. Scale bar=100µm ... 68 Figure 3.32 – Experimental plan for in vitro proliferation assay in HL1 cells. ... 69 Figure 3.33 – MiR-182 affects migration of HL1 cells in vitro. A: photo showing migration
over time of HL1 cells transfected with 80nM of miR-182, or miR-CT (a plate’s particular). Rectangles define the cell free area between the two cellular frontlines. On the right: quantification of the normalized free area between the two cellular frontlines, as indicator of cell migration. Data relative to three experiments are reported. T test with α=0.05 ... 70
Figure 3.34 – MiR-182 affects cardiomyocyte differentiation of P19CL6 cells. qRT-PCR
analysis of miR-182 and cardiac markers in P19CL6 differentiating cells (NT T3, NT T5) compared to P19CL6 in growth medium (T0) and in P19CL6 cells transfected with 80 nM of miR-CT (Ct T3, Ct T5) or miR-182 (miR-182 T3, miR-182 T5). Results are standardized against HPRT for genes, and against U6 for miRNA. T test with α=0.05. NT= not
transfected, T3, T5= 3 and 5 days after transfection in DM. ... 71
Figure 3.35 – Putative Tbx5 binding sites in the promoter of miR-183/182/96 murine cluster. A: genomic context of miR-183/96/182 cluster and part of its promoter. The
sequence of each mature microRNA is represented by a red rectangle. The violet
rectangles represent the response elements for Tbx5 and Gata4 in the cluster promoter. B: box summarizing the specific positions of Tbx5 binding sites in the genomic context of the miR183/96/182 murine promoter. ... 73
Figure 3.36 – MiR-183/182/96 cluster location in mouse genome. ... 73 Figure 3.37 – Luciferase assay for miR-183/182/96 cluster promoter. HL1 cells were
transfected with 200ng of the pGL3 empty vector orpGL3-miR-182 promoter plasmid together with different doses of Tbx5 or GATA4 expressing plasmid, or the corresponding empty plasmid as control in the presence of renilla plasmid as internal standard.
Luciferase activity was quantified by Dual Luciferase Reporter assay (Promega). ... 74
Figure 3.38 – A: Flow chart of in silico analysis for the identification of miR-182 putative
targets, conserved between zebrafish and mouse. B: functional profiling of gene list obtained from in silico analysis on putative target genes of miR-182. In red are boxes of gene ontology classes; in green are boxes of pathways classes; in dark blu are boxes of regulatory motifs classes and in light blu are boxes of interactions among poteins. ... 76
Figure 3.39 – Cardiac genes putatively targeted by miR-182- Venn diagram shows the
intersection among putative cardiac miR-182 targets belonging to different 4 cardiac KEEG pathways. On the right: panel containing the 12 genes common to all pathways.
viii Green ovals highlight genes deregulated in HOS patient and related to other arrhythmic syndromes in human ... 77
Figure 3.40 – Conserved site of miR-182 in isl1 3’-UTR of vertebrates. Image obtained from targetSCAN tool. ... 79 Figure 3.41 – A: in situ hybridization of isl1 at 14 somites. Scale bar=100µm. B: in situ
hybridization of isl1 at 18 somites and relative histogram representing the phenotype observed. N=39 embryos counted for miR-CT and n°37 counted embryos for miR-182. χ² test with α=0.05. Scale bar=100µm. ... 80
Figure 3.42 – Normalized quantification by ddPCR of islet-1 in dissected hearts from embryos microinjected with miR-182 or miR-CT as control. ... 81 Figure 3.43 – Normalized quantification by ddPCR of dHAND in dissected hearts from embryos microinjected with miR-182 or miR-CT as control. ... 82 Figure 3.44 – MiR-182 transient overexpression affects heart rate. Histogram showing
the distribution of the heart rate classes analysed. Each column is the media of three comparable experiments, performed counting at least 100 embryos. T test statistic is performed on the numbers of embryos that show wt heart rate present in each
treatment. ... 83
Figure 3.45 – MiR-182 overexpression has repercussion in stroke volume. Histogram
representing the stroke volume of embryos microinjected with miR-182 (n=16), or miR-CT (n=8), at 72hpf. T test with α= 0.05 ... 84
Figure 3.46 – Analysis of heart rate in 6dpf embryos microinjected with miR-CT- A: The
panel A shows the first image of the stack, used to place two ROIs including atrial (white traces) and ventricular (red traces) portions. B: The layout presents the time course, of the pixel mean value in the ROIs (atrium=white line and ventricle=red line), during the beating. C: Magnification of the layout B. D: Cartesian graph showing the constant heart rate... 85
Figure 3.47 – MiR-182 transient overexpression affects heart rate- A1/B1: Illustrative
panels used to place two ROIs including atrial (white traces) and ventricular (red traces) portions. A2/A4: Clear-cut changes in rate can be noted in traces. A3: Magnification of trace A2. B2: Bursts of activity interrupted by intervals of inactivity, during which a slow relaxation occurs. The yellow circle circumscribes the portion shown in B3 to highlight the incomplete atrial relaxation. ... 86
Figure 3.48 – MiR-182 affects heart rate. Heart rate recorded by a photomultiplier in
miR-CT microinjected embryo (A) and in miR-182 microinjected embryo (B). The activity is regular in the first case whereas is bursting and irregular inside bursts in the second one. ... 87
Figure 3.49 – MiR-182 affects calcium handling. Intracellular calcium changes during the
heart cycle in a control embryo microinjected with miR-CT (A) and a miR-182 injected embryo (B). The mechanical events were blocked by butanedione 15mM and the changes in the intracellular calcium concentration were signalled by the modified calmodulin-GFP of Tg(Myl7:gCamp) embryos and recorded by a photomultiplier. In the signal from the treated embryo an episode of arrhythmia is marked with a yellow bracket. ... 88
Figure 3.50 – MiR-182 affects calcium flux- 1: Calcium distribution during spontaneous
ix 48 hpf. 1A) A single image of the time-lapse stack. The fluorescence emission intensity was measured along the profile indicated by the red bar and displayed in 1B. 1C) The amplitude of the peak indicated by the red arrow in 1B (in arbitrary units) is plotted as a function of time. 2: Calcium distribution during spontaneous electrical activity in the absence of mechanical dynamics, in a miR-182 microinjected zebrafish embryo at 48 hpf. The panels 2A, 2B and 2C can be read as in 1. ... 89
Figure 3.51 – BayK treatment rescues the depressed average heart rate, in miR-182 overexpressing embryos. A: histogram representing heart rate analysis in miR-182
overexpressing embryos (Fish1 to Fish10), before and after treatment with BayK drug. B: averaged data with statistics t test with α=0.05. ... 91
Figure 3.52 – MiR-182 overexpression affects the expression of some calcium channel genes. Normalized quantification by ddPCR of calcium channels in dissected hearts from
embryos microinjected with miR-182 or miR-CT. ... 92
Figure 3.53 – MiR-182 decreases the level of Cacnb4b in the heart of zebrafish A:
Examples of in situ hybridization with Cacnb4b at 48hpf stage embryos microinjected with 0.5ng of miR-182, or miR-CT. Scale bar= 100 µm. B: Relative quantification of embryos with downregulated expression of Cacnb4b. The histogram is the media of 3 experiments. Scale bar= 100µm; statistic t test with α=0.05 ... 93
Figure 3.54 – Relative expression by qReal time PCR of Cacnb4 in HL1 cells transfected with miR-182 or miR-CT. ... 94 Figure 3.55 – Map of the gateway plasmid used for the generation of the Tg(Myl7:GAL4, Myl7:EGFP) transgenic line. ... 96 Figure 3.56 – A fluorescence image of Tg(Myl7:GAL4) transgenic embryo at 5dpf. Bright
and dark fields are shown. Scale bar= 100µm ... 97
Figure 3.57 – Map of the gateway plasmid used for the generation of
theTg(Sce.4XUAS:miR-182, Cry:EGFP) transgenic line ... 98 Figure 3.58 – A fluorescence image of a Tg(UAS-miR-182) embryo at 5dpf. Bright and
dark fields are shown. Scale bar= 100µm... 99
Figure 3.59 – Map of the gateway plasmid used for the generation of the
Tg(Sce.4xUAS:miR-182 sponge, Cry:EGFP) transgenic line. ... 100 Figure 3.60 – A fluorescence image of a Tg(Myl7:182) transgenic embryo at 5dpf (wt heart). Bright and dark fields are shown. Scale bar= 100µm. ... 101 Figure 3.61 – A: Fluorescence image of a Tg(Myl7:Gal4) embryo (right) compared with a sibling Tg(Myl7:182) transgenic embryo (left)at 6dpf. Scale bar= 100µm. B: Home-made
explicative drawing of wt heart (top) and a Myl7:182 (down) in lateral view. ... 101
Figure 3.62 – The transgenic line Myl7:182 show events of arrhythmias. A1: Layout
showing the heart rate over time in Tg(Myl7:Gal4) embryo, as control, and Tg(Myl7:182) embryo at 6 dpf. A2: histogram showing the averaged value of heart rate of embryos in A1, with statistics T test. B: traces showing the trend contraction of a Tg(Myl7:Gal4) embryo compared to a Tg(Myl7:182) embryo. ... 102
Figure 3.63 – The stable overexpression of miR-182 impacts the embryo survival rate.
Curves were compared by long-rank test analysis. The total number of analysed embryos were as follows: GAL4 n = 20, Myl7:182 n = 30 P=0,0019. ... 103
x
Figure 3.64 – Fluorescence image of a Myl7:sponge182 transgenic embryo at 5dpf.
Bright and dark fields are shown. Scale bar= 100µm ... 104
Figure 3.65 – Functional validation of miR-182 dysregulation in the transgenic lines. A:
Histogram representing the effect of miR-182 0,5ng microinjection in the transgenic line Tg(Myl7:sponge182). B: Histogram representing the effect of miR-182 0,5ng
microinjection in the transgenic line Tg(Myl7:182). ... 105
Figure 3.66 – A: The presence of Myl7:sponge182 transgene decreases the cardiac defects in Tbx5a morphants. A: Histgram showing the percentage of reduction on hst
phenotype reduction after of 1,5ng of MO-Tbx5a microinjection, in the embryos that constitutively express the sponge of miR-182, compared with the Gal4 siblings. B:
Histogram showing the all classes of cardiac phenotypes observed microinjecting the MO-Tbx5a 1,5ng in Tg(Myl7:sponge182) embryos and Tg(Myl7:Gal4) siblings. ... 106
Figure 3.67 – MiR-182 overexpression decreases the level of Cmlc2. Normalized
quantification by ddPCR of cmlc2 in dissected hearts from embryos microinjected with miR-182 or miR-CT as control. ... 107
Figure 3.68 – Schematic description of the cardiac z-disc and the adjacent structures involved in signalling. (Frank and Frey, 2011) ... 108 Figure 3.69 – Confocal imaging of sarcomere structure in Tg(Myl7:LIFEACT-GFP)
embryos after the microinjection of miR-182 (0,5ng) at 48hpf (A) and 72hpf (B). Pink and
yellow squares circumscribe the selected regions in atrium and ventricle respectively, for the higher magnifications shown next right. Scale bar: 20 µm. ... 109
Figure 3.70 – Confocal imaging of the localization of Chypher in embryos microinjected with miR-182 (B), compared to the control (A). Scale bar= 20µm ... 110 Figure 3.71 – MiR-182 overexpression does not affect skeletal sarcomere formation. Electron micrograph of skeletal muscles from control embryo microinjected with 0,5ng of
miR-CT (A). and from embryo injected with 0,5ng of miR-182 (B). Scale bar=800 nm. ... 111
Figure 4.1 – Tbx5 controls miR-182 expression through KFL4 repression. In normal
conditions Tbx5 is a positive regulator of cardiac program and a repressor of cardiac incompatible gene programs. KFL4, which is a positive regulator in cancer and neuronal programs, is actively repressed (left side). In HOS pathological condition, the
downregulation of TBX5 activity de-represses KFL4 which in turn upregulates miR-182 cluster expression. ... 118
I
NDEX OF
T
ABLES
Table 1.1 – Comparison in the timing of cardiogenesis stages in different animal model.
Image from (Fishman and Chien, 1997) ... 3
Table 1.2 – Clinical description of abnormalities found in Holt-Oram patients. Image from
Bossert et al., 2003. ... 11
Table 2.1 – List of RNA oligonucleotides (morpholino and miRNA mimics) used in this
study ... 23
xi
Table 2.3 – List of oligos used for gateway technology ... 33 Table 3.1 – Differentially expressed (DE) microRNAs resulting from miRNA profiling of
RNA samples, extracted from E11.5-E12.0 hearts isolated from wt, CRE, Tbx5lox/+ e
Tbx5del/+ mice. ... 36
Table 3.2 – Percentage of embryos with wt fins, and relative sub classification, in the total amount of a population obtained by the cross of two Tbx5as296 mutants. ... 55
Table 3.3 – Principal cardiac gene ontology classes of putative targets of miR-182
A
BSTRACT
The formation of the mature vertebrate heart with separated chambers and valves involves a complex orchestration of gene expression. Numerous genes are critical for cardiac morphogenesis, although their exact functions and their integration with other cardiac regulators is still not completely understood (Harvey, 2002).
The T-box gene tbx5 encodes a key transcription factor for vertebrate heart development (Goetz et al., 2006; Horb and Thomsen, 1999). Tbx5 function in the heart is gene dosage sensitive, as both haploinsufficiency and gene duplication give rise to Holt−Oram syndrome (HOS). HOS is a highly penetrant autosomal dominant disease characterized by congenital malformations of the heart and upper limbs, which are two sites of Tbx5 expression (Basson et al., 1997; Hatcher and Basson, 2001; Pierpont et al., 2007). Nonetheless, the molecular mechanisms accounting for gene dosage sensitivity are not completely clarified. Mice heterozygous for mutations in Tbx5 display many of the phenotypic abnormalities of individuals with HOS (Bruneau et al., 2001; Mori et al., 2006). Comparable defects are seen in the zebrafish Tbx5 mutant heartstrings, suggesting that Tbx5 expression and function have been conserved throughout vertebrate evolution (Ahn et al., 2002; Garrity et al., 2002). Besides TFs, microRNAs (miRNAs) play key roles in heart development and cardiac diseases (Cordes and Srivastava, 2009; Liu and Stainier, 2010; van Rooij et al., 2006) TFs and miRNAs comprise two major layers of gene regulatory networks with strictly interconnected activities: TFs control miRNA expression and many miRNA targets are TFs. There is increasing evidence that TFs and miRNAs can work cooperatively through mutual cross-regulation (Yu et al., 2008). In line with this hypothesis, in this thesis work we performed by NGS the miRNA profiling on RNA extracted from E11.5-E12.0 hearts isolated from WT, CRE, Tbx5lox/+ and Tbx5del/+ mice. These analyses allowed the identification of several miRNAs up or downregulated as a consequence of Tbx5 modulation. We focused our attention on miR-182, found to be upregulated in HOS mouse hearts. In order to functionally investigate the effect of miR-182 on heart development we decided to use zebrafish and performed both gain- and loss-of-function experiments (GOF and LOF), in transient as well as in stable deregulation. We demonstrated that miR-182 overexpression in zebrafish embryos resulted in a dose-dependent cardiac defects. In-situ
2 hybridization experiments revealed that the miR-182 overexpression was able to affect patterning of the pools of cardiac progenitor cells during early stages of development. Furthermore, downregulation of miR-182 by morpholino microinjection was able to partially rescue the HOS phenotype in zebrafish Tbx5 knockdown embryos and in Tbx5 mutants.
Investigating the effects of miR-182 overexpression on heart beating, we observed strong arrhythmias in a high percentage of miR-182 overexpressing embryos. Interestingly, the miR-182 overexpression caused an alteration of calcium flux suggesting an impact of miRNA activity on calcium handling. In line with this observation, by digital droplet PCR, we demonstrated that some calcium channel genes, identified as putative targets of miR-182, are effectively downregulated in dissected hearts of embryos microinjected with the miR-182. We also revealed that transgenic lines for the stable cardiac deregulation of miR-182 develop cardiac defects comparable with defects generated by transient miR-182 modulation.
3
1
I
NTRODUCTION
1.1
C
ARDIOGENESISThe heart is the first functional organ to form during development. The early stages of cardiogenesis are common for all vertebrates (Table 1.1) (Harvey, 2002; Srivastava and Olson, 2000) and the differences that animals show in structure, morphology and molecular biology are mainly due to the transition from aquatic to terrestrial environment.
Table 1.1 – Comparison in the timing of cardiogenesis stages in different animal model. Image from (Fishman
and Chien, 1997)
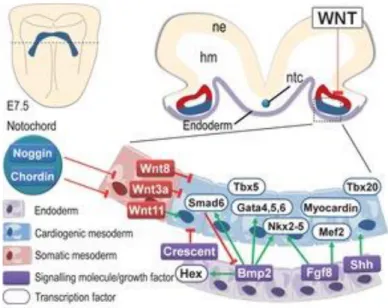
The heart of fish has one atrium connected to one ventricle with one valve that separates them; amphibians have two atrial chambers separated by a septum and only one ventricle. Terrestrial vertebrates, that lost the dependence to water for gass exchange, have two atria and two ventricles with a septum that divides the oxygenated blood from the deoxygenated one. Despite the dramatic physiological differences, interestingly, the molecular circuits that rule heart development in vertebrates share several genes. These genes encode for regulatory proteins such as epigenetic factors and transcription factors that are expressed in the same tissue and with the same timing during embryogenesis in different vertebrate species (van Weerd et al., 2011). In fact, cardiogenesis in vertebrates is based on sequential multistep of gene activation that occurred after gastrulation, as shown in Figure 1.1 where the phases of heart differentiation of chicken and mouse are perfectly overlapped.
4
Figure 1.1 – Molecular players involved in sequential steps of heart morphogenesis, from specification to
differentiation of myocardial precursors. Each step is related to a specific phase of gestation in mouse, perfectly overlapped with heart formation in chicken. Image from (Abu-Issa and Kirby, 2007).
While transcription factors work for cellular progression, epigenetic factors cooperate in the chromatin remodelling to hide or make available specific portion of the genome, like Baf60c (Lickert et al., 2004).
1.1.1 Cardiogenesis in mouse
The heart is prevalently a mesodermal organ, except for neural crests involved in the formation of cushions (Devine et al., 2014; Plein et al., 2015). The neural crests are cells bilaterally located near the ectoderm that migrate during embryo development before the differentiation into derivatives (Green et al., 2015).
In mouse model the presumptive heart field has been set in a little group of cells of the epiblast that exhibit an epithelial-to-mesenchymal transition, discovered by experiments of cell transplantation. They enter into the cranial portion of the primitive streak, moving proximally and anteriorly (Abu-Issa and Kirby, 2007; Tam et al., 1997), and express the essential transcription factor Mesp1 (Saga et al., 1999).
Heart commitment is established after gastrulation with the formation of a celomatic cavity at the two extremities of the embryo. The celomatic cavity divides the splanchnic mesoderm, which will give rise to the heart, from the somatic mesoderm (Buckingham et al., 2005; Fishman and Chien, 1997). This specification occurs thanks to the action of players
5 belonging to BMP, FGF and Wnt cascades from neighboring embryonic tissues (Marvin et al., 2001; Schultheiss et al., 1997; Sugi and Markwald, 1996)
(
Figure 1.2).
Figure 1.2 – Transversal section of murine embryo at E7.5 in the level of pre-cardiac field. Different colours
were used to highlight different tissues and for each one is presented the main set of molecular players with relative interactions. Image from (Rana et al., 2013).
The cells of the two populations of myocardial precursors exhibit a columnar shape and express the transcription factor Nkx-2.5, which leads to cardiac determination. This gene is highly conserved from Drosophila (where it is called tinman), to mammals and its expression reflects the vitality of the embryo (Bodmer, 1993, 1995; Lyons et al., 1995). Nkx-2.5 cooperates with the cofactors GATA4 (Bodmer, 1993, 1995; Lyons et al., 1995). Nkx-Nkx-2.5 cooperates with the cofactors GATA4 (Durocher et al., 1997)and Tbx5 (Hiroi et al., 2001; Linhares et al., 2004) to promote cardiomyocyte differentiation. These multipotent progenitors will give rise all cardiac cell types (Figure 1.3). At this stage, the myocardial precursors are separated into two distinct populations: the anterior populate which will give rise to the atrium, and the posterior portion, which will give rise to the ventricle. The precursors of endocardial cells localize between the developing myocardium and the endoderm below (Abu-Issa and Kirby, 2007; Yelon et al., 1999).
In the 2000’s a portion of anterior progenitors of the splanchnic mesoderm, that is Nkx2.5 negative and forms the arterial pole, called secondary heart field was discovered
6 (Dyer and Kirby, 2009). In mammals the anterior heart field is involved also in right ventricle development (Zaffran et al., 2004).
The secondary heart field expresses different markers than the primary heart field such as Tbx1, Isl1 and members of FGF family (Cai et al., 2003; Ilagan et al., 2006; Xu et al., 2004). The abolishment of BMP signal impedes the formation of the first heart field meanwhile Wnt/βcatenin signal is required for the formation of secondary heart field and heart looping (Hami et al., 2011a).
Figure 1.3 – Cardiac cells derivatives from the multipotent precursor under the control of different signals of
differentiation. Image from (van Weerd et al., 2011).
The pre-cardiac cells migrate toward the midline of the embryo where they form the cardiac ring and the following phase is a dramatic rearrangement of myocardial cells to form the cardiac tube, which will acquire polarity and the mechanical property of contraction. When the heart tube is formed, the ventricle and atrium began to differentiate in a process called cardiac looping. Cardiac looping establishes the first visible right-left morphological differentiation into the organ and due to signals that are conserved in vertebrates, establishes the right-left axes of whole embryo (Capdevila et al., 2000; Kathiriya and Srivastava, 2000). The looping is followed by the remodelling phase to define
7 the separate chambers and the valves (Figure 1.4) (Manner, 2009; Stennard and Harvey, 2005).
Figure 1.4 – Morphological developmental stages of mammalian heart: A) E7.75 stage where coelom
separates splanchnic mesoderm from somatic mesoderm. B) Cardiac progenitors move ventrally to form heart tube. C) From E8.5-E10.5 heart tube elongates and loops into a rightward spiral. D) Remodelling phase and sequential trabeculae formation. Image from (Stennard and Harvey, 2005).
1.1.2 Cardiogenesis in zebrafish
Lineage tracer with caged fluorescein studies in zebrafish, defined that myocardial and endocardial chamber progenitors are organized within the blastula at 40% epiboly. Atrial and ventricular precursors localize within the first four tiers of blastomeres; by contrast endocardial precursors at this stage appear intermixed (Keegan et al., 2004). The cardiac mesoderm forms as previously described for mouse. Also in zebrafish, the activation of the conserved cardiac transcription program with GATA, Hand2, T-box proteins, and Nkx2.5 specifies cardiac progenitors within the anterior lateral plate mesoderm (ALPM) that are visible in two distinct pools (Lu et al., 2016). The versatility of zebrafish model permitted fine description of the morphogenetic process that leads formation of the cardiac ring. Cardiac fusion begins with a phase of coherent medial movement from 14 somites, when myocardial precursors start to migrate, until 18 somites. After 50 minutes, most cells exhibit an angular displacement of less than 30° along the
8 anterior-posterior axes, behaviour classified as angular movement. In the two populations of myocardial precursors, there are also cells that do not have a net movement. Because of regional transitions to angular movement, the bilateral populations of cardiomyocytes form mirror-image arcs, ultimately encircling the endocardial precursors and creating the cardiac cone. Regional differences in the duration of movement also contribute to arc formation (Holtzman et al., 2007). The two phases are separately morphogenetic processes as demonstrated using two mutants: cloche, which exhibits the loss of endothelium including the endocardium (Liao et al., 1997; Stainier et al., 1995); and mil, which causes cardia bifida (Kupperman et al., 2000). The first phase of cardiac fusion, but not the second, requires myocardium-endoderm interactions, whereas the second phase of cardiac fusion, but not the first, requires myocardium-endocardium interactions (Holtzman et al., 2007).
In conjunction with looping, the heart exhibits an expansion of the two chambers that creates inverse concavity between the atrium and the ventricle. The process is known as ballooning; it occurs due to myocardial cell proliferation within the heart and by the addition of new cell populations at the two cardiac extremities, the arterial and venous poles (de Pater et al., 2009; Hami et al., 2011b).
Embryological studies in zebrafish (Huang et al., 2011; Yelon and Stainier, 1999) and genetic studies in mouse (Moss et al., 1998; Xavier-Neto et al., 1999), highlight the presence of Retinoic Acid (RA) as a trigger of chamber formation; particularly RA signalling promotes atrial development and ventricular expansion (Stainier, 2001). In zebrafish, the disruption of RA signalling, as a consequence of either deficiency or surplus of RA, leads to cardiac defects. For example, mutations in Cyp26a1 and Cyp26c1 genes (which encode for enzymes involved in RA degradation) cause out-flow tract defects trough the loss of ventricular cardiomyocyte polarity, and the inability of secondary heart field progenitors to colonise the arterial pole (Rydeen and Waxman, 2016). Instead, knockdown experiments of the gene aldh1a2, responsible of the RA synthesis, demonstrated that this signalling is essential for valvulogenesis (hPradhan et al., 2016).
The complete map of molecular actors implicated in cardiogenesis is still not completely understood. Slight perturbations in this system can cause congenital heart diseases (CHD), the most common human birth defect, estimated to affect 1% of worldwide population (Hoffman and Kaplan, 2002).
9 Briefly, NKX, MEF2, GATA, TBX and HAND are the set of evolutionary conserved transcription factors (TFs) that regulate the cardiac cell fate, the expression of protein forming the sarcomeres and the development of cardiac structures. Furthermore, these transcription factors also control each other’s expression in a complex molecular loop to enforce the cardiac program (Bruneau, 2002; Olson, 2006b). However, during last years, the scientific community started to evaluate other parameters besides the TF modulation, considering the organogenesis as a combinatorial system where genetic and mechanic events have both essential roles. An example is the blood flow, which contributes to chamber formation and directs endocardial cells to proliferate and to acquire specific shapes in different spatial regions. This process is involved in endocardial chamber ballooning independently of VEGF signalling and without the addition of external cells. It is suggested that the blood flow allows a new level of communication between endocardium and myocardium (Dietrich et al., 2014), also promoting ventricular cell enlargement and elongation (Auman et al., 2007). The opposite effect is exerted by the myocardial contraction, which promotes the reduction of ventricular cell elongation and size (Auman et al., 2007). From these and other experimental evidence, a more consolidated idea emerged: cardiac cell shape and chamber formation (in regards to curvature) are related not only to the presence or to absence of specific genes, but is due to a balance of biomechanical forces and external communication. It was demonstrated that the intra-cardiac fluid forces play a role in cardiogenesis and are considered as epigenetic factors (Hove et al., 2003). In fact, endothelial cells are sensitive and respond to changes in flow direction (Ostrowski et al., 2014) thanks the exhibition of recently discovered mechanotrasducers such as ion channels (Folgering et al., 2008) or proteoglycan/glycoprotein layer-the glycocalyx (GCX) (Tarbell et al., 2014). Furthermore, it is not so uncommon that mutations in genes involved in electrophysiological processes are responsible of morphological defects in heart development. For example, the downregulation of the gene Cacnb2, coding for the beta2 subunit of L-type calcium channels, causes cardiac looping defects, suggesting that in zebrafish this gene is required not only for correct myocardial contraction but also in morphogenesis (Chernyavskaya et al., 2012).
10
1.2 TBX5
Tbx5 is a member of the T-box transcription factor family. The T-box family members are characterized by the presence of a T-box binding element (TBE), a DNA-binding domain of approximately 200 amino acids (Kispert and Hermann, 1993). Tbx5, a key gene of heart development in vertebrates (Goetz et al., 2006; Hatcher et al., 2001; Horb and Thomsen, 1999)has a T-box domain composed by seven-stranded β barrel domains closed by a β sheet, a poorly conserved N-terminal region, a trans-activation domain and two nuclear localization sequences (Stirnimann et al., 2010; Zaragoza et al., 2004). Tbx5 preferentially acts as a monomer and is expressed during early stages of vertebrate cardiogenesis together with other transcription factors thanks to combinatorial interactions (Durocher and Nemer, 1998). In cultured cell lines analysis of the Tbx5 interactome reveals a synergic activation of cardiac genes (Hiroi et al., 2001; Plageman and Yutzey, 2006; Wang et al., 2011; Zhou et al., 2012) that are essential during heart development. In collaboration to Baf60c (Lickert et al., 2004), which recruits BAF chromatin remodelling complexes, and in collaboration to the histone deacetylase 3 Hdac3 (Lewandowski et al., 2014), Tbx5 is a crucial player in epigenetic mechanisms involved in transcriptional regulation of cardiac organogenesis. Until 2016, Tbx5 was considered as an “activator” of gene expression but the interactome performed by Waldrom et al. demonstrated that Tbx5 can act also like repressor cooperating with NuRD complex. Phylogenetic analysis showed that the TBX5-NuRD interaction domain is an acquisition of evolution which parallels the appearance of cardiac septation (Waldron et al., 2016). Specifically for 4-chambered hearts, Tbx5 coordinates the septum position specifying left/right ventricles (Takeuchi et al., 2003) and after heart formation, its expression has to be confined to the posterior sinoatrial segments for proper chamber development (Liberatore et al., 2000).
The importance of Tbx5 in cardiac cell fate was also demonstrated using in vitro experiments in which fibroblasts were reprogrammed to myocardial cells (Ieda et al., 2010; Qian et al., 2012).
Mutations in Tbx5 are responsible for the human Holt-Oram syndrome (HOS), a rare genetic disorder with complete penetrance and an incidence of 1:1000 living births (Basson et al., 1999; Pierpont et al., 2007). The disease is classified as heart-hand type 1 syndrome and it is the most frequent among the heart-hand diseases. Patients show skeletal
11 anomalies of upper limb and cardiac malformations. Frequent cardiac disorders are ostium secundum, atrial septal defect (ASD), ventricular septal defect (VSD), electrocardiographical abnormalities such as events of atrioventricular block. The common orthopedic signs are: absent or abnormal radius, anagesis of dumbs, phocomelia and upper limb-transverse elements missing (Bossert et al., 2003) (Table 1.2).
Table 1.2 – Clinical description of abnormalities found in Holt-Oram patients. Image from Bossert et al., 2003.
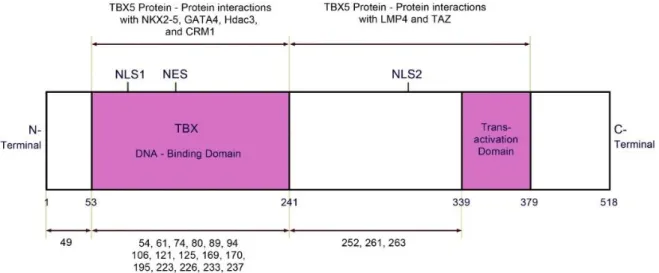
The examination of HOS phenotype is complicated by large variations in malformation severity, even among family members with an identical TBX5 mutation. The reasons for this are still unknown. The genetic analysis of HOS patients revealed different kind of mutations that lead to HOS phenotype, from missense mutations to micro-deletion/insertion in Tbx5 locus (Figure 1.5). This analysis suggests that the morphological defects could be due to not only to how Tbx5 recognizes the T-box consensus elements in the genome, but also due to alterations in the protein-protein interactions of Tbx5 and other cofactors of the basal complex during the promoter commitment (Al-Qattan and Abou Al-Shaar, 2015). The created unbalance might decrease the activity of Tbx5 or also increase, that is however a pathological state as it is suggested by cases of Holt-Oram
12 patients, where functional in vitro analysis demonstrated Tbx5 gain of function events (Hatcher and Basson, 2001; Kulisz and Simon, 2008).
Figure 1.5 – Schematic representation of TBX5 protein domains and mutations discovered with relative
position in the sequence. The majority localized in the DNA- binding domain. NLS1= nuclear localization segment 1, NLS2= nuclear localization segment 2, NES= nuclear export segment. Image from (Al-Qattan and Abou Al-Shaar, 2015).
These data derive from Tbx5 sequencing based on mutational analysis of HOS patients who strictly adhere to established HOS diagnostic criteria and does not consider variants derived by non-coding mutations. However, recent data from genome wide association studies demonstrated that Tbx5 is controlled by a modular system of cis-regulatory elements that collectively recapitulate the endogenous expression pattern of Tbx5 and whose alterations affect Tbx5 expression in specific cardiac domains (Smemo et al., 2012). These findings suggest that potentially deleterious genetic variations within Tbx5 regulatory sequences might lead to cardiac specific phenotypes, decoupling the heart and hand phenotypes seen with Tbx5 protein-coding mutations in HOS and potentially expanding the spectrum of congenital heart defects caused by Tbx5-associated dysfunction domains (Smemo et al., 2012).
The HOS pathology is conserved among species and in mammals. The HOS phenotype can be propagated by a single Tbx5 mutant allele; the homozygous mutations lead to fetal death. Heterozygous mice display many of the phenotypic abnormalities of syndromic individuals and mouse gene expression profiling of a tbx5 allelic series demonstrated that Tbx5 could regulate, directly or indirectly, hundreds of downstream genes (Bruneau et al., 2001; Mori et al., 2006). Comparable defects are seen in the homozygous zebrafish Tbx5a
13 mutant heartstrings, in which the heart does not undergo correct ballooning and looping and the embryos do not develop the pectoral fins. In the zebrafish genome, there is a paralog gene called Tbx5b, created by a duplication event in teleost fish (Albalat et al., 2010; Parrie et al., 2013). The two Tbx5 genes are co-expressed in heart/fin/eye during embryo development but their function is not completely redundant (Parrie et al., 2013; Pi-Roig et al., 2014). Tbx5a expression starts in the lateral mesoderm at 10 hpf at bud phase of development, the last part of the gastrulation after the 100% of epiboly (Tu et al., 2009). Tbx5a is clearly detected by in situ hybridization in myocardial cell precursors, in presumptive pectoral fins field and immature eye field during the segmentation stages (Begemann and Ingham, 2000; Neto et al., 2012; Tu et al., 2009; Veien et al., 2008). During the heart organogenesis, after the formation of the heart-tube, Tbx5a is essential for looping, valve and proepicardium differentiation (Camarata et al., 2010; Liu and Stainier, 2010; Lu et al., 2008).
1.3 M
ICRORNA
SMicroRNAs are small molecules of RNA, about 22-25 nucleotides (nt) long, with a negative regulatory role in gene expression. These molecules were discovered in C. elegans in 1993 as important biological players in development(Lee et al., 1993). MicroRNAs are conserved among species (Maselli et al., 2008)and genomic analysis demonstrated that they may be located within intergenic regions as independent transcriptional units or within protein coding genes in intronic or in exonic regions (Bartel, 2004). MiRNAs can be transcribed by the RNA polymerase II, and show a methylated 5'cap and a poly-A tail like coding mRNAs (Lee et al., 2004), or by RNA polymerase III if they are located near ALU repeats (Borchert et al., 2006). Regardless of which polymerase created the microRNA, they assume a stem-loop secondary structure that is important for the next processes of maturation.
MiRNAs are frequently clustered in the genome and generate multi-cistronic primary transcripts (Lagos-Quintana et al., 2001; Lau et al., 2001). Although clustered miRNAs are usually co-ordinately transcribed, mature miRNAs which derive from a cluster can show different expression profiles due to posttranscriptional regulation (Ryazansky et al., 2011).
14 The expression of intergenic microRNAs depends on the response elements present in their own promoters (Fukao et al., 2007). Conversely, microRNAs located in introns or in exons are concomitantly expressed with their host gene, with which miRNAs often share combinatory and complementary roles for the same molecular circuit (Bartel, 2004).
After the production of the pri-miRNA, that can be longer than 1000 bp, the first step of the miRNA maturation takes place in the nucleus. This step leads to the production of a stem loop of 60-70 nt and it is carried out by the microprocessor complex formed by the endonuclease III DROSHA and the nuclear dsRNA binding domain protein Pasha (or DCGR8)(Denli et al., 2004). The microprocessor complex recognizes the secondary stem-loop structure of pri-miRNAs thanks to Pasha that anchors the ssRNA-dsRNA junction and guides Drosha to make the cleavage at ̴11 bp from the junction (Han et al., 2006; Lee et al., 2003). The formed pre-miRNA is actively translocated to the cytoplasm by the Ran-GTP/Exportin-5 nuclear (Yi et al., 2003) where it is further modified by the cleavage of the endonuclease III Dicer that removes the loop leaving a miRNA::miRNA* duplex (Hutvagner et al., 2001; Lee et al., 2003). The recognition of the pri-miRNA is not completely understood but the most accepted hypothesis is that Dicer recognizes the DROSHA cleavage and not the stem loop arrangement. While the processing of DROSHA is precise, Dicer can cut in different closed positions to generate 5’-isomiRs. This last step is important to amplify the spectrum of miRNAs targets generating a more intricate net of molecular connections in the miRNA’s gene regulation (Ma et al., 2016). Dicer, with TRBP (double-stranded RNA-binding domain proteins), PACT (protein activator of PKR) and a member of the Ago protein family, is part of the Risc Loading Complex (RLC) that mediates the charge of the mature miRNA to the RISC complex (Tang, 2005). The mature miRNA is charged as double-stranded molecule on the RISC complex, which is able to choose which strand of the miRNA will be functional to recognize the targets. This selection is based on differences in thermodynamic stability between the two strands of the miRNA (Khvorova et al., 2003; Schwarz et al., 2003).
The functional microRNAs bind the mRNA targets through RNA-RNA base pairing usually in the 3’-UTR. The canonical recognition requires a perfect pairing of roughly the 6– 8 nucleotide stretch of the 5'-end of the miRNA, known as the "seed” (Bartel, 2009; Brennecke et al., 2005; Lewis et al., 2003). This sequence is generally considered necessary
15 and sufficient for functional RISC formation. In the “non canonical” ways of recognition the 3’ portion of the miRNA is also involved and this rule complicates the computational assessments of miRNA::mRNAs recognition (Bartel, 2009). In fact, recent advances in transcriptome-wide method of mapping miRNA binding sites, revealed non-canonical “seed site” recognition of miRNA-target interactions in vivo specifically regarding "nucleation bulges" and "seed-like motifs" (Seok et al., 2016), where the formation of the bulge in the seed of the microRNA put in contact two distant portions of the miRNA sequence that will be involved in the functional recognition and creates a seed-like motif. MicroRNAs determine a negative regulation of gene expression mainly by two mechanisms: the mRNA target cleavage or the mRNA translation inhibition (Dalmay, 2013). The most accepted hypothesis is that the cleavage is a consequence of the almost perfect complementarity between microRNA and its target (Bartel, 2004) but in animals the precise match is rarely found. The unique exception was discovered in 2004 for miR-196 that directly cleaves the HOXB8 mRNA (Yekta et al., 2004). The principal mechanism of negative regulation exerted by microRNAs in animals is the repression of translation. In 2006, Petersen et al. found that microRNAs associate with the polyribosomes involved in translation elongation causing a block of the translation possibly by ribosome detachment during the elongation phase. The presence of the polyA tail is crucial for this event to occur (Petersen et al., 2006). A controversial study in 2005 by Filipowich group affirmed that the microRNAs interfere with the recognition of the cap during the translation-machinery assembly (Pillai et al., 2005).
The discovery of the first miRNA in 1993 (Lee et al., 1993) established the theory of miRNAs as molecules that determine the repression of the protein formation without changing the level of the relative mRNA. In recent years, this dogma was confuted by studies demonstrating how several microRNAs mediate also the mRNA degradation (Guo et al., 2010; Selbach et al., 2008) mainly promoting de-adenylation of mRNA targets. An example of this mechanism of action is provided by miR-340, which promotes the de-adenylation and clearance of maternal mRNAs during early development of zebrafish (Giraldez et al., 2006).
Even though the identification of microRNAs is relatively young, these little molecules of non-coding RNA appear very early in evolution; in fact, microRNAs were present in our
16 metazoan ancestors (Wheeler et al., 2009). Phylogenetic studies describe a concordant increase of the number of miRNA families and the morphological complexity that vertebrates acquired, data which suggest that the origins of vertebrate complexity might depend on the evolution of novel miRNA families (Heimberg et al., 2008). The sequences of microRNAs are highly conserved, as we can observe from the alignment of orthologous microRNAs. Indeed, the majority of microRNAs have roles which are very specific and essential for biological processes. For this reason, microRNAs underwent strong selective pressure, like microRNAs related to ALU repeats (Lehnert et al., 2009). According to a more recent point of view the classic biological role of miRNAs as keepers of molecular balance can be extended considering them a defence mechanism against Alu transposition (Lehnert et al., 2009). Furthermore, there are many studies that demonstrated how microRNAs evolved in parallel with genes that changed or modified their meaning during evolution, like for example HOX genes (Tanzer et al., 2005). The authors observed multiple duplications, subsequent differential loss of miRNA paralogs, and enhanced substitution rates in some paralogs following the specific Hox cluster duplication. These last considerations enforce the idea that microRNAs shared by different species could be involved in the same molecular circuit of action.
The continuously growing evidences of the widespread impact that microRNAs can have in different aspects of cell biology, development and evolution, encourage the scientific community to increase the curiosity in the “miRNA world” as a powerful instrument to exploit in translational medicine.
1.3.1 microRNAs in cardiovascular development
MicroRNAs, like coding genes, present a tissue specific expression and during the last few decades, several microRNAs involved in cardiovascular system development were described (Liu and Olson; Small and Olson, 2011). The crucial role played by microRNAs in heart development was demonstrated by the observation that DICER cardiac deletion, at different developmental stages of cardiogenesis, leads to embryonic lethality (Zhao et al., 2007). Deletion of DICER under the control of Nkx2.5 promoter causes lethality at E12.5 in mouse due to pericardial edema and hypoplastic ventricular myocardium. The DICER deletion using 𝛼-myosin heavy chain (MHC) response element causes the disassembly of
17 cardiac contractile proteins and sarcomere damages resulting in dilated cardiomyopathy, heart failure that are the causes of postnatal death (Chen et al., 2008).
The first microRNA identified as crucial for heart development was the miR-1 whose role is conserved both in vertebrate and invertebrate cardiac differentiation (Kwon et al., 2005). Mir-1 clusters with miR-133; but, during evolution, they acquired distinct regulatory functions for cardiac and skeletal muscle proliferation and differentiation (Chen et al., 2006). These two microRNAs work in cooperation to promote mesoderm differentiation but have antagonistic roles in muscle lineage. MiR-1 promotes cardiac fates, while miR-133 represses skeletal muscle differentiation (Ivey et al., 2008). Today, part of the molecular circuit concerning these two microRNAs has been clarified and a graphical summary is shown in Figure 1.6.
18
Figure 1.6 – Function of miR-1 and miR-133 in heart and skeletal muscle. Image from (Lliu and Oslon 2003).
Other important microRNAs in cardiac development are the cluster-17~92 members. An allelic series of genetically engineered mice harbouring selective targeted deletions of individual components of the miR-17~92 cluster demonstrate the coexistence of functional
19 cooperation and specialization among members of this cluster and identify function for the miR-17~92 family in controlling axial patterning and in ventricle septation (Ventura et al., 2008). The deletion of the entire cluster leads to postnatal death.
The miR-208a, miR-208b, and miR-499 are called MyoMiRs because they are located in the introns of cardiac muscle myosin heavy chain genes MYH6, MYH7, and MYH14 respectively and their expression increases concurrently to the host genes (Callis et al., 2009; van Rooij et al., 2009; van Rooij et al., 2007). The MyoMiRs have a role in in muscle myosin content, muscle performance and identity, and they control the cardiac remodelling after cardiac stress or in pathological states (Liu and Olson, 2010). They are highly conserved among species, are present from fish to human, in fact their sequences are the only conserved intronic portion of the host genes, evidence of a high evolutionary pressure of selection (Siddique et al., 2016)
Recently miR-499 has been identified as significantly upregulated in patients with permanent atrial fibrillation targeting the small-conductance calcium-activated potassium channel 3 (SK3) (Ling et al., 2013) and Cacnb2 (Ling et al., 2017), an important subunit of the L-type calcium channel. MiRNAs have also important roles in different cardiac pathologies (Thum et al., 2008a). MiR-195 is consistently upregulated in rodent and human hypertrophic hearts. Cardiac-specific overexpression of this miRNA results in dilated cardiomyopathy and heart failure in mice as early as two weeks after birth. This result strongly support the idea that the observed upregulation of miR-195 during cardiac hypertrophy actively contributes to the disease process (van Rooij E et al. 2006). MiR-21 regulates the ERK-MAP kinase signalling pathway in cardiac fibroblasts, and its level is selectively increased in fibroblasts of failing hearts (Thum et al., 2008b). MiR-421 is significantly upregulated in RV tissue from infants with Tetralogy of Fallot syndrome and affects the expression of SOX4, a key regulator of the Notch pathway, which has been shown to be important for the cardiac outflow track.
In the last years, the interest in studying the role of microRNAs in heart diseases increased with the emerging evidences that miRNAs can be potential targets for therapeutic intervention as well as novel clinical biomarkers. Recent animal efficacy studies validate the therapeutic benefit of miRNA modulation and underscore the therapeutic value of miRNA-targeting oligonucleotides. An interesting example of the potential of
20 miRNAs as therapeutic tools is the Eulalio et al. paper showing that the exogenous administration of specific microRNAs can stimulate cardiomyocyte proliferation and promotes cardiac repair of cardiac infarcted tissue (Eulalio et al., 2012). Moreover miR-21 and miR-210, contained in IPS derived exosomes (small cell-derived vesicles that contain proteins, lipids and nucleic acids, with the potential to transfer their material via interstitial fluids (Edgar, 2016). Exosomes are involved in cell-to-cell communication so for this reason represent a new field of investigation in cardiovascular diseases. The interest is focused especially in testing their therapeutic use in myocardial injury, repair and regeneration (Zhang et al., 2017), have been shown to have a cardio protective effect reducing the apoptosis in infarcted murine heart (Kim et al., 2009; Wang et al., 2015). In particular, transgenic mice overexpressing miR-21 show a reduced infarcted area after heart failure, as result of the suppression of PTEN and Fas Ligand expression which are strongly induced as a consequence of ischemia (Sayed et al., 2010).
During the last years, we focused our attention in the molecular circuit of TBX5 and TBX5-modulated-microRNAs. We have shown how the modulation of a single microRNA can partially rescue the pathological phenotype due to the alteration of TBX5 expression and we identified miR-218 and miR-19a as two players involved in cardiovascular zebrafish development (Chiavacci et al., 2015a; Chiavacci et al., 2012a).
MiR-218 is located in the gene slit2, (Fish et al., 2011). We found that miR-218 and Tbx5 are co-expressed in murine cardiac tissue and we demonstrated that its overexpression in zebrafish causes heart defects and decreases migrating capability of myocardial precursors. In particular, miR-218 overexpression leads to valve expansion, similar to Tbx5 depleted embryos. We further investigated the functional interaction between Tbx5a and the miR-218 discovering that Tbx5 overexpression can be rescued by down regulation of miR-218 (Chiavacci et al., 2012).
As previously described, the miR-17-92 cluster is involved in heart morphogenesis. In our previous work, we found at miRNAs belonging to this cluster are deregulated in heartstring phenotype in zebrafish using a next generation sequencing approach. Interestingly, only miR-19a modulation is able to rescue the HOS phenotype (Chiavacci et al., 2015).
21
1.4 Z
EBRAFISH AS A MODEL TO STUDYC
ONGENITALH
EARTD
ISEASE(CHD)
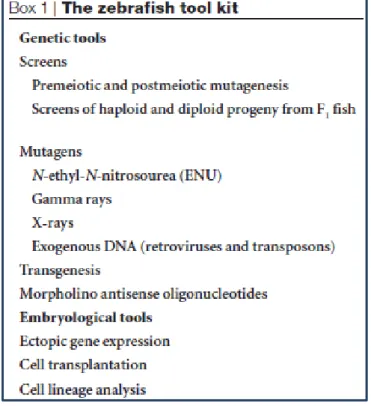
Zebrafish (Danio rerio) is a small fish of 2-5 cm in length originated from South-Est Asia that belongs to the family of Cyprinidae. Zebrafish is a powerful model organism for the study of vertebrate biology, being well suited to both developmental and genetic analysis. External development and optical clarity during embryogenesis allow for visual analyses of early developmental processes, and high fecundity and short generation times facilitate genetic analyse (Kimmel et al., 1995). Furthermore, with the emerging of rapid and efficient transgenic technology a great number of different transgenic reporter lines that highlight specific structures and specific organs have been generated (Stainier, 2001). The main techniques used in zebrafish are shown in the Figure 1.7.
Figure 1.7 – List of main tools which can be used in zebrafish model.
Importantly the extent of conservation between zebrafish and human genomes is very high as it has been shown by the zebrafish genome-sequencing project started at the Wellcome Trust Sanger Institute in 2001. Today zebrafish genome is almost completely sequenced. The high level of identity is clearly evident in Figure 1.8 where the Euler-Venn diagram of orthologous genes shared among the different model organisms used in science