ANALYSING THE SENSITIVITY OF ELECTRICITY SYSTEM OPERATIONAL COSTS
TO DEVIATIONS IN SUPPLY AND DEMAND
Joan Batalla-Bejerano, Elisa Trujillo-Baute
Document de treball de l’IEB
2015/8
Documents de Treball de l’IEB 2015/8
ANALYSING THE SENSITIVITY OF ELECTRICITY SYSTEM OPERATIONAL COSTS TO DEVIATIONS IN SUPPLY AND DEMAND
Joan Batalla-Bejerano, Elisa Trujillo-Baute
The Barcelona Institute of Economics (IEB) is a research centre at the University of Barcelona (UB) which specializes in the field of applied economics. The IEB is a foundation funded by the following institutions: Applus, Abertis, Ajuntament de Barcelona, Diputació de Barcelona, Gas Natural and La Caixa.
Within the IEB framework, the Chair of Energy Sustainability promotes research into the production, supply and use of the energy needed to maintain social welfare and development, placing special emphasis on economic, environmental and social aspects. There are three main research areas of interest within the program: energy sustainability, competition and consumers, and energy firms. The energy sustainability research area covers topics as energy efficiency, CO2 capture and storage, R+D in energy, green certificate markets, smart grids and meters, green energy and biofuels. The competition and consumers area is oriented to research on wholesale markets, retail markets, regulation, competition and consumers. The research area on energy firms is devoted to the analysis of business strategies, social and corporative responsibility, and industrial organization. Disseminating research outputs to a broad audience is an important objective of the program, whose results must be relevant both at national and international level.
The Chair of Energy Sustainability of the University of Barcelona-IEB is funded by the following enterprises ACS, CEPSA, CLH, Enagas, Endesa, FCC Energia, HC Energia, Gas Natural Fenosa, and Repsol) through FUNSEAM (Foundation for Energy and Environmental Sustainability).
Postal Address:
Chair in Energy Sustainability Institut d’Economia de Barcelona Facultat d’Economia i Empresa Universitat de Barcelona C/John M Keynes, 1-11 (08034) Barcelona, Spain Tel.: + 34 93 403 46 46 [email protected] http://www.ieb.ub.edu
The IEB working papers represent ongoing research that is circulated to encourage discussion and has not undergone a peer review process. Any opinions expressed here are those of the author(s) and not those of IEB.
Documents de Treball de l’IEB 2015/8
ANALYSING THE SENSITIVITY OF ELECTRICITY SYSTEM OPERATIONAL COSTS TO DEVIATIONS
IN SUPPLY AND DEMAND
Joan Batalla-Bejerano, Elisa Trujillo-Baute
ABSTRACT: Increasing renewable penetration has given rise to a series of challenges as regards the ability of electricity systems to balance supply and demand, particularly with high levels of intermittent renewable generation. This new scenario requires a detailed quantitative assessment of the way in which the electricity system might both deliver and accommodate higher levels of RES-E generation and of the associated economic costs for the consumer. The estimations reported in this paper for the Spanish electricity system stress the importance of demand imbalance when accounting for the cost of balancing services, in contrast with previous studies that have focused their attention more specifically on supply effects.
JEL Codes: D47, L51, Q41, Q42, Q47
Keywords: Electricity market design, balancing services, renewable energy, electricity demand and supply deviations
Joan Batalla-Bejerano Rovira i Virgili University
Chair of Energy Sustainability & IEB (UB) – FUNSEAM Av. Diagonal, 690 08034 Barcelona (Spain) E-mail: [email protected] Elisa Trujillo-Baute University of Warwick
Chair of Energy Sustainability & IEB (UB) – FUNSEAM
Coventry CV4 7AL (United Kingdom) E-mail: [email protected]
1. INTRODUCTION
In recent years, there has been a marked increase in the presence of renewable energies in electricity systems. Unprecedented technological advances and the rapid deployment of renewable energy technologies have demonstrated the immense potential of renewable energy sources (RES). These energies provided an estimated 19% of global final energy consumption in 2012 and continued to grow in 2013 (REN21, 2014). Indeed, since 2002 RES generation increased overall by 81.3%, reaching 22.3% of total primary energy production from all sources within the European Union (EU-28) in 2013. The implementation of support policies for renewable energies (of particular importance in Europe) has resulted in the increased weight of these sources in the coverage of electricity demand. Electricity generated from renewable energy sources (RES-E) contributed almost one quarter (23.5%) to the EU-28’s gross electricity consumption (European Commission, 2013).
The growth in RES-E during the period 2002 to 2013 largely reflects an expansion in the two main sources, namely, wind and solar power. Although hydropower remained the single largest source for RES-E generation in Europe in 2012 (54.1%), the amount of electricity generated from this source has remained relatively stable during the last twenty years. By contrast, the quantity of electricity generated from wind turbines has increased more than five-fold since 2002 (Eurostat, 2014), and the growth in electricity generated from solar power has been even more dramatic, rising from just 0.3 TWh in 2002 to reach 71 TWh in 2012.
Thus, we are moving from electricity systems characterized by the strong presence of conventional generation in the supply matrix (which have proved capable of providing the flexibility required in times of peak demand), towards a new model characterized by the growing presence of variable and relatively unpredictable generation. This transition places enormous stress on adjustment systems, that is, the systems that are permanently seeking to match generation and load on different time scales. Under these new circumstances, electricity systems have to provide a degree of flexibility for which they were not originally designed.
From a system operations perspective, this increasing penetration of RES-E generation has gone hand in hand with rising network congestion. Electricity generation is not always located near the points of consumption and existing networks were not designed taking into consideration the location of these new energy sources, i.e., centralised generation. This has given rise to an intense debate, at the European level (ACER, 2014), about the adequacy of current adjustment markets when having to respond to the increasing need for flexibility of their respective electricity systems. Most present-day adjustment mechanisms were designed at the beginning of the reform and liberalisation of the energy sector, when the context was very different from that which prevails today with the high penetration of generation based on variable renewable sources.
Within the aforementioned debate, the aim of this paper is to analyse the relationship between the operational costs of the electricity system and the integration of increasing volumes of RES-E generation taking into account the effects of supply and demand. The integration of larger shares of RES-E generation (in particular wind and solar power) increases the flexibility requirements of the complementary system, which needs to balance the fluctuations in variable generation. Although there are a number of different links between RES-E and it associated balancing requirements1 (Hirth and Ziegenhagen, 2013), this paper explores the nexus between forecast errors and the consequent need for balancing power. The variability of renewable generation requires that the power system be operated with a high degree of flexibility, so as to keep pace with the fluctuating net load, defined at each instant as the difference between total energy consumption and total variable renewable production. As such, unexpected fluctuations in renewable production as well as unexpected fluctuations in electricity demand are relevant. Although electricity consumption adheres to predictable diurnal and seasonal patterns, prediction errors are high at around 1.5-3% of peak load – 3-5% of total energy (Holttinen, 2005). This means that both rates are crucial when explaining the flexibility requirements of the electricity system. Despite this, to the best of our knowledge, the demand effect has not received much attention in the literature.
Drawing on real data for Spain for the period 1 January 2010 to 30 June 2014, the aim of this study is two-fold. First, it assesses the power system balancing costs associated with real-time deviations by addressing the interaction between real-time demand and RES-E generation imbalances, and the economic cost that its correction entails for the consumer. Deviations between scheduled and consumed electricity are addressed through ancillary services based, in most instances, on market procedures, such as secondary and tertiary reserve, and the imbalance management process, and so there is a direct relationship between the size of the deviation and the cost incurred by the system in resolving it. Second, it analyses the sensitivity of the imbalance costs to demand and RES-E generation deviations. Although demand deviations have not previously been considered a source of uncertainty, the estimations presented here clearly show their relevance when explaining the cost of balancing services.
In the context of operational cost analyses of an electricity system, Spain constitutes a highly interesting case for several reasons. With 40,267 MW at the end of 2013, Spain ranked fourth in the world in terms of RES installed capacity, behind only China, the United States and Germany (REN21, 2014). Spanish RES-E generation has grown from 26 TWh in 2000 to 111TWh in 20132, when it represented 42% of total electricity demand. The country’s great renewable potential, favourable regulation and
1 There is a multitude of names for the different services to restore the supply-demand balance in power systems (see Hirth and Ziegenhagen, 2013 and Rivero et al., 2011 for a comprehensive comparison of European balancing markets). This heterogeneity could be hampering a comparative analysis of the balancing services across Europe. Considering that European transmission system operators are using the term “operational reserves” (ENTSO-e, 2012), in this paper we use the concept “operational costs” in a broad sense when referring to the costs associated with the provision of these services.
technological evolution are some of the factors underpinning this success. In addition to the high and fast growing RES-E generation penetration, Spain also makes a relevant case study because of the isolated nature of its electricity system. This represents additional challenges when integrating electricity generation from variable renewable electricity sources (albeit primarily wind and solar photovoltaic power).
The remainder of this paper is structured as follows. Section 2 provides an overview of academic research on power generation from RES-E and its role in system operational costs. The Spanish electricity market is described in Section 3, with a more detailed description of the way in which the imbalance markets have evolved and function, along with an analysis of the contribution of the various sub-markets that make up the Spanish electricity market. The model specification and the data used are presented in Section 4. Estimation results are presented in Section 5. The paper ends with a final section summarising research conclusions and presenting the policy and regulatory recommendations.
2. LITERATURE
The integration of renewable energy generation is a key pillar among energy and climate objectives aimed at reducing greenhouse gas emissions, improving the security of energy supply, diversifying energy supplies and improving Europe’s industrial competitiveness (DNV-GL, 2014).
The generation of power from RES-E as a tool for mitigating climate change has attracted the attention of academia worldwide. And over the last decade a number of aspects of renewable energy research have attracted particular attention, most notably, the impact that financial support to renewable energy has on climate change and the security of supply (Helm and Hepburn, 2009); the design of public policies for the promotion of renewable energy sources (Ragwitz, et al., 2007; Finon and Menanteau, 2008; IEA, 2011a; del Río et al., 2012b); and the implications and challenges of the generation of renewable electricity markets (Sensfuß et al., 2008; Gelabert et al., 2011; among others).
The risks associated with renewable energy deployment (IEA, 2011a) stem from underlying techno-economic factors as well as from other obstacles, including regulatory and policy uncertainty and institutional and administrative barriers. Among the main techno-economic risk factors, RES-E investment costs and the intermittency of its production (being very much dependent on wind conditions and sunlight) represent major challenges for the expansion of renewable energies. In order to incorporate these intermittent sources, power systems need to be sufficiently flexible to accommodate short-term predictions and generation variability. In this regard, a number of studies have looked at ways of guaranteeing the technical and economic integration of an increasing volume of RES-E generation into power systems and have identified the
main obstacles that need to be overcome (IEA, 2011a; IEA, 2011b; Joskow and Tirole, 2007; OECD, 2011; REN21, 2014).
Evaluating the effects of the increasing penetration of intermittent RES-E generation on the integral electricity system is a prerequisite for the efficient economic integration of renewable generation. In this regard, analyses need to be undertaken so as to gain clearer insights into the costs and impacts associated with incorporating renewable energy into electricity networks (Gross and Heptonstall, 2008).
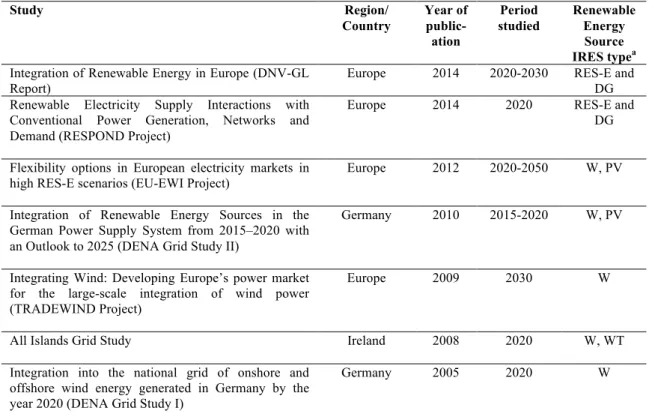
Table 1: Main RES integration studies
Study Region/ Country Year of public-ation Period studied Renewable Energy Source IRES typea
Integration of Renewable Energy in Europe (DNV-GL Report)
Europe 2014 2020-2030 RES-E and DG Renewable Electricity Supply Interactions with
Conventional Power Generation, Networks and Demand (RESPOND Project)
Europe 2014 2020 RES-E and DG Flexibility options in European electricity markets in
high RES-E scenarios (EU-EWI Project) Europe 2012 2020-2050 W, PV Integration of Renewable Energy Sources in the
German Power Supply System from 2015–2020 with an Outlook to 2025 (DENA Grid Study II)
Germany 2010 2015-2020 W, PV
Integrating Wind: Developing Europe’s power market for the large-scale integration of wind power (TRADEWIND Project)
Europe 2009 2030 W
All Islands Grid Study Ireland 2008 2020 W, WT
Integration into the national grid of onshore and offshore wind energy generated in Germany by the year 2020 (DENA Grid Study I)
Germany 2005 2020 W
aRES-E (onshore and offshore wind, photovoltaic and micro CHP); DG: Distributed Generation; PV:
Photovoltaic; W: Wind.; WT: Wave Tidal
The variability and uncertainty of RES-E generation have a number of impacts on power systems. Real-time deviations in renewable power generation affect daily markets resulting in higher balancing costs and greater fluctuation in the reserve requirement. These short-term impacts have been classified (IEA, 2009 and Pérez-Arriaga and Batlle, 2012) into the following six categories: a) increase in the size of reserves; b) less efficient operation of conventional power plants; c) replacement of thermal electricity generation; d) RES-E generation curtailment; e) transmission losses, and f) voltage fluctuations. The most commonly adopted approaches for quantifying and assessing these short-term impacts involve statistical and/or power system simulation. To date, as Table 1 illustrates, most studies examining the impact of wind power on actual system costs have used the grid optimization approach and simulation models, but they have not usually employed actual data. Typically these studies add more renewable generation to the system and examine the evolution in balancing costs,
at different levels of RES-E penetration and variability, comparing these outcomes with a flat profile without RES-E penetration.
The adoption of simulation approaches when examining the balancing cost implications of RES-E integration is justified on various grounds. As Swinand and Godel (2012) point out the contribution of renewable generation to the overall mix has for a long time been negligible, meaning empirical studies have been of limited value. Likewise, the seasonal variation in energy consumption means empirical studies require long time series. However, such information is now becoming available, especially in countries with significant RES-E generation. As a result, estimations of the balancing costs associated with increased flexibility requirements using market data are becoming more common (Holttinen, 2005; Cossent et al., 2009; Holttinen et al., 2011; Huber et al., 2014; Ketterer, 2014). Here, our estimation of the impact of real-time demand and supply deviations on balancing costs is performed using actual data for a country with high RES-E penetration (Spain). As such our study should serve as a point of reference for other countries concerned about the potential economic implications of the growing presence of RES-E. A large, highly detailed hourly database allows us to tackle aspects related to seasonal variations, while our economic approach overcomes the need for a complex simulation modelling of the operation of balancing markets.
The approach we adopt in this study differs in a number of aspects with the approaches used in previous studies. Thus, as mentioned, not only do we consider unexpected fluctuations in RES-E as being relevant, we also take into consideration unexpected fluctuations in electricity demand. All in all, the main contribution of our paper lies in the differentiation we draw between demand and supply deviations. Individual data for both types of deviation allow us to undertake a detailed analysis of their economic effects on system adjustment services. At the same time, the richness of the dataset enables us to reduce the underlying complexity of balancing costs. In contrast with other studies that seek to estimate the economic costs of a specific balancing market (Strbac et al., 2007; Swinand and Godel, 2012), we estimate the adjustment cost on an aggregate basis. By reducing the complexity, we are able to focus our analysis on the economic impact of real-time deviations on balancing costs using information on final electricity prices. Likewise, while other studies have tended to focus more closely on the market design question (Vandezande et al., 2010; Weber, 2010; MacCormack et al., 2010; Rivero et al., 2011; Chao, 2011; Henriot, 2012 and 2014; Hirth, 2013), we are more specifically concerned with estimating the economic impacts of RES-E and demand deviations on balancing costs. In the planning and operation of the system, load and RES-E generation deviation constitute an increasing cost. As more and more renewable generation is introduced into the system, the likeliness of causing imbalances can be expected to increase (Frunt, 2011). Therefore, given that uncertainty remains a critical aspect of an electricity system with additional flexibility requirements, what we require is an economic estimation of the impact on final electricity prices.
3. ELECTRICITY MARKET AND ADJUSTMENT SERVICES IN SPAIN
The Spanish electricity market comprises various sub-markets: a daily market, an intraday market, ancillary services, and system operation services beginning with the day-ahead market and culminating in real time3. At different market sessions held the day prior to or even on the day of delivery, the final price of electricity is determined as the sum of the different prices and costs associated with each of these markets.
Day-ahead sale and electricity purchase transactions are carried out during daily market sessions, structured into twenty-four consecutive periods of one hour, at which producers participate by presenting their hourly bids. Once the day-ahead market process has been concluded and the operating schedule obtained, the system operator is in a position to obtain the viable daily schedule. On the intraday markets, sellers of electricity on the daily market may make adjustments – by selling or purchasing energy – in order to reduce possible deviations in the scheduled power production established after day-ahead market closure. The purpose of the intraday market (which in Spain comprises several sessions) is to match energy supply and demand arising in the hours following the viable daily schedule.
The Spanish electricity system is managed by two operators: the market operator (Operador del Mercado Ibérico - OMI), which is responsible for the economic management of the market, and the system operator (Red Eléctrica de España - REE), which is responsible for the technical management.
The system adjustment services include the resolution of system technical constraints, ancillary services and imbalance markets.
a) Technical constraints
Technical constraints appear when market clearing is technically incompatible and requires a modification of the schedules in order to comply with the operation and security criteria for operating the system. The modification of the initial electricity schedule implies a re-balancing generation-demand process.
b) Ancillary services
Ancillary services are defined as the services necessary to ensure the electricity supply under suitable conditions of security, quality and reliability. Without going into excessive detail, in the case of Spain, ancillary services include additional upward reserve power, primary control, secondary control, tertiary control and voltage control of the transmission grid.
c) Imbalance markets
3For a more detailed description of the Spanish electricity market see Bueno-Lorenzo et al. (2013).
The system operator uses the imbalance markets to guarantee the permanent balance between generation and electricity demand. For this purpose, REE has at its disposal the deviation management services and secondary and tertiary control energy. The mechanism of deviation management is an optional service managed and remunerated by market mechanisms.
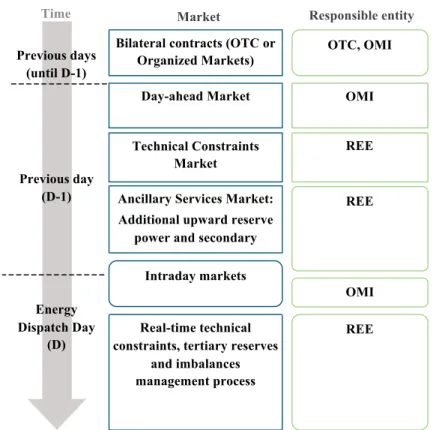
Figure 1: Spanish Electricity Markets
Source: Based on Operating Procedures for the electricity system (REE)
All these adjustment services are provided via several system operation processes defined by REE. One of the most remarkable features of the Spanish system is that, since the beginning of the liberalization process, the regulatory framework has promoted the provision of these services through market mechanisms, along with the creation of the market as a platform for energy transactions.
In 2013, the amount of energy traded in the adjustment service markets was 20.9 TWh. For the same period, the quantity of energy negotiated in the intraday market amounted to 34.6 TWh with an average price that was 1.13 €/MWh lower than that on the day-ahead market. Compared with the volume of energy traded in the same period on the day-ahead markets (235 TWh), the amount of energy negotiated in the adjustment service markets could seem small. Yet, the use of adjustment services has increased in recent years, due in the main to a greater share of RES-E and an increase in the costs of
Day-ahead Market OMI
Ancillary Services Market: Additional upward reserve
power and secondary reserve
REE
Intraday markets
OMI Real-time technical
constraints, tertiary reserves and imbalances management process
REE
Market Responsible entity
Bilateral contracts (OTC or
Organized Markets) OTC, OMI
Technical Constraints Market REE Previous days (until D-1) Previous day (D-1) Energy Dispatch Day (D) Time
thermal electricity generation, basically CCGTs, which provide most of these services. Therefore, there has recently been an increase in the impact of the additional cost of the technical constraints and market adjustment on the average final price of the electricity market. The average final price, which is the sum of the capacity payments, the cost associated with the intraday markets and the operational costs to the day-ahead price, reached 57.7 €/MWh in 2013 (see Table 2).
For the sake of simplicity, the costs of overall system adjustment services managed by the system operator – technical and real-time constraints, power reserve, secondary and tertiary control band and deviations process management services – have been aggregated. Capacity payments correspond to regulated retribution to finance the medium- and long-term power capacity service offered by the generation facilities to the electricity system.
Table 2: Annual evolution of electricity final price (€/MWh) by components
Concept 2010 2011 2012 2013
Day-ahead and intraday market price 38.4 50.9 40.8 46.1 Adjustment services cost 3.8 3.2 4.7 5.5
Capacity payments 3.6 6.1 6.1 6.0
Final price 45.8 60.2 59.6 57.7
Source: Based on data provided by e-sios (REE)
Given that the penetration of RES-E generation – especially wind and photovoltaic power – in Spain has developed to levels that were unthinkable a decade ago, the Spanish experience in terms of market integration is often considered a success story. Yet, the economic evaluation of the advantages and disadvantages of the increasing use of energy from renewable sources for generating electricity unfortunately exceeds the scope of this paper: a comparative quantification of the overall system-related costs and benefits of the increase in RES-E being required to evaluate the competitiveness of the provision of adjustment services.
The evolution of the costs associated with adjustment services has a marked impact on the results of independent electricity retailers. While the price risk associated with unexpected variations in the day-ahead market price can be covered via future markets, unforeseen variations in the cost of adjustment services cannot be covered. This being the case, an unexpected increase in the adjustment service costs has a direct impact on the business results of retailers – especially those without generation. This highlights the relevance of an in-depth understanding of the explanatory factors behind the evolution of the operational costs, given that this knowledge will ultimately be helpful when introducing improvements to the market design.
4. DATA AND EMPIRICAL STRATEGY
In this section, we present the empirical strategy and data used to evaluate the effect of power imbalances – mainly load and variable renewable electricity forecast errors – on operational costs. Adjustment and balancing services definitions are provided in Figure 2.
In Spain, as in the majority of electricity systems, market clearing takes place the day prior to delivery so as to be able to program the dispatch of unconventional generation units. Given that the intraday markets (with gate closures times closer to real time than day-ahead) are used to adjust and correct4 previous schedules made in the day-ahead
market, in this paper demand and supply deviations are calculated with reference to the intraday market gate closure.
Figure 2: Variable nomenclature
where:
Dhda, Dhi Foreseen demand in the day-ahead (da) and intraday (i) markets for the hour under consideration (h)
Dhr Real demand in the hour under consideration (h)
Gh,wda, Gh,pvda Wind (w) and photovoltaic (pv) generation sold in the day-ahead market (da) in the hour under consideration (h)
Gh,wi, Gh,pvi Wind (w) and photovoltaic (pv) generation in the hour under consideration (h) after adjustments made in the different sessions of the intraday markets (i)
4 The intraday market provides the opportunity to update energy forecasts closer to real time with better forecasts, but also offers arbitrage opportunities. For the sake of simplicity, in this paper we consider that all market parties (especially solar and wind producers) use the different sessions of the intraday markets only to correct the power sold in the day-ahead market. This means the real use of the intraday markets is worthy of further analysis.
Day-ahead market
gate closure (d-1) Intraday market gate closure (d) Energy dispatch (d)
time Dhda Gh,wda Gh,pvda Dhi Gh,wi Gh,pvi Dhr Gh,wr Gh,pvr Supply deviations Demand deviations Adjustment and balancing services
Gh,wr, Gh,pvr Wind (w) and photovoltaic (pv) generation finally dispatched in the hour under consideration (h)
Although several factors5 could cause active power imbalances in power systems, our empirical approach focuses on demand (Dhr-Dhi) and on variable renewable electricity deviations due to forecast errors (Gh,wr- Gh,wifor wind generation; Gh,pvr- Gh,pvifor photovoltaic generation). In keeping with this approach, demand and supply imbalances can be defined as follows:
DI = Dhr-Dhi
SI = (Gh,wr- Gh,wi) + (Gh,pvr- Gh,pvi)
As pointed out in earlier sections above, deviations between scheduled energy and real time demand are addressed through ancillary services, most of which are based on market procedures, such as secondary and tertiary reserve, and the imbalance management process. Thus, there is a direct relationship between the size of the deviation and the cost incurred by the system in resolving it. Given all these considerations as to how supply and demand deviations are obtained, we present the general approach adopted in a single equation and explain the variables used and their data sources.
When assessing the power system balancing costs associated with real-time deviations, the following expression and variables are used:
f (SI, DI) → AC where:
AC = Adjustment Cost
The adjustment (or operational) cost is defined as the economic cost of the balancing mechanisms required when demand or RES-E supply deviations appear. Depending on the costs considered in the definition, adjustment costs could be defined in gross or in net terms.
GAC = Gross Adjustment Cost
The gross adjustment cost has been defined as the gross system adjustment services cost and is described as the difference between the final electricity price and the price at the end of the last intraday market session. After the intraday market, deviations between scheduled and measured energy are addressed through market procedures, such as secondary reserve, tertiary reserve and the imbalance management process. The costs
5Unplanned plant outages in thermal and hydro generation, forecast errors in RES-E generation, unplanned line outages of international interconnectors and forecast errors of load, among others.
associated with these balancing markets are captured by this spread, which measures the additional costs for delivering one MWh of electricity on top of the day-ahead and intraday price. When obtaining this spread, capacity payments are not considered. As explained in the previous section, capacity payments correspond to the regulated retribution to finance the medium- and long-term power capacity service offered by the generation facilities to the electricity system. Given that it is not directly related to the procurement of flexibility to the system, this cost is not included when the adjustment cost is expressed in gross or in net terms. In other words, the GAC variable results from the aggregate of overall system adjustment services managed by the system operator – technical and real-time constraints, power reserve, secondary and tertiary control band and deviations process management services.
NAC = Net Adjustment Cost
A second definition of operational costs is introduced so as to capture the flexibility costs more accurately. Adjustment costs expressed in gross terms include the overall costs for resolving the system’s technical restrictions. However, not all the technical constraints are due to supply or demand deviations. More precisely, only real-time restrictions management should be considered. Nevertheless, because of data availability, it is not possible to isolate the cost of real-time technical restrictions by hours. In aggregate terms, during 2013, the energy scheduled for resolving technical constraints totalled 9,791 MWh. Of this amount, energy used to modify the schedules of the programming units during real-time operation accounted for between 15 and 20%. Therefore, according to available data, technical constraint mechanisms focus mainly on resolving restrictions identified in the daily program following the closure of the day-ahead market. Hence, it seems more accurate not to consider these costs when trying to explain the effect of the supply and demand deviations on adjustment services. In other words, NAC can be defined as GAC minus the adjustment costs related to the technical constraints management.
When analysing the evolution of system adjustment costs we have identified an inertial behaviour. This behaviour could be related to the criteria followed by the System Operator (SO) when assessing the control reserves. In Spain, as in the majority of European countries, the assessment of secondary and tertiary reserves is performed using deterministic and probabilistic approaches. In line with these approaches, the final amount of reserves contracted by REE6 depends on such variables as the expected peak
load in a given period or the largest loss of power expected within the control area. Provided these variables present an inertial evolution, the costs associated with the provision of the adjustment services will present the same behaviour. In order to capture
6In Spain, the assessment of the secondary reserve is based on the Empiric Noise Management Sizing Approach. REE applies two formulas: one for last load variation (6 ) and the other for normal conditions (3 ), where Lmax represents the expected peak load for a given area in a given period. Tertiary reserve assessment is based on the Loss Of the Largest Production Unit (LOLPU) method considering the amount of reserve needed to cover the lack of the capacity of the largest unit.
these effects, the introduction of a dynamic component in the model specification is required.
SI = RES-E Supply Imbalance
The supply imbalance is defined as the measured downward/upward deviation, which takes place when real-time RES generation is less/greater than that scheduled in the intraday market gate closure. Considering that RES-E generators can update the prediction made to the day-ahead market in the intraday markets when forecasts with higher accuracies are available, the differences between power bids at intraday market gate closure and the power delivered to the power system are considered the best measure of RES-E generation imbalances.
As pointed out above, this supply imbalance can be divided by RES-E technologies in: SWI = Wind Supply Imbalance
Supply imbalance created by wind power (Gh,wr- Gh,wi). SPHI = Photovoltaic Supply Imbalance
Supply imbalance created by solar photovoltaic power (Gh,pvr- Gh,pvi).
DI = Demand Imbalance
The demand imbalance is defined as the measured downward/upward demand deviation, which takes place when real-time consumption is higher/less than that scheduled in the intraday market gate closure. In this paper, only demand deviations that require system adjustments are considered7.
Given that we aim to assess the economic cost of deviations, in this study the costs of demand and supply imbalances are not measured in terms of up and down price regulation8, but in terms of the average impact of system adjustment costs on the final price of energy. These deviations (MWh) are presented in absolute terms.
RF = Regulatory Framework
In recent years, the Spanish electricity system has been affected by various reform processes, all aimed at promoting greater efficiency, transparency and competition, but also at reducing the tariff deficit incurred. Although this broad set of measures has
7Demand and renewable production could be correlated presenting similar seasonal patterns with periods of high (low) demand coinciding with periods of high (low) renewable energy production. If this happens, any source of variability in the amount of renewable energy generated (or vice versa) could be absorbed by consumer demand with the consequent reduction in net load fluctuations and, therefore, in flexibility requirements and adjustment costs.
8 In Spain, a two-price model in the settlement of imbalances is used. This means that regulation price exists only for either up (when RES power production is lower than has been bid to the market) or down (when RES power production is higher than has been bid to the market), depending on the direction of the system imbalance.
affected all market parties, the national coal policy (the so-called restrictions of guarantee of supply) deserves special attention given its effects on the flexibility of the system (see Huisman and Trujillo-Baute, 2014) in the context of adjustment services. Demand for national coal for generating electricity in Spain fell as a consequence of the contraction of electricity demand, the high price of national coal relative to international coal, and the development of other production technologies. The combination of these circumstances resulted in a sizeable excess of national coal production that was not absorbed by energy production, which became a source of major concern for the coal sector. In February 2011 a new regulatory framework to deal with the coal sector’s concerns was implemented in the electricity market. This took the form of a preferential dispatch mechanism for Spain’s coal power plants, where the electricity generated by these plants is remunerated at regulated prices. This scheme modifies the operations of the energy market by introducing an adjustment that takes place immediately after the daily market match. The adjustment means altering the market result by removing volume offered (usually) by combined cycle plants and replacing them with units produced with national coal. Huisman and Trujillo-Baute (2014) show that the Spanish power market became less flexible after the policy change as the share of national coal production increased while the share of the combined cycle plants decreased, resulting in an increase in adjustment costs. In this paper we control the economic impact on adjustment costs of this new regulatory framework by incorporating a dummy variable (=1 after February 2011).
WD = Working Day
Finally, as electricity demand varies across the week, a temporary variable is introduced in the specification of the model in order to address aspects related to seasonality. Given notable differences between working days and the weekend, the model specification incorporates a dummy variable (=1 if a working day).
Hourly data from the Spanish Power System Operator for the different markets (daily and intraday markets, technical constraints daily market, imbalances markets and other ancillary services) are used. The analysis covers the period between 1 January 2010 and 30 June 2014.
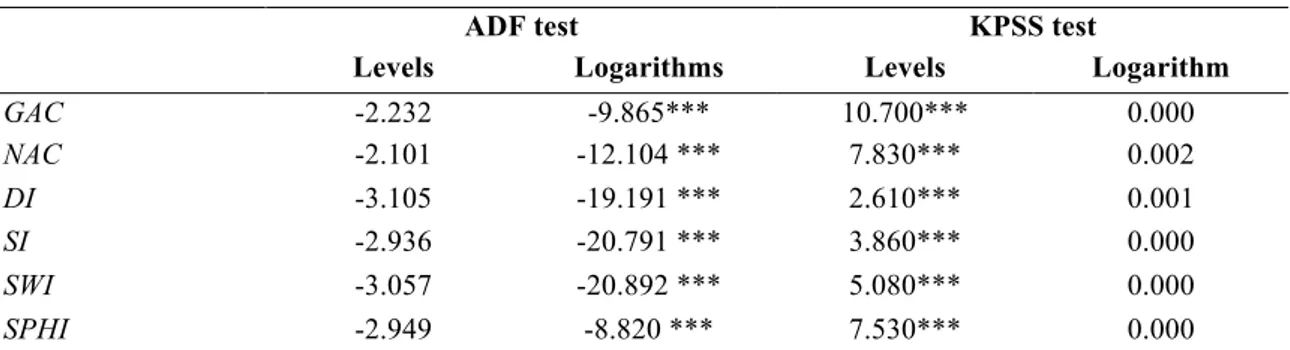
Having described the model and information employed, we now present the stationary time series analysis. We performed two tests. First, the augmented Dickey-Fuller (ADF) test (Dickey and Fuller, 1979) under the null hypothesis of a unit root and second, the Kwiatkowski-Phillips-Schmidt-Shin (KPSS) tests (Kwiatkowski, et al., 1992) under the null hypothesis of stationarity.
While the results of the ADF test (see Table 3) in levels indicate that we cannot reject the null hypothesis of a unit root in any variable at a reasonable level of significance, the results in logarithms indicate that we can reject the null hypothesis of a unit root for all series. In addition, the KPSS results in levels indicate that we can reject the null
hypothesis of stationarity in all cases, and in logarithms that we cannot reject the null hypothesis of stationarity at the 1% level of significance. Both tests confirm that the series are stationary in logarithms, so we estimate the models using all series in logarithms9.
Table 3: Augmented Dickey-Fuller and Kwiatkowski–Phillips–Schmidt–Shin test
ADF test KPSS test
Levels Logarithms Levels Logarithm
GAC -2.232 -9.865*** 10.700*** 0.000 NAC -2.101 -12.104 *** 7.830*** 0.002 DI -3.105 -19.191 *** 2.610*** 0.001 SI -2.936 -20.791 *** 3.860*** 0.000 SWI -3.057 -20.892 *** 5.080*** 0.000 SPHI -2.949 -8.820 *** 7.530*** 0.000
Note: Test results are statistics. The Modified Akanke Information Criterion determines lag length. The trend was not significant in any case, and hence, it was excluded. ADF null hypothesis of unit root. KPSS null hypothesis of stationarity. *** Significant at 1%
In Table 4, we present the descriptive statistics of the variables in logarithms as explained above.
Table 4: Descriptive Statistics
Variable Obs. Mean Median Std. Dev. Min Max
Gross Adjustment Costs (GAC) 39,408 1.2343 3.6200 0.7690 -4.6056 4.5419 Net Adjustment Costs (NAC) 39,408 0.1638 1.2300 0.9287 -4.6052 4.4186 SI 39,408 -4.3448 0.0149 1.1037 -12.9355 -1.9206 SWI 39,408 -4.3584 0.0134 0.9453 -12.7167 -1.9206 SPHI 39,368 -6.7393 0.0041 1.4771 -16.5056 -2.6952 DI 39,408 -3.7869 0.0285 1.2093 -12.7925 -1.2558 WD 39,408 0.6937 1.0000 0.4610 0.0000 1.0000 RF 39,408 0.7411 1.0000 0.4379 0.0000 1.0000
The time series regression models constructed for the analysis of the imbalance effects on the adjustment cost – in gross terms (GACt) and in net terms (NACt) – are defined in
the following equations:
GACt = α0 + α1GACt-1 + α2DIt + α3SIt + α4WDt + α5RFt + εt (1)
NACt = α0 + α1NACt-1 + α2DIt + α3SIt + α4WDt + α5RFt + εt (2)
9 Furthermore, estimation results with an absolute value of the autoregressive coefficients lower than one confirm the stationarity of the series.
where, we take into account differences in the effect originating from demand (DIt) and
supply (SIt) imbalances, and we introduce an autoregressive component (GACt-1 in Eq.
(1) and NACt-1 in Eq. (2)) to capture the effects of dynamics. Likewise we introduce
control variables for consumption patterns on working and non-working days (WDt) and
for differences in the regulatory framework (RFt).
Finally, to disentangle the supply side imbalances originating from the two main intermittent power sources, in Eq.(3) and Eq. (4), we separately account for wind (SWIt)
and solar (SPHIt) supply imbalance effects. The same consideration for the time series
integration is also made.
GACt = α0 + α1 GACt-1 + α2DIt + α3SWIt + α4SPHIt +α5WDt+ α6RFt+ εt (3)
NACt = α0 + α1NACt-1 + α2DIt + α3SWIt + α4SPHIt +α5WDt+ α6RFt+ εt (4)
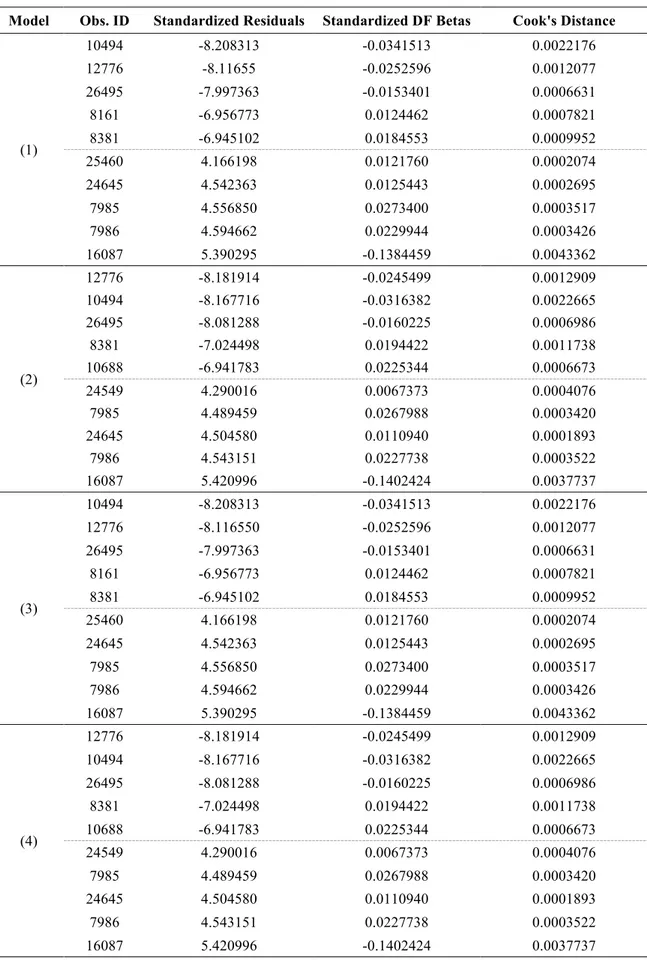
In addition to the time series properties of the variables, a deep outlier analysis was performed (see Appendix). The results of this analysis indicate that there are extreme values of observed variables that, if regressions are performed using least square methods, can distort estimates of regression coefficients. Given the confirmed validity of outlier observations (the outliers are likely to be real observations) and the dynamic nature of the model, all data points should be maintained. Thus, to alleviate the effects of the outliers we perform a quantile regression on the median10. The quantile approach is
not as sensitive as the least squares approach to outliers because it does not give much weight to them (at the mean it gives symmetric weights to positive and negative residuals), but at the same time, unlike robust estimation, the quantile estimation does not sacrifice observations with relevant information. As in the least squares estimation of dynamic models, in the case of the quantile regression it is evident that the unobserved initial values of the dynamic process induce a bias. In the case of linear regression, instrumental variable methods are able to produce consistent estimators for dynamic data models that are independent of the initial conditions. These estimators are based on the idea that lagged (or lagged differences of) regressors are correlated with the included regressor but are uncorrelated with the innovations. Thus, valid instruments are available from inside the model and these can be used to estimate the parameters of interest employing instrumental variable methods (see Chernozhukov and Hansen, 2006; 2008). In this paper we use an analogous rationality for the construction of instruments, using values of the dependent variable lagged two periods (GACt-2 and
NACt-2) and the lags of the exogenous variables (DIt-1; SIt-1; SWIt-1; SPHIt-1), which are
all independent of εt, to perform estimations using the instrumental variable quantile
regression method11.
10 This analysis is also conducted with the first and fifth quantiles. From these results (available upon request), a similar conclusion can be drawn.
5. RESULTS
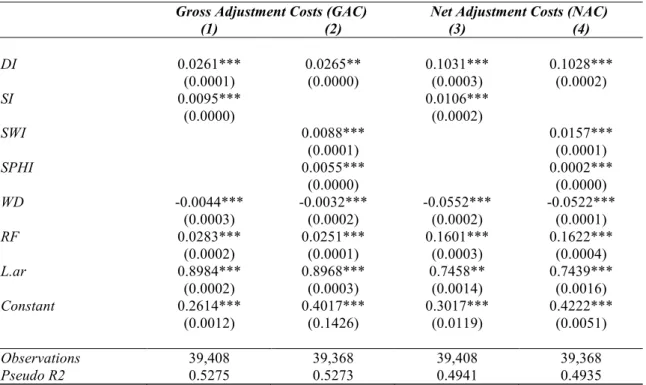
We performed four sets of estimations corresponding to the four equations presented in the previous section and report the results in Table 5. Columns (1) and (2) correspond to the results for gross adjustment costs. Columns (3) and (4) correspond to the results for net adjustment costs.
Overall, the estimation results point to a significant effect of demand and supply imbalances on adjustment costs. In the case of supply imbalances, both wind and solar photovoltaic deviation in generation exert a positive and significant effect on adjustment costs.
The results indicate that a 1% supply deviation increases, on average, the gross adjustment costs by 0.0095%. An equivalent supply deviation results in an increase, on average, of 0.0106% in the net adjustment costs. These outcomes are in line with the literature examining the effects of variable RES-E generation. Much more original and interesting are our results related to the positive and significant effects of demand deviations on system adjustment costs. We find that a demand deviation equivalent to 1% increases, on average, the gross adjustment costs by 0.0261% and the net adjustment costs by 0.1031%.
Table 5: Estimation results
Gross Adjustment Costs (GAC) Net Adjustment Costs (NAC)
(1) (2) (3) (4) DI 0.0261*** 0.0265** 0.1031*** 0.1028*** (0.0001) (0.0000) (0.0003) (0.0002) SI 0.0095*** 0.0106*** (0.0000) (0.0002) SWI 0.0088*** 0.0157*** (0.0001) (0.0001) SPHI 0.0055*** 0.0002*** (0.0000) (0.0000) WD -0.0044*** -0.0032*** -0.0552*** -0.0522*** (0.0003) (0.0002) (0.0002) (0.0001) RF 0.0283*** 0.0251*** 0.1601*** 0.1622*** (0.0002) (0.0001) (0.0003) (0.0004) L.ar 0.8984*** 0.8968*** 0.7458** 0.7439*** (0.0002) (0.0003) (0.0014) (0.0016) Constant 0.2614*** 0.4017*** 0.3017*** 0.4222*** (0.0012) (0.1426) (0.0119) (0.0051) Observations 39,408 39,368 39,408 39,368 Pseudo R2 0.5275 0.5273 0.4941 0.4935
Notes: QRIV results with the following instruments: GACt-2, NACt-2, DIt-1, SIt-1, SWIt-1, and SPHIt-1.Weighted
bootstrap standard errors in parentheses*** p<0.01, ** p<0.05, * p<0.1
In sum, the respective intensities of the impacts of demand and supply deviations are statistically different, being always higher in the case of the demand deviations. In a sector where all the focus is on the supply side, the estimations performed in this paper
for the Spanish electricity system highlight the importance of demand imbalances when explaining the cost of balancing services.
To gain additional insights from these outcomes, in Table 6 we present the estimated effects of the demand and supply deviations over gross and net average costs in €/MWh.
Table 6: Economic effects (€/MWh) from a one-percentage-point deviation in supply and demand
DI SI SWI SPHI
GAC 0.1174 0.0427 0.0396 0.0247
NAC 0.1808 0.0186 0.0275 0.0004
It should be stressed that when considering the two main RES-E technologies separately, the results show that wind supply deviations have a greater economic impact than that of photovoltaic supply deviations. According to our estimates, the economic impact of a one-percentage-point deviation in wind supply is 0.0396 € /MWh in gross terms and 0.0247 €/MWh in net terms.
As expected, the adjustment costs – both in gross and net terms – depend heavily on their value in the previous hour. Hence, a 1%-increase in the level of gross adjustment costs in the previous hour increases, on average, the adjustment service costs by 0.89%. An equivalent but lower increase (0.74%) is estimated when considering net adjustment costs. The inertial behaviour of system adjustment costs, related with the criteria followed by the System Operator (SO) for the assessment of control reserves, seems to account for these outcomes.
Our econometric results for the regulatory framework variable are consistent with those published in previous studies. Thus, the regulatory framework is relevant when we consider the evolution of adjustment costs: a reduction in supply flexibility (an increase in the share of coal production and a reduction in power from combined cycle plants) results in an increase in adjustment costs. Hence, regulatory factors that affect supply flexibility exert a positive and significant effect on adjustment costs.
Our results for the impact of the day of the week on operational costs present a negative and significant relationship between workings days and both gross and net adjustment costs. This negative effect can be accounted for by the differences in electricity consumption between a working day and the days of the weekend. On a working day, demand is higher and, therefore, the amount of conventional generation dispatched by the system is also higher. The amount of conventional generation connected to the system is positively correlated with the level of demand: therefore, when consumption is higher, the performance of the adjustment services is also higher. Likewise, the number of agents connected to the system capable of offering flexible services to it increases and the resulting price is more competitive.
6. CONCLUSIONS AND POLICY IMPLICATIONS
The ability of electricity systems to accommodate RES-E constitutes one of the main challenges for the future. Compared with conventional energy systems, in which the sources of uncertainty were not so great, electricity systems today have to deal with the uncertainty associated with RES-E generation.
This paper, in seeking to look beyond the impact of RES-E generation intermittency on the evolution of the total economic costs associated with the operation of the electricity system, represents the first attempt to estimate the sensitivity of these costs to other variables, above all real-time adjustments to electricity demand arising from inaccurate predictions.
From the broader perspective of energy policy and sector regulation, the key question here concerns how to improve the functioning of the adjustment services – integrated from several markets, including the resolution of the system’s technical restrictions, the allocation of ancillary services and the management of deviations – without increasing their relative costs. The adjustment services in operation in most electricity markets today were established when RES-E penetration had yet to achieve a significant level and as such they need to be improved. An in-depth understanding of the way in which these markets function and of the role played by the different explanatory variables, with a particular emphasis on demand and supply characteristics, is crucial to ensure a successful reform process. Among other objectives, minimizing program deviations must be one of the main goals of this reform. In this regard, the introduction of sufficient incentives to minimize imbalances and ensuring an active participation of RES-E generators in power balancing could form part of the solution.
Clearly, additional flexibility requirements should not be considered as the main constraint limiting the deployment of renewables in the power sector. There are a number of additional non-technical constraints that might also limit the deployment of RES-E generation, including the policy framework or the availability of finance and public support. The current situation of RES-E penetration in Spain constitutes a good example of just that.
Increasing RES-E penetration has given rise to a series of challenges as regards the ability of the electricity system to balance supply and demand, especially with high levels of intermittent renewable generation. This new scenario requires a detailed quantitative assessment of how the electricity system might both deliver and accommodate higher levels of RES-E generation and of the associated economic costs for the consumer. Given that the electricity system has to deal with other sources of uncertainty – primarily of demand – here we have evaluated and compared the economic costs of additional demand for reserve and the response operations associated with each source of uncertainty.
contrast with other studies that have focused their attention more specifically on supply effects. The estimations for the Spanish system reported here demonstrate that demand imbalances cannot be ignored when evaluating the cost of balancing services. In summary, under the assumed hypothesis, the estimations performed allow the following conclusions to be drawn:
- First, regardless of the adjustment costs – gross or net – and the level of aggregation of the supply-side resources considered, our results point to the relevance of demand imbalances. Indeed, the effects on adjustment costs are always stronger for deviations from the demand side than they are for those from the supply side.
- Second, our results show that the deviations have a greater impact on net adjustment costs than they do on gross adjustment costs. Future research in the field needs to try to overcome data limitations and to analyse the effects on the disaggregated components of the adjustment costs.
- Third, in Europe where renewable power capacities will soon be predominant in the generation mix, it is crucial that the volume of electricity imbalances within systems be minimized and the associated costs to end consumers be reduced. There are several reasons for these imbalances between generation and consumption, but our evaluation of the operational costs in the Spanish electricity system suggests that the demand effect cannot be ignored.
- The dynamic effects of these explanatory variables require further evaluation. Yet, our results indicate that the provision of stronger incentives to invest in technologies (e.g., better forecasting tools) is needed in order to minimize imbalance risks.
This paper has examined the balancing power used to quickly restore the supply-demand balance in Spain’s power system and the associated economic costs when real-time supply and demand deviations emerge. We have reported that variable renewable generation is a source of potential deviation that can increase short-term balancing needs. At the same time, errors in demand forecasts constitute an additional source of uncertainty that require balancing services. Interestingly, we have highlighted the relevance of demand effects on operational costs. All in all, however, supply and demand effects are crucial in the design of new balancing services.
REFERENCES
Agency for the Cooperation of Energy Regulators (ACER) (2014). Framework guidelines on electricity system
operation. Ljubljana. ACER.
Billor, N., Hadi, A.S. & Velleman, P.F. (2000). BACON: Blocked adaptive computationally efficient outlier nominators. Computational Statistics & Data Analysis, 34, 279–298.
Bohernstedt, G.W. & Knoke, D. (2002). Statistics for social data analysis (4th ed.). Wadsworth Publishing, Belmont. Borggrefe, F. & Neuhoff, K. (2011). Balancing and intraday market design: Options for wind integration. DIW Berlin
Discussion Papers, 1162.
Bueno-Lorenzo, M., Moreno, M.A., & Usaola, J. (2013). Analysis of the imbalance price scheme in the Spanish electricity market: A wind power test case. Energy Policy, 62, 1010–1019.
Chao, H. (2011). Efficient pricing and investment in electricity markets with intermittent resources. Energy Policy,
39(7), 3945–3953.
Chaves-Ávila, J. P., Hakvoort, R. A., & Ramos, A. (2014). The impact of European balancing rules on wind power economics and on short-term bidding strategies. Energy Policy, 68, 383–393.
Chernozhukov, V. & Hansen, C. (2006). Instrumental quantile regression inference for structural and treatment effect models. Journal of Econometrics, 132 (2), 491-525
Chernozhukov, V. & Hansen, C. 2008. Instrumental variable quantile regression: A robust inference approach.
Journal of Econometrics, 142 (1), 379-398.
Comisión Nacional de Energía (CNE) (2011). Propuesta de modificación de la regulación actual del cierre de
energía. Madrid. CNE
Cossent, R., Gómez, T., & Olmos, L. (2011). Large-scale integration of renewable and distributed generation of electricity in Spain: Current situation and future needs. Energy Policy, 39(12), 8078–8087.
Del Río, P., Ragwitz, M., Steinhilber, S., Resch, G., Busch, S., Klessmann, C., De Lovinfosse, I., Van Nysten, J., Fouquet, D. & Johnston, A. (2012b). Key policy approaches for a harmonisation of RES (E) support in Europe.
Main options and design elements. European IEE project Beyond 2020 (work package 7). Vienna.
DENA Grid Study I (2005). Integration into the national grid of onshore and offshore wind energy generated in
Germany by the year 2020. Berlin
DENA Grid Study II (2010). Integration of Renewable energy sources in the German power supply system from
2015-2020 with an outlook to 2025. Berlin
DNV-GL (2014). Integration of Renewable Energy in Europe. Final Report. Bonn. DNV-GL. European Commission (2013). Renewable energy progress report (COM (2013) 175). Brussels. EC.
EU-EWI Project (2012). Flexibility options in European electricity markets in high RES-E scenarios. Cologne. ENTSO-E (2012). Survey on ancillary services procurement and electricity balancing market design. Brussels. ENTSO-E.
ENTSO-E. (2013). Overview of transmission tariffs in Europe. Brussels. ENTSO-E EUROSTAT (2014).Energy Statistics. Brussels. Eurostat
Finon, D. & Menanteau, P. (2008). The static and dynamic efficiency of instruments of promotion of renewables.
Energy Studies Review 22 (1), 53–83.
Fox, J. (1991). Regression Diagnostics. Sage, Newbury Park, CA.
Frunt, Jasper (2011). Analysis of balancing requirements in future sustainable and reliable power system. PhD Thesis Eindhoven University of Technology. Eindhoven.
Gelabert, L., Labandeira, X. & Linares, P. (2011). An ex-post analysis of the effect of renewables and cogeneration on Spanish electricity prices. Energy Economics, 33, 59-65.
Gross, R. & Heptonstall P. (2008). The Costs and Impacts of Intermittency: An Ongoing Debate. Energy Policy,
36(10), 4005–7.
Helm, D. & Hepburn, C. (eds.) (2009). The economics and politics of climate change. Oxford. Oxford University Press.
Henriot, A. (2012). Market design with wind: managing the low predictability in intraday-markets. EUI Working
Papers RSCAS 2012/63.
Henriot, A. (2014). Market design with centralized wind power management: handling low-predictability in intraday markets. The Energy Journal, 35, 1.
Hirth, L. (2013). The market value of variable renewables. The effect of solar and wind power variability on their relative price. EUI Working Papers RSCAS 2013/36.
Hirth, L., & Ziegenhagen, I. (2013). Balancing power and variable renewables. A glimpse at German data.FEEM
Holttinen, H. (2005). Optimal electricity market for wind power. Energy Policy, 33(16), 2052–2063.
Holttinen, H., Meibom, P., Orths, A., Lange, B., O’Malley, M., Tande, J.O., Estanqueiro, A., Gomez, E., Söder, L., Strbac, G., Smith, J C. & Van Hulle, F. (2011). Impacts of large amounts of wind power on design and operation of power systems. Wind Energy, 14(2),179 –192.
Huisman, R. & Trujillo-Baute, E. (2014). Costs of power supply flexibility: the indirect impact of a Spanish policy
change. IEB Woking Paper Nº 2014/34.
Huber, M., Dimkova, D., & Hamacher, T. (2014). Integration of wind and solar power in Europe: Assessment of flexibility requirements. Energy, 69, 236–246.
International Energy Agency (2009). Design and Operation of Power Systems with Large Amounts of Wind Power. IEA Wind Task 25. Helsinki. IEA.
International Energy Agency (2011a). Deploying Renewables 2011: Best and Future Policy Practice. OECD/IEA. Paris.
International Energy Agency (2011b). Harnessing Variable Renewables. OECD/IEA. Paris.
Joskow, P. & Tirole, J. (2007). Reliability and competitive electricity markets. Rand Journal of Economics, 38 (1), 68-84.
Ketterer, J. C. (2014). The impact of wind power generation on the electricity price in Germany. Energy. Economics,
44, 270–280.
MacCormack, J., Hollis, A., Zareipour, H., & Rosehart, W. (2010). The large-scale integration of wind generation: Impacts on price, reliability and dispatchable conventional suppliers. Energy Policy, 38(7), 3837–3846. Morales, J. M.; Conejo, A. J.; Madsen, H.; Pinson, P.; Zugno, M. (2014). Integrating renewables in electricity
markets. Operational problems. Springer.
Mount, T.D., Maneevitjit, S., Lamadrid, A.J., Zimmerman, R.D. & Thomas, R.J. (2012). The hidden system costs of wind generation in a deregulated electricity market. Energy Journal, 33.
NERC (2010). Flexibility requirements and metrics for variable generation. Princeton. NERC. OECD (2011). Towards Green Growth. Paris. OECD.
Perez-Arriaga, I.J. &Batlle, C. (2012). Impacts of Intermittent Renewables on Electricity Generation System Operation. Economics of Energy & Environmental Policy, 1 (2), 3-17.
Ragwitz, M., Held, A., Resch, G., Faber, T., Haas, R., Huber, C., Morthorst, P.E., Jensen, S.G., Coenraads, R., Voogt, M., Reece, G., Konstantinaviciute, I., Heyder, B. (2007). Assessment and optimisation of renewable
energy support schemes in the European electricity market. Final Report. Karlsruhe. OPTRES.
RESPOND Project (2014). Renewable Electricity Supply interactions with conventional Power generation, Networks
and Demand. Petten. The Netherlands.
REN21 (2014). Renewables 2014 Global Status Report. Paris. REN21 Secretariat.
Rivero, E., Barquín, J., & Rouco, L. (2011). European Balancing Markets. 2011 8th International Conference on the
European Energy Market (EEM), 333–338
Sensfuß, F., Ragwitz, M. & Genoese, M. (2008). The merit-order effect: A detailed analysis of the price effect of renewable electricity generation on spot market prices in Germany. Energy Policy, 36(8), 3086-3094.
Strbac, G., Shakoor, A., Black, M., Pudjianto, D. & Bopp, T. (2007). Impact of Wind Generation on the Operation and Development of the UK Electricity Systems. Electric Power Systems Research, 77(9), 1214–27.
Swinand, G. & Godel, M. (2012). Estimating the Impact of Wind Generation on Balancing Costs in the GB Electricity Markets. 2012 9th International Conference on the European Energy Market (EEM 2012), 71–75. European Wind Energy Association (2009). Integrating Wind: Developing Europe’s power market for the large-scale
integration of wind power. Brussels. EWEA.
United Kingdom Government & Ireland Government (2008). All Islands Grid Study. Roskilde. Ireland
Vandezande, L., Meeus, L., Belmans, R., Saguan, M., & Glachant, J.M. (2010). Well-functioning balancing markets: A prerequisite for wind power integration. Energy Policy, 38(7), 3146–3154.
Weber, C. (2010). Adequate intraday market design to enable the integration of wind energy into the European power systems. Energy Policy, 38(7), 3155–3163.
Weber, S. (2010). BACON: An effective way to detect outliers in multivariate data using Stata (and Mata). Stata