Ana Maria GIL-LAFUENTE, PhD
E-mail: [email protected]
Department of Economics and Business Organization
University of Barcelona
Aras KEROPYAN, PhD
E-mail: [email protected]
GRIT-EAE Research Group
EAE Business School
Jaume BALVEY
E-mail: [email protected]
Association for Advancement in Modeling and Simulation in
Enterprises
ANALYSIS OF THE RELATIONSHIP BETWEEN THE ECONOMIC
ACTIVITY OF REGIONS AND WELFARE OF ITS INHABITANTS
Abstract: This research aims to reveal and quantify the magnitude of determination of economic activity on the welfare level of citizens. This is a crucial issue for all governments in Catalonia. In this research, Barcelona metropolitan area, the regions of the North Pyrenees and the rest of coastal and inland regions, each with different characteristics and specificities are analyzed. The governing institutions that manage the resources of the autonomous region, it is important that all citizens, regardless of where they live, can have the same level of welfare. For this reason, this research presents a first step in order to release the nature of the problem and to show to what extent, in quantitative terms, the economic activity types influence welfare. This analysis may guide the governors to take the necessary decisions in order to carry equal treatment to the all population.
Keywords: Economic activity, welfare indicators, fuzzy sets, regional economy, forgotten effects theory.
Ana Maria Gil-Lafuente, Aras Keropyan, Jaume Balvey
_________________________________________________________________ 1. Introduction
One of the fundamental tasks that have the governments and institutions is taking care of the welfare of its citizens. Catalonia, as an autonomous community belonging to Spain has some delegated powers, and therefore has the task of managing the wellbeing of its citizens in the best way possible.
One of the main problems of the Catalan government and institutions is the imbalance between its different regions. These institutions have to carry out some actions in order to manage well the imbalances between regions and rebalance the whole territory which will allow its all citizens to enjoy a similar standard of living,. In order to carry out this task, we present a methodology that relates in general terms how the economy of a region determines the quality of life of the population in relation to all others.
The study is based on data obtained mainly from IDESCAT, but we also consulted some information that we had access in the Research Institute of Applied Economics IREA-University of Barcelona.
At the end of the study, we present the connection between the main economic activity of regions and the quality of life of its inhabitants, within the whole Catalonia.
2. Theoretical Background
Catalonia is located in the northeast of the Iberian Peninsula, in the southern part of French and, therefore, is the transition territory to the rest of Europe. Its privileged geographical location has fostered the development of its territorial success thanks to being the gateway of tourism from Europe, among other strengths. Furthermore, the appeal of Barcelona (cosmopolitan, open-minded, and scientific and technological edge) allowed it to develop a well-built infrastructure which makes it one of the most important cities of southern Europe. On the other hand, the more peripheral regions of Catalonia, with a less privileged geographical location, have been shaping themselves with the development of other economic activities (agriculture, livestock, fisheries, mining, etc.).
In our research we discuss, first, the main economic activities in each of the regions of Catalonia. We consider four main economic activities grouped together
Analysis of the Relationship between the Economic Activity of Regions and Welfare of its Inhabitants
__________________________________________________________________ by the similarity of different tasks and jobs, as same as several subsectors. We will work on the following economic activities:
Primary sector: In this sector, jobs are grouped that involve primary sector activities such as: farming in general and fishing in any of its aspects. In the databases consulted we found a large dispersion of activities in Catalonia mainly because there are a lot of small business’ and small business owners. This task obstructed the individualized treatment of each of the sub-activities that shape the primary sector. To facilitate the collection of statistical data, we decided to treat the whole of the primary sector, regardless of the region that may have, taking into account different weights in its sub-activities.
Industry: This sector has a relative importance in different regions of Catalonia. However we analyzed jointly two different sub-activities: light industry and heavy industry. This sector includes all economic activities related to the process and treatment of both raw materials and semi-finished products at different stages. Construction: Although this is a specific tertiary sector, we decided to analyze it separately due to its importance in Catalonia, especially in the years before the economic crisis.
Service: In this section we grouped the entire service sector except construction. This broad economic sector is by far the one that most contributes to the GDP of Catalonia incorporating all activities related to services, such as: education, health, trade, transportation, public administration, food and beverage, etc. It is a very diverse and heterogeneous sector. Each of the Catalan regions, depending on their location, has different activities related to the service sector.
3. Description of the Model
All events and activities around us, including ourselves, are a part, one way or another, some kind of a system or subsystem, that is, we could say that almost all activities are a consequence of a cause-effect impact. Despite the establishment of good control systems, it is always possible to set aside or ignore some causal relationships which are not always explicit, evident or visible, and usually not perceived directly. It is common that those relations remain hidden because they
Ana Maria Gil-Lafuente, Aras Keropyan, Jaume Balvey
_________________________________________________________________ are effects over effects, and thus the accumulation of causes that are provoked by them. Human Intelligence need to rely on models and tools which are able to create a technical foundation that can enable the creation of all comparisons from the information obtained from the environment and bring out all the possible direct and indirect causal relationships.
The underlying idea behind the model we apply is based on the so-called "butterfly effect" that we have heard often. Popularly it is said that when a butterfly beats its wings in Mexico it causes a typhoon in Philippines. The idea of direct and indirect causal relationships is an accumulated evident. The direct relationship can be exampled such as: the beat of butterfly wing would cause the typhoon. The indirect relationship would be the accumulation of the elements that boost the movement of the air, from the beat of butterfly wings to typhoon.
In 1988, Kaufmann and Gil Aluja established the "Theory of the Forgotten Effects." This theory allows obtaining all direct and indirect relations, with no possibility of errors, recovering the effects as it is called: “Forgotten Effects". According to the authors, all happenings that surround us are part of a system or subsystem. It means we could almost ensure that any activity is subject to a problem is a result of “causes” and “effects”. Despite a good system control, there is always the possibility of leaving voluntarily or involuntarily some causal relationships that are not always explicit, obvious or visible, and usually they are not directly perceived. It is common that there are some hidden reasons of the problems that we encounter due to effects of incidence effects on outcomes. The forgotten effects theory is an innovative and efficient approach taking into account many aspects of the relations, and which enables minimizing the errors that may occur in many processes. For this study, we have two sets of elements (causes and effects):
A
a
i/
i
1
,
2
,...,
n
: economic activitiesB
b
j/
j
1
,
2
,...,
m
: welfare variablesWe assume that there is an occurrence of ai over bj if the value of the membership
functions of the feature pair (ai ,bj) is estimated at
0, 1
Analysis of the Relationship between the Economic Activity of Regions and Welfare of its Inhabitants
__________________________________________________________________ the array cannot be smaller than 0 or greater than 1 as if we had valued from 0 to 10 but in decimals):
ai,bj
ai,bj
0, 1The set of rated pair elements define the "direct relationship matrix”, which shows the cause relationships - effect on different levels that occur between the joint elements of the A set (causes-economic activities) and the joint elements of the B set (effects - welfare variables):
This matrix can also be represented by its associated relationship graph. In the case where the characteristic function of the property is null, the hoop that connects the elements of the sets A and B would be deleted:
=
M
a
1
b
1
a
2
a
3
a
4
a
5
a
i
b
2
b
3
b
4
b
j
a1b3
a1b4
a1bj
a1b1
a1b2
a2b3
a2b4
a2bj
a2b1
a2b2
a3b3
a3b4
a3bj
a3b1
a3b2
a4b3
a4b4
a4bj
a4b1
a4b2
a5b3
a5b4
a5bj
a5b1
a5b2
aib3
aib4
aibj
aib1
aib2
L
L
L
L
L
L
M
M
M
M
M
M
L
Ana Maria Gil-Lafuente, Aras Keropyan, Jaume Balvey
_________________________________________________________________
The accumulation process:
To continue with the explanation of the model, below we show how the effects can accumulate. If we suppose now the appearance of a third set of elements, different from the previous two:
C{ck/k1,2,...,z}
which consists of the elements that are the effects of the B set:
and having the common elements of the B set: = b2 b2 bm
b 1c2
b2cz
b2c1
b2c2
bmcz
b mc1
b mc2 N
L
L
L
L
c1 c2 cz
L
L
L
L
b 1c1
b1czAnalysis of the Relationship between the Economic Activity of Regions and Welfare of its Inhabitants
__________________________________________________________________
The incident graphs associated to each of the two matrices would be as following: = a1 a2 an
a
1b2
a2bm
a2b1
a2b2
bmcz
anb1
bmc2 M
L
L
L
L
b1 b2 bm
L
L
L
L
a
1b1 a
1bm = b2 b2 bm
b 1c2
b2cz
b 2c1
b 2c2
bmcz
b mc1
b mc2 N
L
L
L
L
c1 c2 cz
L
L
L
L
b 1c1
b1czAna Maria Gil-Lafuente, Aras Keropyan, Jaume Balvey
_________________________________________________________________ We can therefore say that the matrix P defines the causal relationships between the first of elements A set and the elements of the third C set, with the intensity or degree that leads to consider the elements belonging to set B.
M AB i N BC.
The mathematical operator to find out the effect of A on C is the max-min composition (least of all, we are left with the most). In fact, when there are three impact relationships we would have:
M AB , N BC , P AC
And the Kaufmann (1977) equation is induced to: M
N
P Where the
symbol represents precisely the max-min composition. The composition of two relations is uncertain such that:
a
i,c
z
A
C
:
a
i,c
z M
N
V
bj(
M (ai,bj)
N (bj,cz))We, therefore, affirm the relationship of impact P defines the causal relationships between the elements of the A set and the C set in the intensity or degree implying the elements belonging to the B set.
4. Development of the Model
Below we present two tables that include all the obtained statistical information, and have been normalized which means we divided all values of the column by the largest value. The aim is that all column values refer to the highest value which takes the value 1. We need normalized values on base 1 because, as you can see, Tables 1 and 2 include, respectively, the variables that meet for each of the regions of Catalonia, values between 0 and 1. Table 1 shows the importance of each welfare indicator for each region compared to the best position.
Analysis of the Relationship between the Economic Activity of Regions and Welfare of its Inhabitants
__________________________________________________________________ Table 1. Welfare indicators per regions of Catalonia
Following, Table 2 shows the relative weight of economic sectors in each region, including in relation to the best position. In this context the sum of the values of the four economic sectors is not equal to 1, since the normalization has been done on the basis of one regional indicator (per columns and not per rows):
Ana Maria Gil-Lafuente, Aras Keropyan, Jaume Balvey
_________________________________________________________________ Table 2. Weight of economic sectors, per region
Analysis of the Relationship between the Economic Activity of Regions and Welfare of its Inhabitants
__________________________________________________________________ These two tables provide us the extent of fulfillment level for analyzed variables of each Catalan region in relation with the region that has the highest indicator. But this information is not useful to make a global study. A part from that, we should take into account the impact of economic activities over regions which will help us to determine the welfare of the population in relation to the rest of indicators of the other regions. Thus, we perform a max-min composition between tables 1 and 2, in order to perform a combination of indicators based on the regions.
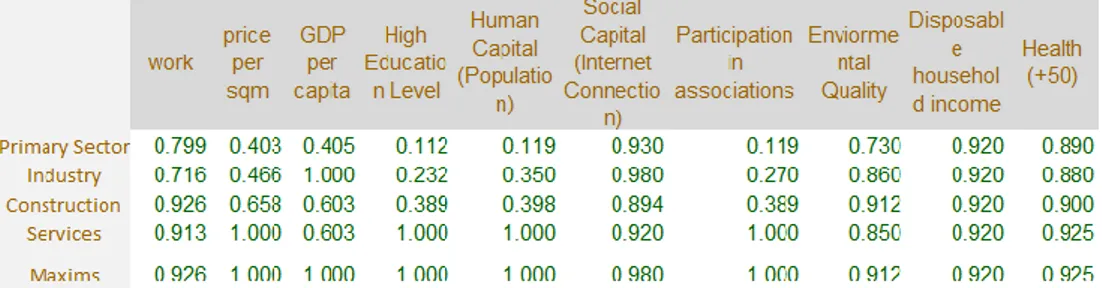
Below we present the max-min composition for each of the four sectors. In Table 3, the minimum values are taken between the columns, respectively, in the primary sector and other welfare indicators (work-labor, price per sqm, GDP per capita, etc.). At the end of each column we show the maximum of the all written minimums along the column.
Ana Maria Gil-Lafuente, Aras Keropyan, Jaume Balvey
_________________________________________________________________ Table 3. Max-min matrix taking into account primary sector, per region
We repeat the process for obtaining the max-min but this time taking the industry sector per regions. The first step is finding the minimums between industry column values in Table 2 and the values of each column (welfare indicators) of Table 1. At the end of each column, as in Table 4, we seek the maximum value.
Analysis of the Relationship between the Economic Activity of Regions and Welfare of its Inhabitants
__________________________________________________________________ Table 4. Max-min matrix taking into account industry sector, per region
The same operation is realized by taking into account the other sectors; construction and services of which we do not attach the min-max matrixes. Once the max-min compositions between the regional economic welfare values (Table 1) and economic activity sector indicators (Table 2) are calculated, we proceed to gather the results; the maximums that appear for each table (Table 5):
Ana Maria Gil-Lafuente, Aras Keropyan, Jaume Balvey
_________________________________________________________________ Table 5. Resume of the results obtained
Since this matrix is not normalized in basis 1, we proceed to divide each column by the largest value, which will serve us as a reference to evaluate other levels, obtaining the normalized matrix in Table 6. This matrix is the direct relationship matrix, as the economy sectors effect the indicators of economic welfare, taking into account all the information related to the Catalan regions which has been absorbed in the max-min composition calculations above.
Table 6. Normalized relationship matrix
As it has been justified in previous pages, the direct impacts are not enough to make an overall analysis, given that causes (economic activity) are conditioned by other causes, as well as the effects (welfare variables of the population) are affected not only by the direct causes, but also by other cross effects. Therefore it is necessary to construct two additional matrices. Table 7 shows the relations between sectors. You can see that each sector is 100% related to itself, but in relation to other sectors the impact is not symmetric, that is, for instance, the construction sector is not equally affected by the industry sector that on the construction industry.
Analysis of the Relationship between the Economic Activity of Regions and Welfare of its Inhabitants
__________________________________________________________________
Table 7. Relationship matrix between sectors
On the other hand, we build another matrix that relates each welfare economic indicator between each other. In Table 8, we show an asymmetric matrix that containing a maximum value (100%) when an indicator is related by itself:
Ana Maria Gil-Lafuente, Aras Keropyan, Jaume Balvey
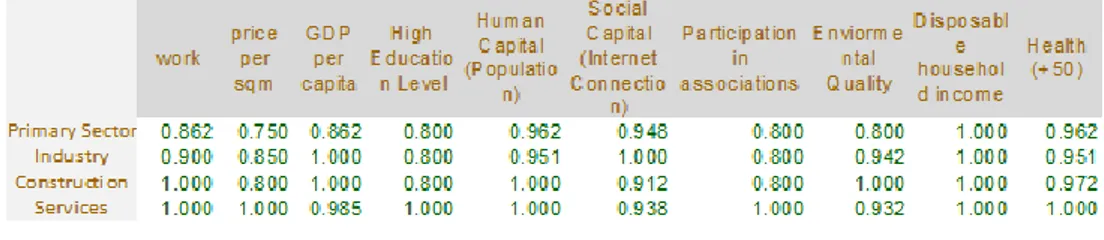
_________________________________________________________________ Finally, from matrices 6, 7 and 8 we calculate the final max-min composition matrix. This cause-effect matrix includes the impact of economic activities on the quality of life of the population; taking into account the possible effects of any variable that may have a direct effect. The results of the cumulative effects matrix are shown in Table 9:
Table 9. Final result matrix
5. Results and Conclusions
Once the calculations and relationship matrices are analyzed, we observe that on the cumulative basis any kind of economic activity affects the welfare of the population of the Catalan regions. We can see that, either directly or indirectly, the activity that has the minimum relation is 0.75 over 1 (in case of the primary sector over the price of housing in sqm).
In the results we can see that the primary sector is the sector that has the least influence over analyzed welfare indicators. Regarding to the influence of the construction and industry sectors we observe that their impact on the quality of life is positive. Finally, we see that the service sector is crucial to determine the quality of life of the people of the Catalan regions.
For example, if we analyze the effect of the construction sector on human capital (population) of a region, and if we only consider the direct effect (Table 6) we observe that the impact is 0.398 over 1. When we look at the direct and indirect cumulative effect the result increases to 1. The difference between the two values 0.602 (1-0.398) represents the isolated indirect effect. This means that the indirect effect is more important than the direct effect. In this case it is possible to know which variables are interjected, making the indirect effect more important. To find
Analysis of the Relationship between the Economic Activity of Regions and Welfare of its Inhabitants
__________________________________________________________________ it out it is necessary to follow the max-min composition process in the calculations. In this case we have:
The construction sector is fully (1) linked to the work variable on a maximum level (1) with the human capital (population) variable. In this way, it is possible to find out the more important indirect effects for each relationship.
To conclude the study the following considerations can be extracted from the entire developed article:
The initial hypothesis that we pretended is valid. The economic activities of the regions have a significant impact on the quality of life of its inhabitants. To verify the initial hypothesis, data comparison and normalized max-min composition processes have been realized. This operation allowed us to establish a benchmark and presenting bounded data (between 0 and 1), which facilitates the consequent analysis of the results.
It is shown that, despite all economic activities influence the welfare of the people, the impact of each sector is singular with the following order from high to less: service, construction, industry and primary sector. The regions with higher service sector presence have higher quality of life indicators and they are more sensitive to the developed economic activity. On the other hand it is possible to know the elements or variables that increase the direct causal effects that will permit performing certain actions at the institutional level.
Lastly, this methodology allows us to execute economic actions as it gives us ideas about the relationships between different economic sectors and their effect on the quality of life of citizens, being direct or indirect. This can allow managing resources more efficiently on institutional and governmental levels.
Ana Maria Gil-Lafuente, Aras Keropyan, Jaume Balvey
_________________________________________________________________ REFERENCES
[1] Bellman, R. E. & Zadeh, L. A. (1970), Decision-making in a Fuzzy Environment. Management Science;
[2] Gil-Aluja, J. (1998), The Interactive Management of Human Resources in Uncertainty. Kluwer Academic Publishers, Dordrecht;
[3] Gil-Lafuente, A.M. (2005), Fuzzy Logic in Financial Analysis. Springer, Berlin;
[4] Kaufmann, A. & Aluja, J. G. (1988), Modelos para la investigación de efectos olvidados. Editorial Milladoiro, Vigo;
[5] Kaufmann, A. (1975), Introduction to the Theory of Fuzzy Subsets. Academic Press, New York;
[6] Kaufmann, A. and Gil-Aluja, J. (1986), Introduction to the Theory of Fuzzy Subsets in Business Management (In Spanish). Ed. Milladoiro, Santiago de Compostela;
[7] Keropyan, A. and Gil-Lafuente, A. (2013), A Personal Selection Model Using Galois Group Theory. Kybernetes;
[8] Keropyan, A. and Gil-Lafuente, A. (2012), Customer Loyalty Programs to Sustain Consumer Fidelity in Mobile Telecommunication Market. Expert Systems with Applications;
[9] Keropyan, A. and Gil-Lafuente, A. (2011), A Fuzzy-based Decision Model Application on Strategic Management. African Journal of Business Management; [10] Merigo, J.M. and Gil Lafuente, A.M. (2008), The Generalized Adequacy Coefficient and its Application in Strategic Decision Making; Fuzzy Economic Review;
[11] Merigo, J.M. and Gil Lafuente, A.M. (2011), OWA Operators in Human Resource Management; Economic Computation and Economic Cybernetics Study and Research; ASE Publishing;
[12] Merigo, J.M. and Gil Lafuente, A.M. (2013), Decision Making with Induced Aggregation Operators and the Adequacy Coefficient. Economic Computation and Economic Cybernetics Study and Research; ASE Publishing; [13] Zadeh, L.A. (1965),Fuzzy sets. Information and Control.
DATABASE, WEB-PAGE
http://www.ub.edu/web/ub/es/recerca_innovacio/recerca_a_la_UB/instituts/institut spropis/irea.html