ESTIMATION OF MULTI-WAY TABLES SUBJECT TO
COHERENCE CONSTRAINTS
Fedele Greco1
Dipartimento di Scienze Statistiche, Universit`a di Bologna, Bologna, Italia
1. Introduction
Nowadays, traditional population censuses based on total enumeration of the pop-ulation are being accompanied by sample surveys. In the United States, Census Bureau implemented statistical sampling in a decennial census for the first time in 1940. From then on, sampling within censuses have been adopted in several European and non-European countries (Kish, 1979; Wright, 1998; Blum, 1999; UNECE, 2007). Sampling within censuses allows to reduce costs and workload of authorities involved in censuses operations, along with the statistical burden for the people involved in the enumeration. From the statistical point of view, sampling-based techniques allow to reduce non-sampling errors that affected the quality of census data at the price of introducing sampling errors that need to be properly managed.
The Italian National Institute of Statistics (Istat) introduced sampling-based tech-niques as one of the main innovations characterising the 2011 Italian Population Census. In particular, sampling techniques have been adopted for the simultane-ous use of short and long form questionnaires. The short form questionnaire con-cerns a small set of variables, related to all demographic and a few socio-economic data. The logn form questionnaire concerns the whole set of census variables. In municipalities with more than 20.000 inhabitants and in provinces capitals, such long form questionnaire have been submitted to a sample of households, while in municipalities with less than 20.000 persons a traditional approach have been planned, by submitting the long form to the whole population (Istat, 2012, 2010). With regard to the sampling design, simple random sampling of house-holds within Enumeration Areas (EA) was planned. The innovations give rise to several methodological challenges, related to the management of sampling error for delivering sensible estimates of population quantities. Among these challenges, it emerges the need to estimate multi-way contingency table involving variables measured via short form (census) and a long form (sampling) variable. In this framework, two main issues need to be addressed: first of all, sample size for esti-mating some of the entries of the contingency tables may be too small, delivering
estimates prone to huge sampling variability. On the other hand, since estimates of the joint distribution need to be coherent with the marginal distribution of the variable collected via a census, estimation methods need to be coherent with the constraint imposed by the marginal distribution of variables measured with the short form questionnaire. Moreover, several coherence constraints at several levels of geographical aggregation are imposed by the Istat publication plan. In a design based approach, Generalised Raking (Deville et al., 1993) is a natural choice for contingency tables estimation that comply to such constraints: this method is considered as a benchmark in what follows and comparisons with the model-based method proposed in this paper are discussed.
In the literature, this problem have been managed following both a design-based and a model-based approach (Little and Wu, 1991; Melilil and Petris, 1995; Pfef-fermann and Tiller, 2006; Steorts and Ghosh, 2013; You et al., 2013). In this paper we propose a small area model-based approach that takes account of the coherence constraints both with respect to marginal distributions of variables measured via short form and with respect to figures obtained by aggregating such tables in ge-ographical areas. The proposed method allows borrowing strength between areas and, as a consequence, it delivers more precise estimates than those obtained by direct estimators (Rao and Molina, 2015).
For the sake of simplicity, the proposed method is illustrated on a fairly small three-way contingency table comprising the variables Sex, Age and Economic Ac-tivity (EcA). Variable EcA consists in an Italian version of the European NACE classification of economic activities. According to the Istat publication plan, vari-ables Sex and Age are measured via short form and comprise I = 2 and L = 4 categories respectively. EcA is collected on a sample, via long form, and comprises K = 3 categories. We aim at estimating EcA population counts in A = 9 Enumer-ation Areas, such that estimates are coherent within areas and, when marginalising with respect to EAs, they allow to obtain the municipality-level table. Thus, in a given area, a I × L × K contingency table needs to be estimated. By means of a Monte Carlo experiment we compare the sampling errors of the proposed approaches to those of the Generalized Raking estimator. The rest of this paper is organised as follows: in Section 2 the estimation problem is formally described and a Bayesian model for coherence within EA-specific multy-way table is intro-duced. Finally, a posterior transformation approach for geographical coherence is discussed. Section 3 is devoted to a Monte Carlo simulation study for compari-son with the Generalised Raking estimator. Some final remarks are sketched in Section 4.
2. A bayesian small area model
In this section we propose a model-based approach for the estimation of contin-gency tables at the Enumeration Area level when marginal distributions of vari-ables collected via short form are known. In what follows, we denote with N cell counts known by census while cell counts involving variables subject to sampling are denoted as θ.
TABLE 1
Coherence in estimated contingency tables - Enumeration area level.
Sex i = 1 Sex i = 2
Age Age
EcA l = 1 l = 2 l = 3 l = 4 l = 1 l = 2 l = 3 l = 4 k = 1 θ11a1 θ12a1 θ13a1 θ14a1 θ21a1 θ22a1 θ23a1 θ24a1 θa1
k = 2 θ11a2 θ12a2 θ13a2 θ14a2 θ21a2 θ22a2 θ23a2 θ24a2 θa2
k = 3 θ11a3 θ12a3 θ13a3 θ14a3 θ21a3 θ22a3 θ23a3 θ24a3 θa3
N11a N12a N13a N14a N21a N22a N23a N24a
TABLE 2
Coherence in estimated contingency tables - Municipality level.
Sex i = 1 Sex i = 2 Age Age EcA l = 1 l = 2 l = 3 l = 4 l = 1 l = 2 l = 3 l = 4 k = 1 N111 N121 N131 N141 N211 N221 N231 N241 N1 k = 2 N112 N122 N132 N142 N212 N222 N232 N242 N2 k = 3 N113 N123 N133 N143 N213 N223 N233 N243 N3 N11 N12 N13 N14 N21 N22 N23 N24
Table 1 reports the three-way contingency table to be estimated for a given Enumeration Area. Since the last row of this table concerns only variables mea-sured via short form, it constitutes a constraint for the estimates of the table entries. Namely, estimates of entries θilak need to comply with the coherence
constraint:
K
X
k=1
θilak= Nila i = 1, . . . , I; l = 1, . . . , L; a = 1, . . . , A (1)
Note that this table needs to be estimated for all EAs, a = 1, . . . , A. Table 2 illustrates the municipality-level contingency table. In what follows we consider municipality-level counts Nilk to be known, even if they have been obtained as
Nilk = ˆθGRilk, where ˆθGRilk is the generic entry of the contingency table estimated via
Generalized Raking at the municipal level. This assumption is motivated by the fact that sample size at the municipality level is large enough to ensure negligible sampling variability. Coherence of the estimated contingency tables at EA-level requires that:
A
X
a=1
θilak= Nilk i = 1, . . . , I; l = 1, . . . , L; k = 1, . . . , K (2)
The strategy we propose in order to obtain estimates complying with both con-straints (1) and (2) is structured in two steps: firstly, we propose a Bayesian Hierar-chical model in order to comply with constraint (1), obtaining Monte Carlo Markov Chain (MCMC) samples from the posterior distribution of unknown counts.
Suc-cessively, a transformation approach is used to transform the posterior distribution via Raking, in order to comply with constraint (2).
2.1. A Bayesian hierarchical model - Complying with area-level constraints The following three-level Bayesian hierarchical model take account of the sampling variability of direct estimates at the first level. The second level relates the EA-level three-way contingency table to the municipality-EA-level table, while the third level is devoted to the management of the borrowing strength process.
Let ˆθHT
ila be the (K-1)-dimensional vector of the unconstrained Horvitz-Thompson
estimates of the number of individuals with Sex = i, Age = l, belonging to the first K-1 categories of the variable EcA at the a-th area.
At the first level of the hierarchy, sampling variability of the design-based estimates is taken into account by the following area-level model:
ˆ
θila•HT ∼ Nk−1(θila•, Σila) (3)
where the covariance matrix Σila = f (θila•) measuring the uncertainty of
Horvitz-Thompson estimates, is a function of the unknown parameters θila•. Even
if the sampling units are indeed households, the function f is specified under the simplifying hypothesis of simple random sampling of individuals in Enumeration Areas, since the Design Effect of cluster sampling is broadly equal to 1. Under this hypotheses: Σila(k,k)= Na− na Nana (θilak+ .5)(Na− θilak− .5) k = 1, . . . , K − 1 (4) Σila(k,k′)= Na− na Nana (θilak+ .5)(Na− θilak′− .5) k 6= k′ (5)
where Naand naare, respectively, the population count and the sample size in area
a. This specification of the covariance matrix allows to address two problems. First of all, it avoids to use design-based (direct) estimates for building the covariance matrix: such estimates are usually considered known and, because they suffer from huge sampling variability, are subject to smoothing for building the covariance matrix. Second, the variance for entries whose estimate is zero can be evaluated. At the second level, in order to relate EA-level tables to the municipality-level table, the following Multinomial model is assumed:
(ˆθila•, ˆθilaK) ∼ M ultinomial(p1|ila, . . . , pK|ila, Nila) (6)
where pk|ila denotes the conditional probability to be in EcA = k given that
Sex = i, Age = l and Area = a. It is worth noting that this specification allows to comply with constraint (1) but does not take account of constraint (2): for this reason, estimates obtained by this model will need further adjustment.
Conditional probabilities pk|ila are modeled as:
where vila• is an area-specific random effect and logitm() is the multivariate
logit function. Vector p•|il denotes the conditional distribution of the variable
EcA in the municipality under study, assumed to be known. Thus, area-level con-ditional probabilities are centered on the municipality-level known probabilities, and random effects vila• are devoted to manage heterogeneity between areas. As
regards random effects vila•, we assume
vila• ∼ NK−1(0, Γil) (8)
Γ−1il ∼ W ishart(IK−1, K − 1) (9)
where Γildenotes the random effects covariance matrix for which a fairly vague
Wishart prior is chosen. This specification allows borrowing strength between ar-eas: actually, it implies shrinkage of area-level estimates toward municipality level known quantities. More general specification of the covariance matrix can be ob-tained by introducing further relationships of conditional dependence among areas, taking into account, as an example, spatial correlation or similarity with respect to socio-economic features. Such extensions will be object of future research.
2.2. Transformation of the posterior distribution - Complying with municipality-level constraints
The model specified in equations (3)-(8) can be estimated by means of a MCMC algorithm. Since the proposed model is fairly simple, it can be easily estimated with standard software for MCMC-based Bayesian Inference such as OpenBugs (Lunn et al., 2000) or STAN (Carpenter et al., 2016).
The problem to be addressed in this section is that model-based estimates ˆθM ila•=
E(θila•|ˆθila•HT) do not comply with constraint (2), i.e. A
X
a=1
ˆ
θMila•6= Nilk (10)
In a fully Bayesian approach, this could be managed by a more sophisticated model that generalizes the Multinomial distribution according to a suitable mul-tivariate distribution belonging to the Fr´echet class. However, flexible (and easy-to-implement in a MCMC framework) distributions belonging to this class are not known (see, among others, Melilil and Petris (1995)). An immediate straightfor-ward approach could consist in raking of the posterior means (see for example Fay and Herriot (1979)), but this would fail to properly take into account posterior uncertainty. For this reason, we follow a more customary approach adopting the transformation methodology proposed in Gunn and Dunson (2005).
Given an MCMC sample of size G, θgila•, g = 1, . . . , G from the posterior distribu-tions p(θila•|ˆθ•HT), we obtain G samples from the posterior distribution of raked
estimates by raking each MCMC sample, this turns out in the transformation: p(θila•|ˆθHT• ) Raking−−−−−→ p(θila•∗ |ˆθHT• ) (11)
This delivers an MCMC sample θ∗,gila•, g = 1, . . . , G, from the posterior distribu-tion p(θ∗
ila•|ˆθ•HT) that can be used to produce both point estimates and uncertainty
measures related to cell count estimates. The important point is that raked pos-terior distributions allow to comply with both coherence constrains (1) and (2), indeedPA
a=1θ∗ila• = Nilk.
For this reason, we propose as point estimator for cell counts: ˆ
θila•RP D= E(θila•∗ |ˆθHT• ) (12)
Since model implementation and raking of the posterior distribution are fairly simple, the procedure described in this Section can adopted in a more general framework where a huge number of coherent multy-way tables need to be estimated in order to deliver detailed official statistics.
3. A Monte Carlo experiment
In this section we discuss the results of a Monte Carlo experiment designed for comparing the efficiency of model based estimates ˆθRP D
ila• (12) with Generalised
Raking estimates denoted in what follows as ˆθGR
ila•. The experiment is based on
data from the 2001 Population Census coming from a municipality composed by 9 Enumeration Areas. Both design based and model based estimates are obtained on B = 1000 Monte Carlo samples. As a measure of performance, we use the Relative Mean Squared Error (RMSE) defined as:
sRM SEilak= 1 B B X b=1 ˆθb,s ilak− θilak θilak !2 (13) where subscript s = RP D is referred to model-based estimates obtained by Raking the Posterior Distribution while s = GR is referred to design-based esti-mates obtained via Generalised Raking; ˆθb,RP Dilak is the posterior mean of θilakbased
on the b-th Monte Carlo simulation. In Figure 3,GRRM SE andRP DRM SE are
compared for each θilak> 0. Results show that GRRM SE is, for a large number
of cells, quite greater thanRP DRM SE. This positive feature of the model-based
approach is particularly appreciable for cells with small population counts. In-deed, as expected, the merit of the borrowing strength process activated by the model is particularly appreciable when cell-specific sample size is not large enough in order to deliver stable estimates. For this reason, from now on we restrict our attention to performances on population cells with frequency less than 10%.
In Table 3, results for groups of cells with population frequencies between 0.1% and 30% are summarized. For each group of frequencies, the average RMSE of the Generalised Raking estimator, the number of cells involved, the average count within cells and the ratioRP DRM SE/GRRM SE are reported.
The gain in efficiency obtained from model-based estimation is inversely pro-portional to the frequency to be estimated. When population cell frequencies are between 10% and 30% (see last row of Table 3), both model-based and design-based estimates are very precise due to the high sampling fraction, this turns out
Figure 1 – RP DRM SE vs GRRM SE, the solid line indicates the bisector of the first
quadrant.
TABLE 3
Comparison between model-based and design-based approach in terms of RMSE for cell frequencies< 30%.
Frequencies GRRM SE Cells N¯ RP DRM SE/GRRM SE
0 -0.0001 1.1253 31 3.06 0.3090 0.0001-0.0025 0.1918 38 8.39 0.3914 0.0025-0.005 0.0878 17 20.53 0.6065 0.005-0.01 0.0398 12 44.75 0.7252 0.01-0.05 0.0098 38 168.18 0.9074 0.05-0.1 0.0015 38 397.45 0.9450 0.1-0.3 0.0005 20 1423.40 1.0364
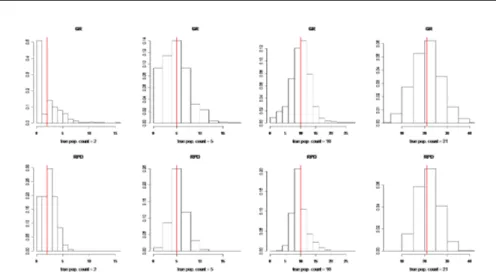
Figure 2 – Sampling distribution of ˆθGR
ila•(first line) and ˆθ RP D
ila• (second line). The vertical
line is referred to true counts.
in a negligible RMSE for both GR and RPD estimates: thus, for these cells, ad-justment obtained by raking the posterior distribution is irrelevant. On the other hand, when cell frequencies are lower than 10%, the merit of the model-based procedure is evident. The ratioRP DRM SE/GRRM SE ranges from 0.3 for the 31
cells with very low frequencies to 0.94 for for the 38 cells with frequencies between 5% and 10 %.
Figure 3 compares the sampling distribution of ˆθRP D
ila• and ˆθila•GR for selected
cells with small counts. The reduction in sampling variance is quite evident: both estimators are centred around the true value, but the ˆθRP D
ila• estimator is
more concentrated and shows improvements with respect to the left tail, i.e. with respect to samples where the ˆθGR
ila• underestimates the true value.
As a further display of simulation results, Figure 3 reports box-plots of the sampling distribution of the estimators for true cell counts between 0 and 19. When the true cell count is zero, ˆθGR
ila• is always equal to zero since, when sample
data provide a 0 direct estimate, the estimator is equal to 0. For this reason, almost all box-plots referred to this estimator include 0 even for larger counts. On the other hand, ˆθRP D
ila• show a clear increasing trend of all the quantiles of the
sampling distribution with respect to true counts.
4. Conclusions and future work
Introduction of sampling techniques within population censuses raise several prob-lems related to estimation of population quantities. In this paper we dealt with one of those problems, i.e. the estimation of coherent multi-way tables. The pro-posed approach is based on a Bayesian hierarchical model for achieving within-area coherence and raking of the posterior distribution for achieving municipality-level coherence.
Figure 3 – Box-plots of the sampling distribution of ˆθGR
ila• (first panel) and ˆθ RP D ila• (second
panel) vs true counts.
The proposed methodology is built with the aim to deliver a feasible estimation procedure with respect to computational effort and stability of the algorithms. This is particularly appealing if one considers that Istat needs to produce a huge amount of coherent multi-way tables for hundreds of different variables measured via long form and for different levels of spatial aggregation. Despite of its simplic-ity, the method have proven to be very efficient in reducing the sampling variability of direct estimates by activating a borrowing strength process. Such process can be extended in several directions by specifying different structures of the random effects covariance matrix and by introducing further relationships of conditional dependence between Enumeration Areas. A limitation of the RPD estimator is its applicability to only one long form variable at a time. Extensions to the case of considering several variables subject to sampling will be object of future research.
Acknowledgements
The research activity leading to this paper was partially funded by a FIRB 2012 grant (title: Statistical modeling of environmental phenomena: pollution, meteo-rology, health and their interactions) for research projects by the Italian Ministry of Education, Universities and Research.
References
O. Blum(1999). Combining Register-Based and Traditional Census Processes as a Pre-Defined Strategy in Census Planning. Annual Conference of the Federal Committee on Statistical Methodology, Washington DC, USA.
Be-tancourt, M. Brubaker, J. Guo, P. Li, A. Riddell (2016). Stan: A probabilistic programming language. Journal of Statistical Software, , no. In Press.
J. Deville, C. Sarndal, O. Sautory (1993). Generalized raking procedures in survey sampling. Journal of the American Statistical Association, 88, no. 423, pp. 1013–1020.
R. Fay, R. Herriot (1979). Estimates of income for small places: An application of james-stein procedures to census data. Journal of the American Statistical Association, 74, no. 366a, pp. 269–277.
L. Gunn, D. Dunson (2005). A transformation approach for incorporating mono-tone or unimodal constraints. Biostatistics, 6, pp. 434–49.
Istat(2010). Beyond the 2010 census round: plans for the 2020 round. Economic Commission for Europe, Conference of European Statisticians, Geneva, 7-9 July 2010.
Istat(2012). A new strategy for the 2011 Lessons learned from use of registers and geocoded databases in population and housing census. Economic Commission for Europe, Conference of European Statisticians, Paris, 6-8 June 2012.
L. Kish(1979). Samples and censuses. International Statistical Review / Revue Internationale de Statistique, 47, no. 2, pp. 99–109.
R. Little, M. Wu (1991). Models for contingency tables with known margins when target and sampled populations differ. Journal of the American Statistical Association, 86, pp. 87–95.
D. Lunn, A. Thomas, N. Best, D. Spiegelhalter (2000). Winbugs – a bayesian modelling framework: concepts, structure, and extensibility. Statistics and Computing, , no. 10, pp. 325–337.
E. Melilil, G. Petris (1995). Bayesian inference for contingency tables with given marginals. Journal of the Italian Statistical Society, 2, pp. 215–233. D. Pfeffermann, R. Tiller (2006). Small-area estimation with state: Space
models subject to benchmark constraints. Journal of the American Statistical Association, 101, pp. 1387–1397.
J. Rao, I. Molina (2015). Small area estimation. 2nd Edition. John Wiley & Sons, Hoboken (N.J.).
R. C. Steorts, M. Ghosh (2013). On estimation of mean squared errors of benchmarked empirical bayes estimators. Statistica Sinica, 23, no. 2, pp. 749– 767.
UNECE(2007). Register-based statistics in the Nordic countries. United Nations, Geneva.
T. Wright(1998). Sampling and censuses 2000: The concepts. American Scien-tist, 86, pp. 99–109.
Y. You, J. Rao, M. Hidiroglou (2013). On estimation of mean squared errors of benchmarked empirical bayes estimators. Survey Methodology, 39, no. 1, pp. 217–230.
Summary
Nowadays, traditional population censuses based on total enumeration of the population are being accompanied by sample surveys. Sampling within censuses allows to reduce costs and workload of authorities involved in censuses operations, along with the sta-tistical burden for the people involved in the enumeration. In this paper, we deal with estimation of multi-way contingency tables involving variables measured both via cen-sus and sampling. In this framework, two main issues need to be addressed: first of all, sample size for estimating some of the entries of the contingency tables may be too small, delivering estimates prone to huge sampling variability. On the other hand, since estimates of the joint distribution need to be coherent with the marginal distribution of the variable collected via a census, estimation methods need to be coherent with the constraint imposed by marginal distribution of variables measured via census. The problem is tackled via a model-based approach that allows to comply with all coherence constraints following a fairly simple procedure. The merit of the proposed methodology is illustrated by means of a simulation study.
Keywords: Population Census; Multi-way tables; Generalised Raking; Bayesian hierar-chical models.