Dipartimento di Scienze Statistiche, Università di Bologna, Bologna, Italia
1.
I
NTRODUCTIONInterest in the measurement of community well-being and quality of life (QOF) has increased in recent decades because of its relevance for the governance of a territory and the development of the population’s standard of living. In the literature, two main approaches for the QOL measurement have been proposed, that are objective and subjective. An increasing body of literature considers objective indicators such as GDP, consumption, wealth, income, security and education as proxy for the elementary constituencies of well-being, generally evaluated at different administrative levels (see among others: Murias et al., 2006; Jurado and Mayo, 2010; Gonzalez et al., 2010; Lawless and Lucas, 2010). Well-being can also be measured directly through a subjective evaluation of a person’s quality of life using the Subjective Well Being (SWB) measure (Diener, 1984; Diener and Suh, 1997; Diener et al., 1999; Diener et al, 2003; Kahneman and Krueger, 2006; van Praag, 2011; van Praag et al., 2003). This approach has some appealing features: it provides a direct measure of the individual’s cognitive and affective reactions to her or his whole life and specific domains of life (for a review see Diener, 1984; Diener et al., 1999); it offers additional evaluation useful for validation of objective indicators; relying on individual satisfaction as measured by validated items and scales, it also guarantees comparability across communities and over time (Diener and Suh, 1997).
From a statistical perspective, the construction and estimation of a SWB indicator within a given community entails two main issues: the measure of a multidimensional concept largely subjective in nature and the aggregation technique used to synthesize individual evaluations in an index. As regard the first point, a large body of literature has assumed that individual well being or satisfaction with life results from a combination of various domain satisfactions (Diener, 1984; Diener et al., 1999; Sirgy, 2002; van Praag et al., 2003; van Praag, 2007, 2011). Furthermore, following the bottom-up spillover theory (Sirgy et al., 2000; Sirgy and Cornwell, 2001;Sirgy and Cornwell, 2002, Sirgy et al., 2008; Sirgy et al., 2010), life satisfaction is functionally related to satisfaction with all of life’s domains and satisfaction within a specific life domain accumulates and vertically spills over to super-ordinate domains (for a review see: Diener, 1984; Diener et al. 1999; Sirgy, 2002). Then, a formative measure of community well-being, constructed on bottom-up spillover
theory, reflects several dimensions of subjective well-being and is likely more predicative compared to global measures of community well-being and QOL.
The second issue regards the procedure to construct a SWB indicator. Being a mathematical aggregation of different sub-indicators, the Composite Indicators (CIs) have increasingly been accepted as a useful tool for the construction of SBW measures (Zhou et al., 2010). In CIs construction, the weighting and aggregation technique represents an important step because the subjectivity in determining the weights directly affects the quality and reliability of the resulting CIs (Nardo et al., 2005).
In literature several approaches have been proposed for the definition of weights, being classifiable in three main groups: data-driven, normative, and hybrid weighting (Decancq and Lugo, 2013). Data-driven approaches let the data ‘speak for themselves’ and depend solely on the distribution of the data. Then, data-driven weights (i.e. frequency– based weights, statistical weights, DEA and Benefit of the Doubt) are not based on any explicit value judgments about how the trade-offs between the dimensions should be. Conversely, normative approaches (i.e. equal or arbitrary weights, expert opinion weights) only depend on the value judgments on the trade-offs and are not based on the distribution of the data. In other words, if one of the achievement vectors in the society changes, but the valuations of the individuals stay the same, the weights obtained by a data-driven approach will change, but the ones obtained by a normative procedure will remain unaffected. A hybrid approach (i.e stated preference weights, hedonic weights) combines both approaches and uses information on the value judgments together with information on the actual distribution of the achievement vectors, summarized in the data. In literature, there is no agreement about the best approach to use in the construction of SWB measures.
Recently, several papers have focused on the advantages and drawbacks of the different approaches (Decancq and Lugo, 2013) and investigated the sensitivity and robustness of the different weighting systems in respect to the individual scores distribution and ranking. Uncertainty and sensitivity analysis contribute to the well-structuring of the composite indicator, to provide information on the robustness of rankings and to identify ways to reduce uncertainty in rankings, for better monitoring and planning policy-actions. This stream of research has focused on the most suitable method to apply in measuring the objective indicators of well-being (Saisana et al., 2011; Munda and Saisana, 2011; Zhou and Ang, 2009; Cherchye et al., 2008). At our knowledge, no comparative analyses for the assessment of subjective well being indicators have been provided in the literature.
In this paper we further the existing literature in several ways. First, we focus on community SWB and compare different weighting systems, that are the equal weights under the normative approach, and the factorial and DEA weights under the data-driven approach. In particular, as proposed in a recent study by Bernini et al. (2012), we adopt a common-weight DEA model, by using the Benefit of the Doubt framework. Second, we contrast the different set of weights, discussing their meaning and policy implications. Third, we compare both SWB distributions and rankings obtained with the different methodologies trough parametric and non-parametric tests. Finally, we apply the proposed approaches to measure the SWB to a novel sample of residents in the Romagna area of Italy and in the nearby state of S. Marino, a developed territory homogeneous by economic and social standards and cultural heritage.
2.
L
ITERATURE INSIGHTSA large body of literature has assumed that individual well being or satisfaction with life is a combination of various domain satisfactions (Diener, 1984; Diener et al., 1999; Sirgy, 2002; Van Praag et al., 2003; van Praag, 2007, 2011). Following Van Praag (2007, 2011) and Van Praag et al. (2003), Global Satisfaction or Well Being (SWB) may be expressed by a function SWB = f ( DS1, . . . , DSJ ) and the various domain satisfactions ( DS1, . . . , DSJ ) are explained by a set of functions DSj = DSj (xj) ( j = 1, 2, . . ., J ), where xj stands for the sub-selection of x variables for the domain j. Following Van Praag et al. (2003), we call this function as a satisfaction function, considering the terms happiness, subjective well-being, satisfaction and utility interchangeable. As underlined by the authors, the satisfaction functions is subjective, because it is derived from gauging subjective feelings, and individualized because individual variables determine life satisfaction.
As underlined by Bernini et al. (2012), the satisfaction function has several appealing features that may be useful used to define and measure a community SWB indicator. First, the satisfaction function well reflects the bottom-up spillover theory. As previously underlined, the bottom-up spillover theory has received a large consensus in the development of SWB measures (Sirgy et al., 2000; Sirgy and Cornwell, 2001; Sirgy and Cornwell, 2002, Sirgy et al., 2008; Sirgy et al., 2010). The bottom-up theory (Andrews and Withey 1976; Campbell et al. 1976) asserts that life satisfaction is functionally related to satisfaction with all of life’s domains (community, family, work, social life and health), and satisfaction with a particular life domain is subsequently influenced by lower levels of life concerns within that domain. The bottom-up spillover theory claims that satisfaction within a specific life domain accumulates and vertically spills over to super-ordinate domains (for a review see: Diener, 1984; Diener et al. 1999; Sirgy, 2002). Then, postulating that subjective well being is functionally related to all life’s domains, it may be directly translated into the satisfaction function context. Other advantages of the satisfaction function are that it is measurable, allows comparability among individuals, elicits individual preferences and well adapts to the CI structure (Bernini et al., 2012). Therefore, self-reported satisfaction measures and satisfaction functions are useful new instruments for evaluating individual well-being and preferences, and designing socio-economic policies that may enhance the well being of groups of individuals or of the society as a whole, or distinguish help with respect to life-domains (Van Praag, 2007, Ferrer-i-Carbonell and Frijters, 2004).
In constructing a composite well-being indicator, there is however a problem regarding the weighting system, that is the relative weights of the subjective well-being dimensions. As Decaneq and Lugo (2013) argue, weights are central in determining the trade-offs between the dimensions of well-being. Weights are also crucial in choosing the list of candidate dimensions, by assigning a positive value to some dimensions and zero to those left out. In that sense, they reflect particular value judgements on how a ‘good life’ should look like. This makes the problem of selecting the appropriate weighting scheme, one with clear normative implications. The Authors distinguish between three important classes of approaches to set the weights: data-driven, normative, and hybrid. Data-driven weights are a function of the distribution of the achievements in the society and are not based, at least explicitly, on any value judgement about how the trade-offs between the dimensions should be. Normative approaches, on the other hand, only depend on the value judgements about the trade-offs and are not based on the actual distribution of the achievements in the society under analysis. Hybrid approaches are data-driven but also
depend on some form of valuation of these achievements.
The main techniques belonging to the Data-driven class are: Frequency-Based Weights (where the weight of a dimension is determined as a function of the distribution of the achievement levels in that domain), Statistical and Most Favourable weights. As for Statistical weights, two sets of statistical approaches may be employed to select the most appropriate weighting scheme, that are descriptive and explanatory models. The first approach relies on multivariate statistical methods to summarize the data. The most commonly used techniques are based on principal components (Klasen 2000, Noorbakhsh 1998) and cluster analysis (Hirschberg, Maasoumi and Slottje 1991). The use of these statistical techniques is motivated by a concern for the so-called problem of double counting. In many empirical applications the dimensions of well-being are found to be strongly correlated, and multivariate statistical techniques adjust for the correlation between indicators by either choosing the dimensions that are not correlated or by adjusting the weights so that correlated dimensions get less weight (Nardo et al. 2005). The second approach, sometimes known as latent variable models, is an explanatory approach that assumes that some observed variables (dimensions) are dependent on a certain number of unobserved latent variables (Krishnakumar and Nadar 2008). Factor analysis is the simplest case of a latent variable model, imposing that the observed dimensions are in fact different manifestations of the latent component, or factor. In the context of well-being indices, factor analysis has been widely employed (Maasoumi and Nickelsburg 1988, Schokkaert and Van Ootegem 1990, Nolan and Whelan 1996, Noble et al., 2008)1. There
are, however, some drawbacks to these multivariate statistical approaches. First, the obtained linear combinations of dimensions might be hard to interpret as a facet of individual well-being (Srinivasan 1994). The derivation of weights through principal component or latent variables models is also, by no means, straightforward and hence it lacks transparency, which makes these technique less attractive as a method to informing policy makers (de Kruijk and Rutten 2007). As pointed out by Nardo et al. (2005), correlations do not necessarily represent the real influence of the indicators on well-being . Moreover, weights based on statistical approaches (and all other data-driven approaches) can change between different editions of the same index, so that comparability over time is lost. Most crucially, there is a priori no reason to believe that statistical weights are in accord with people's perceptions about priorities and relative importance of each dimension (de Kruijk and Rutten 2007). Multivariate statistical techniques are developed to summarize the data in a statistically reasonable and parsimonious way, allowing to useful aggregate indicators within dimensions, but this is quite a different task to setting weights that are normatively reasonable.
Another stream of research has focused on the Most Favourable weighting system. The rationale is that when applying the same weighting scheme to all individuals, some of them might feel that the evaluation of their well-being is submitted to someone else's perspective on what well-being exactly is. Therefore, a researcher might want to give all individuals the ”benefit of the doubt" and select for each individual the most favourable weighting scheme. This approach is based on the Data Envelopment Analysis (DEA)
1
More advanced latent models include other exogenous variables that also might influence the latent variable but are not part of the selected set of dimensions used to construct the index. In this line, Multi-ple Indicator and MultiMulti-ple Causes Model (MIMIC) and structural equation models (SEM) have been pro-posed to construct multidimensional indices (Di Tommaso 2006, Kuklys 2005, Krishnakumar 2007, Krishnakumar and Ballon 2007).
proposed by Charnes et al. (1978). This method is a linear programming technique originally used to estimate the efficiencies of Decision Making Units (DMUs) within production contexts characterised by multiple outputs and inputs. After the paper of Cook and Kress (1990), DEA technique has come to be used as a flexible tool for ranking DMUs through the construction of CIs (Alder et al., 2002). The strength of this approach is that once the objective is defined, the algorithm automatically determines the weights structure. The capability to select the factor weights that are the most advantageous for each DMUs in calculating their SWB explains the popularity of the DEA approach in the QOL (objective approach) literature (Cherchye et al., 2007; Melyn and Moesen, 1991). This approach has also another appealing feature: as underlined in Cherchye et al. (2007) and Cooper et al. (2000), DEA allows to interpret the weight as a relative measure of importance associated to each domain using the Benefit of the Doubt (BoD) approach. The conceptual starting point of BoD is that, in the absence of detailed knowledge on the correct weights of underlying domains, information on the weights can be retrieved from the observed data themselves. Specifically, the core idea of the BoD is the data-oriented perspective: good relative performance of a unit (relative to other observed units) on a sub- indicator dimension is considered to be revealed evidence of comparatively higher indicator importance, while the reverse position is taken for sub-indicator on which the unit relatively poorly performs. Since a unit weights are not known, it is assumed that they can be inferred from looking at relative strengths and weaknesses. In details, this approach entails that the researcher looks for unit specific weights which make its composite indicator value as high as possible (Melyn and Moesen, 1991). The flexibility in selecting the weights allowed by the DEA, however, deters the DMUs comparison on a common base. To rank all the DMUs on the same scale, a common weights solution under the DEA framework can be also utilised (Despotis, 2002; Jahanshahloo et al., 2005). As underlined in Bernini et al. (2012), this approach generates a common set of weights that not only differentiate efficient DMUs, but also estimate the relative importance of each factor (i.e. domain) in the SWB indicators. Even if the use of the DEA approach has been growing in the last decade, some Authors criticise it for two main reasons (Decaneq and Lugo, 2013). First, they argue that the obtained results depend highly on the exact formulation of the technical constraints chosen by the analyst, making it a less transparent procedure. Moreover, Decaneq and Lugo (2013) underline that there is no a priori reason why a certain dimension on which the individual performs relatively well should have a larger impact on total well-being.
Regardless of the weighting and aggregation technique, it may be difficult to reach an agreement on the weights of the compared entities because each entity has its own peculiarities. For example, the DMUs that are classified at the bottom of the ranking may criticise weights. Conversely, in several empirical applications, it is important that the CI would be recognised as a measure of the phenomenon under observation by all the units. To limit researchers’ subjectivity, the most frequent strategy used in CI construction is adoption of an Equal Weighting structure, that is the Normative Weights approach. Being the “more objective”, this choice is more likely to preserve the consensus among the DMUs. Despite its popularity, equal weighting is far from uncontroversial. Chowdhury and Squire (2006) refer to equal weighting as “obviously convenient but also universally considered to be wrong.". Moreover, researchers should be aware that the equal weighting scheme is actually a weighting scheme as any other without specific normative attractiveness, and just as any other weighting scheme it implies trade-off that might be reasonable or not. Other examples of the Normative approach are the Expert opinion (i.e.
weights are based on opinions of several experts or informed persons) and Price-Based Weights (i.e. weights are derived once the marginal rates of substitution between the dimensions of well-being are known and some assumptions are made on the transformation functions and the degree of substitutability).
Finally, a Hybrid approach has been proposed in literature, combining both previous approaches and using information on the value judgements together with information on the actual distribution of the achievement domains. In particular, the Stated -Preference weights are based directly on the opinions of (a representative group of) individuals in the society. In that sense it is both a data-driven approach and one that depends on the valuation of the individuals themselves. Unfortunately, in most data sets questions to derive individual valuations are not available, limiting the extent of application of this approach. Yet, as these data become more widely available, one can imagine that stated preference weights become a method of choice for many. The idea of the Hedonic-Weights approach is to retrieve information about the implicit valuation of well-being by the individual through information about her. In this framework, the weights can be derived from a (usually linear) regression of life satisfaction on a set of variables representing the different dimensions of well-being (Nardo et al., 2005).
In general, regression based weights have the drawback that they need an appropriate measure for life satisfaction, which might not always be available. Furthermore, when the included dimensions of well-being are highly correlated, the estimated coefficients will be biased, affecting their significance. In addition, multicollinearity might hamper the interpretation of estimated coefficients as relative importance of the dimensions to overall well-being, as the estimates do not allow for the disentanglement of the effect of an explanatory variable, independent of the others to which this is related. Finally, one has to make the difficult (normative) decision about which variables to treat as dimensions of well-being and which as exogenous control variables.
3.
T
HE WEIGHTING APPROACHES IN THE CONSTRUCTION OF COMPOSITE SWB INDEXESThe simplest and wider technique to aggregate sub-indicators in a CI is the equally weighted sum model (EWSM). Assume that there are n entities (that are individuals) whose
CI
j are to be calculated based on M domains obtained aggregatingk
m sub-indicators for each domains. Lety
mij denote the value of entity j with respect to sub-indicator i of the domain m. All the sub-sub-indicators are assumed to be the benefit type (they satisfy the property of ‘‘the larger the better’’). The purpose is to aggregate m sub-indicators into a composite indicator for the individualj j
(
=
1,..., )
n
, then the SWB index under the EWSM approach can be formulated as:= =
=
∑
∑
1 1m k M i mij m m j
y
k
EWSM
M
(1)number of the item in the domain m. At the empirical level, the use of the EWSM implies the equality of the weights for all the domain. The relative importance of each sub-indicator is only a function of
k
m.The second approach we consider is the factorial analysis, where the weight are choose according to the variance of each item. To adapt factor analysis in the SWB framework we suggest using a second-order factor models (SOFM). As pointed in Chen et al. (2005), this approach is applicable when the lower order factors are substantially correlated with each other and there is a higher factor hypothesized to account for the relationship among lower factor. Then, a second-order factor model has several potential advantages over a first-order factor model (Chen et al., 2005, Gustafsson and Blake 1993, Rindskopf and Rose, 1988) and well reflects the bottom up spillover framework.
The Data Envelopment Analysis (DEA) proposed by Charnes et al. (1978) is a linear programming technique originally used to estimate the efficiencies of DMUs within production contexts characterized by multiple outputs and inputs. After the paper of Cook and Kress (1990), DEA technique has come to be used as a flexible tool for ranking DMUs through the construction of . A review of the ranking methods applied in the DEA framework is presented in Alder et al. (2002). The strength of this approach is that once the objective is defined, the algorithm automatically determines the weights structure. The capability to select the factor weights that are the most advantageous for each decision-making units (DMUs) in calculating their SWB explains the popularity of the DEA approach in the QOL (objective approach) literature. Standard DEA approach maximizes the CI value of each entity, subject to the constraint that the obtained weights produce results consistent for all the DMUs . The construction of a basic DEA model to is as follows:
s.t.
=≤
=
∑
11,
1, ,
...
M ij ij iy w
j
n
≥
0,
=
1,...,
=
1 ..,
,
.
ijw
j
n
i
M
(2)The weights are nonnegative and DMUs’ scores lies between 0 (the worst) and 1 (the best). As noted by Despotis (2005), this model is formally equivalent to the original output maximizing multiplier DEA model presented by Charnes et al. (1978). The difference is that all sub-indicators are viewed as “output” because are assumed of the benefit type, while a unitary ‘dummy input’ is assigned to each DMU. In this case, eq. (2) is generally named the DEA-like model. As required by the model, the solution (denoted by
E
*j) is the best attainable level for the DMUj. Any other set of weights would result in a CI that is less than or equal to .Because DEA models are separately run for each DMU, the set of weights is different for the various sub-indicators and DMUs. Unfortunately, the flexibility in selecting the single DMU’ optimal weights prevents DMUs comparison on a common base. To rank all
the DMUs on the same scale, a common weights solution is preferable. It allows the policy maker to measure the relative importance of each different sub-indicator in the community SWB.
Despotis (2002) proposes DEA algorithms that are solved by a common set of weights, by using a multiple objective programming problem. There are different solutions to solve this multiple objective maximization (Despotis, 2002; Kao and Hung, 2005; Zohrehbandian et al., 2010). Any solution gives a different set of common weights that not only rank the units, but also assesses all of the DMUs on the same scale. Despotis suggests the utilization of the constrained maximization solution given in eq. (3), where
j
d
is the distance between the unconstrained basic DEA score and the score obtained with the common weights solution. More formally, the optimal solution is given by the vector of weightsw
i that minimise the deviation between the basic DEA score and the score obtained with the common weights:=
⋅ ⋅
∑
+ − ⋅
1(1
)
1
n j jmi
d
n
n t
t
z
s.t.
=+
=
=
∑
* 1,
1, .,
..
M ij ij j j iy w
d
E
j
n
ε
− ≤
=
=
≥
≥
=
≥
0,
1,...,
,
1, ,
0,
1,...,
z
0
.
. .
j j id
j
n
w
i
M
d
j
n
z
(3)where t ranges between 0 and 1. For t=1, the objective function to be minimized represents the arithmetic mean of . This choice ensures that the sum (or the mean) of CIs along DMUs reaches its maximum value. For t=0, the objective function to be minimised represents the maximum of
d
j. This choice maximises the CI value of the DMU that is more penalised in respect to the unconstrained basic DEA solution.As recently underlined by Bernini et al. (2012), the Despotis (2002) approach (with t=1) can be useful used to obtain a SWB index that maximizes the overall community satisfaction. The advantages of this approach are the capability to either overcome subjectivity in the weights estimation or, thanks to the BoD, interpret the weighting system as a measure of the relative importance of each domains on the SWB.
4.
T
HE RESEARCH DESIGNincludes the provinces of Rimini, Forlì-Cesena, Ravenna and the republic of San Marino, accounting for 3% of the national population. It is a wealthy area thanks to the development of manufacturing as the textile and mechanical sectors. The economy of this area is also based on the advanced-services sector (banking, consulting) and, in particular, on tourism and entertainment. In Romagna, there is 7% of Italian accommodation structures (NACE 55) and 5% of Italian entertainment activities (NACE 93). Moreover, the three provinces are rated among the top 15 in the ranking of 107 Italian provinces made by Il Sole24ore (2011), by using a CI measured by objective indicator of QOL. San Marino is an independent republic that borders the Rimini Province. Unfortunately, the low quality of official statistics produced in the republic of San Marino avoids the possibility to describe the socio-economic characteristics of the territory. The statistics of the population are not available except with a very aggregated detail, and information on the economic characteristics are not published.
Data used in the analysis were collected in the Romagna area in the period January -March 2010, by conducting a telephone survey. The sampling design was based on stratification with respect to territorial (Rimini, Forlì and Cesena; Ravenna; San Marino) and demographic characteristics (age and gender). The final sample consists of 810 questionnaires. The sample characteristics are summarized in Table 1.
TABLE 1 Profile of Respondents N. % Provinces Forlì-Cesena 252 31.1% Ravenna 248 30.6% Rimini 250 30.9% San Marino 60 7.4% Gender Male 421 52.0% Female 389 48.0% Age <25 65 8.0% 25-35 119 14.7% 35-45 178 22.0% 45-55 130 16.0% 55-65 96 11.9% >65 222 27.4% Labour market position
Self empl. / manager 123 15.2% White collar / Teacher 133 16.4% Blu collar 155 19.1% Other 122 15.1% Retired 212 26.2% Student 65 8.0%
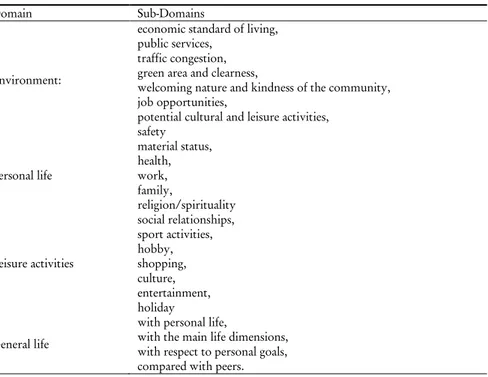
Following the bottom-up spillover theory, we measure SWB by using 4 domains and 25 sub-domains. The main domains are environment, satisfaction with specific life aspects, leisure activities and life as a whole; the dimension by which they are measured are reported in Table 2. Most of the items have been extracted from the review of previous studies published by various Authors in this field of research. Residents were required to
give a score (using a Likert-scale 1-7) that measures the satisfaction respect to each sub-domains2.
TABLE 2 Domain and Sub-Domains Domain Sub-Domains
Environment:
economic standard of living, public services,
traffic congestion, green area and clearness,
welcoming nature and kindness of the community, job opportunities,
potential cultural and leisure activities, safety Personal life material status, health, work, family, religion/spirituality Leisure activities social relationships, sport activities, hobby, shopping, culture, entertainment, holiday General life
with personal life,
with the main life dimensions, with respect to personal goals, compared with peers.
5.
R
ESULTS5.1. Reliability analysis
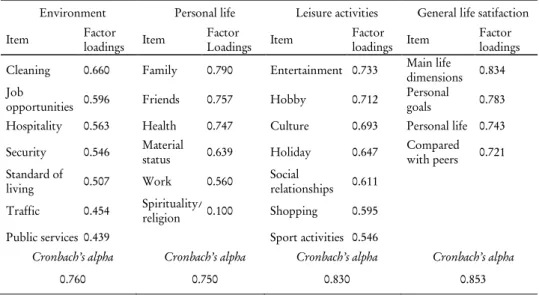
A preliminary exploratory factor analysis is performed in order to individuate the factors underlying the items of the questionnaire and their internal consistency. Results are presented in Table 3. The loadings associated with almost all the items are quite high, indicating that the items are influenced significantly by the corresponding underlying construct. Furthermore, all the factors show a Cronbach's alpha higher than 0.75 being quite good (Nunnally, 1970).
The Cronbach's alpha index is slightly lower for the Personal life domain, but its value improves to 0.82 when spirituality/religion is excluded, suggesting that spirituality/ religion does not contribute to the variance of this factor (Table 4).
TABLE 3 Factor analysis
Environment Personal life Leisure activities General life satifaction Item Factor loadings Item Factor Loadings Item Factor loadings Item Factor loadings Cleaning 0.660 Family 0.790 Entertainment 0.733 Main life dimensions 0.834 Job
opportunities 0.596 Friends 0.757 Hobby 0.712
Personal
goals 0.783 Hospitality 0.563 Health 0.747 Culture 0.693 Personal life 0.743 Security 0.546 Material status 0.639 Holiday 0.647 Compared with peers 0.721 Standard of living 0.507 Work 0.560 Social relationships 0.611 Traffic 0.454 Spirituality/ religion 0.100 Shopping 0.595 Public services 0.439 Sport activities 0.546
Cronbach’s alpha Cronbach’s alpha Cronbach’s alpha Cronbach’s alpha
0.760 0.750 0.830 0.853
TABLE 4 Cronbach’s alpha
Environment Personal life Leisure activities General life satifaction Item alpha Item Alpha Item Alpha Item Alpha Cleaning 0.732 Family 0.665 Entertainment 0.798 Main life dimensions 0.791 Job
opportunities0.735 Friends 0.671 Hobby 0.802
Personal
goals 0.802 Hospitality 0.741 Health 0.674 Culture 0.808 Personal life 0.830 Security 0.744 Material status 0.692 Holiday 0.812 Compared with peers 0.827 Standard of
living 0.749 Work 0.706 Social relationships 0.814 Traffic 0.755 Spirituality/
religion 0.825 Shopping 0.813 Public
services 0.732 Sport activities 0.825 Cronbach’s alpha Cronbach’s alpha Cronbach’s alpha Cronbach’s alpha
0.760 0.750 0.830 0.853
Having verified the validity of the four factors (Environment, Personal life domain, Leisure activities and General life), the construction of a SWB index under a CI approach is developed by considering three competing methods: simple mean (ESWM), double-factorial model (SOFM), and common-weight DEA (DEA). The goal is to evaluate the different set of weights, as well as compare SWB distributions and rankings obtained with the different weighting systems. The three aspects are relevant for policy making and evaluation: ranking allows a direct comparison of the different DMUs performance, score distribution (in term of variability and mean values) reflects the distance among the DMUs, and weights reveal the trade-offs between the domains of well-being.
5.2. The comparisons of the weighting systems
By construction the weights of a linear combination, build to rank
n
individuals, represent the importance of any single sub-indicator on the overall CI value. However, in the QOL framework, interpreting these weights as the importance of domains on the overall well-being is not straightforward among the different approaches. As underlined in Decancq and Lugo (2013), the values of the weights are not directly comparable given the different objectives pursued by the different techniques. Moreover, the lack of a widely accepted theoretical framework on how to set the trade-offs among the domains suggests to be very careful in interpreting the obtained orderings of the weight vectors.Normative techniques make inherently possible this interpretation: the weighting scheme is chosen according to a view on how the well-being should look like. Experts could be called to give the importance to different domains, but more frequently all domains are assumed equally important for all DMUs. A drawback of the normative approach is that some DMUs might feel that the evaluation of their well-being is submitted to someone else’s perspective on what well-being exactly is. In literature, Expert driven approaches are thus criticized as they suffer of ”paternalist” (Decancq and Lugo, 2013). The DEA approach previously proposed allows to overcame this critique. The DMUs get the Benefit Of the Doubt by self-selecting the (common) most favourable weighting scheme. Then, DEA common-weights could be interpreted as a measure of the relative importance associated to each domain by the surveyed individuals. Finally, as for SOFM the derivation of weights is less straightforward and the technique remains less attractive as a method to inform policy makers about domains importance (de Kruijk and Rutten, 2007). This approach enables weights to only correct for overlapping information between two or more correlated indicators, and hence they are not a measure of the theoretical importance of the associated indicators. However, the square of the factor loading represents the proportion of the total unit variance of the indicator which is explained by the domain, then it became possible to look at SOFM weights as measures of the “agreement” between DMUs: the higher the weight, the higher the differences among individuals in evaluating the domain.
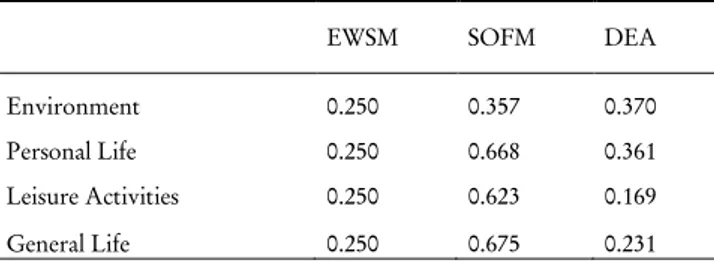
We calculate the SWB index by considering three competing methods: simple mean (ESWM), double-factorial model (SOFM), and common-weight DEA (DEA). Table 5 shows the weighting systems estimated by these techniques. The Environment and Personal Life are the two most important domains for residents in the Romagna area, as evidenced by their highest DEA weights. The weights obtained by SOFM show, however, that the importance with which the environment is perceived as a constituent of SWB is more shared in the surveyed population than the Personal Life domain (the factorial weight associated to Personal Life is almost double of that related to Environment). The common-weight DEA approach assigns the lowest weight to the leisure domain, and the SOFM weight suggests a low degree of agreement among residents regarding the importance to this factor in determining the overall SWB. This disagreement is somehow expected in an area that offers several leisure opportunities. Tourism and entertainment activities represent in fact the major industry in the Romagna area.
Finally, it is to note that in all approaches (with the exception of the equal weight), weights may change over time. Therefore, the information contained in the weight ranks, do not allow for more than an "ex post" analysis of how well-being look like. The time-variability of weights prevents to understand in advance (“ex-ante”) in which domains is better to address the limited resources at the disposal of policy makers, in order to
maximize the effect on future SWB measure (without regarding to political goals or assessments on the effectiveness of the spending in different sub-domains).
TABLE 5 Domain’s weights
EWSM SOFM DEA
Environment 0.250 0.357 0.370 Personal Life 0.250 0.668 0.361 Leisure Activities 0.250 0.623 0.169 General Life 0.250 0.675 0.231
5.3. The comparisons of rankings and shape distributions
Being the SWB scores not Normally distributed, we suggest using non-parametric techniques to evaluate correlations and compare shapes of the rankings obtained by the different approaches. One of the most used non-parametric test is the Spearman test for the null of no correlation among the values of SWB indexes, enabling to investigate whether the different weighting systems modify the final ranking. Results in Table 6 show that the rankings statistically covary, being the Rho values always higher than 0.93 (p-value less than 0.1%). Then, the ranking appears to be robust in respect to the different weights.
TABLE 6 Spearman Test results
Rho p.value DEA/EWSM 0.9818 0.000 EWSM/SOFM 0.9779 0.000 SOFM/DEA 0.9368 0.000
Another interesting issue regards the effect of the weighting systems on the DMUs’ position within the rankings. To this aim, we evaluate the shift for each unit between the rankings of the three SWB indicators. Figure 1 shows the kernel distributions of the values for the shift in the rank of each SWB index with respect to the rank of the others (i.e. DEA/EWSM shows the individual shift from the EWSM rank to the DEA one). The plot evidences that distributions are unimodal whit relevant differences in their variability. The mean value is almost 61 positions for the DEA – SOFM rank, and it decreases to 37 and 32 for the EWSM- SOFM and EWSM- DEA, respectively. According to the Spearman's Rho values, the highest differences between ranks are obtained applying the DEA and the SOFM techniques, while DEA and EWSM display a more similar ranking.
Figure 1 - Shift in the individuals’ rankings
To further the analysis of the effects of the weighing system on the shape distributions, we plot the kernel distributions of the SWB indexes (Figure 2). Distributions look quite different and higher values are detected when the DEA algorithm is applied. This result is somehow expected because, by construction, the DEA technique seeks for weights that once used in the linear combination of the domains guarantee the score maximization.
The shape distributions of the SWB indicators also display different means and variances. As expected, SOFM technique returns SWB index with a higher variance and a lower mean than the other two distributions. To further investigate these evidences, we test the null of equal density and pairwise independence between the distributions, by using non-parametric statistical tests. In particular, we test both the null of equality density applying the Li, Maasoumi, and Racine (2009) test, and the null of pair-wise independence of two univariate density functions through the Maasoumi and Racine (2002) test. Results, reported in Table 7, indicate that the SWB distributions differ significantly even if the pairwise independence are rejected for all the approaches, as pointed out by the Maasoumi and Racine test. This finding confirms and generalizes previous evidences based on the Spearman rho test.
These findings are relevant from a political perspective. The policy makers are interested in evaluating either the mean level of the community SWB or the variability of the perceived well-being among the community. This last feature is particularly important for designing and planning effective strategies directed to improve the overall quality of life in an area. Previous evidences confirm that the three approaches return similar rankings but the score distributions are not equal. The questions now are: to what extent the differences between score distributions depend on the different techniques used to calculate the SWB indicators? Are differences mainly due to the estimated mean level of well-being or to variability among DMUs?.
0 .0 0 5 .0 1 .0 1 5 -200 0 200 400 DEA/EWSM EWSM/SOFM SOFM/DEA
Figure 3 - Kernel score density distributions.
TABLE 7 Non parametric test results Li, Maasoumi, and Racine
(2009)
Maasoumi and Racine (2002) Test p.value Test p.value DEA/EWSM 18.65 0.000 0.528 0.000 EWSM/SOFM 147.97 0.000 0.507 0.000 SOFM/DEA 105.26 0.000 0.360 0.000
Then, to investigate the possible causes of the differences in the scores distributions, we perform a sequence of tests imposing different standardisation to the SWB distributions, that is constraining the average, variance and range of scores to be equal. Results of the Li, Maasoumi, and Racine tests performed on different standardisations of the SWB indicators are reported in Table 8. DEA and EWSM distributions results to be statistically equal, regardless of the imposed constraints (with a p-value less than 5%). At the 10% threshold the picture is less marked, as imposing equal average values or ranges doesn’t generate statistically equal distributions. Conversely, the SOFM distribution is always statistically different in respect to the DEA; while in respect to the EWSM only the simultaneous constraints of equal mean and variance or equal minimum and maximum (range) make the two distribution statistically equal. The highest similarity between EWSM and DEA may largely depend on the similarity in the functional form used for the construction of the indicators. TABLE 8 -3 -2 -1 0 1 2 3 0 .0 0 .5 1 .0 1 .5 2 .0 2 .5 S c o re D is tr ib u ti o n SOFM DEA EWSM
Li, Maasoumi, and Racine test results by using different standardisation
Equal range Equal mean Equal variance Equal mean and equal variance Test p.value Test p.value Test p.value Test p.value DEA/EWSM 2.957 0.100 3.821 0.067 2.396 0.300 2.116 0.500 EWSM/SOFM 1.337 0.267 147.567 0.000 290.247 0.000 0.653 0.467 SOFM/DEA 7.390 0.000 99.107 0.000 219.493 0.000 5.698 0.000
In general, the restriction of an equal mean has minor effects in determining the difference among the three indicators. Conversely, the effect of the variance constraint is more relevant. Being the difference between rankings largely dependent from the variability of the scores, it confirm what is expected (and required) from a SWB indicator, which aim is not only to evaluate an absolute level of individual well-being but primarily the comparison between individuals. When the ranking of (individual) SWB is the focus (rather than the absolute level of individual SWB), the relative distance between the DMUs becomes important and this distance is measured by variability.
TABLE 9
Li, Maasoumi, and Racine test using different standardizations for the group of the “Young”
Equal range Equal mean Equal variance Equal mean and equal variance Test p.value Test p.value Test p.value Test p.value DEA/EWSM 0.851 0.233 1.810 0.033 -0.098 0.800 -0.556 0.933 EWSM/SOFM 5.281 0.000 34.878 0.000 74.646 0.000 6.034 0.000 SOFM/DEA 5.426 0.000 32.911 0.000 71.007 0.000 5.000 0.000
Finally, we verify whether and to what extent the differences between SWB distributions are influenced by membership of DMUs to different socio-demographic groups. To this aim, we perform the Li, Maasoumi, and Racine tests on different groups of the whole sample, classifying individuals by sex, age and professional status. Results confirm previous findings on the effects of the different standardizations also within socio-demographic clusters. Table 9 shows the tests for the group of the “young” (i.e. residents aged between 18 and 35), being this group the most diverse from the full sample3. For young people, the SWB distributions obtained with EWSM and SOFM techniques result to be statistically not equal regardless of the standardizations.
6.
C
ONCLUSIONThe construction and estimation of a SWB indicator within a given community is rather complex and entails two main issues. The first concern is that the measure of a
3
multidimensional concept is largely subjective in nature, depending on how individuals perceive their own life. The second issue regards the aggregation technique and the weighting system used to obtain a synthetic index. On the last issue, the literature hasn’t reached a general consensus and has continuously expanded. Alternative weighting techniques have been proposed, leading to different SWB indicators. As for subjective well-being measures, little attention has been dedicated to investigate in deep the causes of these differences.
In this framework, this paper furthers the existing literature by comparing either SWB distributions or DMU rankings obtained from the different techniques. In particular, we examine three of the widely used weighting systems, namely DEA with common weight, equally weighted, and double-factorial model. As a case study, we use evaluations on the quality of life of a sample of residents in the Romagna area.
As regards the weight values, residents in the Romagna area evaluate the Environment (measured by: cleaning, job opportunities, hospitality, security, standard of living, traffic and public services) as the most important domain affecting SWB. As evidenced by the SOFM weights, residents also concord that this domains is the mainly relevant.
The analysis results show that SWB distributions are statistically different regardless of the weighting systems. DEA and SOFM are the techniques producing score distributions with the greatest differences. Differences remain significant even if scores are standardized for the mean, and this finding is also confirmed within diverse socio-demographic groups. In general, differences among score distributions are mainly due to the variability of the estimated indicators. This result is relevant because variability is an important parameter for the policy makers, reflecting the distance in well-being between DMUs.
Finally, the different weighting systems produce more similar results in term of SWB rankings. The score ranks are highly correlated although the lowest covariance are observed between SOFM and DEA technique.
REFERENCES
N.ALDER,L. FRIEDMAN,Z.SINUANY-STERN (2002). Review of ranking methods in data envelopment analysis context. European Journal of Operational Research, 140, pp. 249-265.
F.M.ANDREWS,S.B.WITHEY (1976). Social indicators of well-being: America’s perception of quality of life. Plenum Press, New York.
C.BERNINI,A.GUIZZARDI,G.ANGELINI (2012). DEA-Like Model and Common Weights
Approach for the construction of a Subjective Community Well-Being Indicator. Social Indicator Research.
A.CAMPELL,P.F.CONVERSE,W.R.RODGERS (1976). The quality of American life. Sage, New York.
A.CHARNES,W.W.COOPER,E.RHODES (1978). Measuring the efficiency of decision making units. European Journal of Operational Research, no.2, pp. 429-444.
F. F. CHEN, K. H. SOUSA, S. G. WEST (2005). Teacher’s Corner: Testing Measurement Invariance of Second-Order Factor Models. Structural Equation Modelling: A
Multidisciplinary Journal, 12, no. 3. pp. 471-492.
L.CHERCHYE,W.MOSEN,N.ROGGE,T.VAN PUYENBROECK,A.SALTELLI,R.LISKA,S: TARANTOLA (2008). Creating composite indicators with DEA and robustness analysis: the case of the Technology Achievement Index. Journal of the Operational Research Society, 59, 239-251.
L.CHERCHYE,M.WILLEM,N.ROGGE,T.VAN PUYENBROECK (2007). An introduction to benefit of the doubt composite indicators. Social Indicators Research, 82, pp. 111-145.
S.CHOWDHURY,L.SQUIRE (2006). Setting weights for aggregate indices: An application to the commitment to development index and human development index. The journal of Development Studies, 42, no. 5. pp. 761-771.
W.D. COOK,M. KRESS (1990). A Data Envelopment Model for Aggregating Preference Rankings, Management Science, 36, no. 11, pp. 1302-1310.
W. W. COOPER, L. M. SEIFORD, K. TONE (2000). Data envelopment analysis. A comprehensive text with models, applications, references and DEA-solver software, Kluwer, Boston.
K.DECANCQ,M.A.LUGO (2013). Weights in Multidimensional Indices of Well-Being: An Overview. Econometric Reviews, 32, no. 1, pp. 7-34.
D.K.DESPOTIS (2005). A reassessment of the human development index via data envelopment
analysis. Journal of the Operational Research Society, 56, pp. 969-980.
D. K. DESPOTIS (2002). Improving the discriminating power of DEA: focus on globally efficient units. Journal of the Operational Research Society, 53, pp. 314-323.
E.DIENER (1984). Subjective Well Being. Psychological Bulletin, 95, no. 3, pp. 542-575.
E.DIENER,E.SUH (1997). Measuring quality of life: economic, social and subjective indicator. Social Indicators Research, 40, pp. 189-216.
E.DIENER,E.M.SUH,R.E.LUCAS,H.L.SMITH (1999). Subjective well-being: Three decades
of progress. Psychological Bulletin, 125, no. 2, pp. 276–302.
E.DIENER, S.OISHI,R. E.LUCAS (2003). Personality, culture and Subjective well-being: emotional and cognitive evaluations of lif. Annual Review of Psychology, 54, pp. 403– 425.
A. FERRER-I-CARBONELL, P. FRIJTERS (2004). How important is methodology for the estimates of the determinants of happiness?. Royal Economic Society, 114, pp. 641-659.
E.GONZALEZ,A.CARCABA,J.VENTURA (2010). The importance of the geographic level of analysis in the assessment of the quality of life: the case of Spain. Social Indicators Research, 102, no. 2, pp. 209-228.
J.-E. GUSTAFSSON,G. BLAKE (1993). General and specific abilities as predictors of school achievement. Multivariate Behavioral Research, 28, pp. 407-434.
J.G. HIRSCHBERG, E.MAASOUMI, D.J. SLOTTJE (1991). Cluster analysis for measuring welfare and quality of life across countries. Journal of Econometrics, 50, no. (1-2), pp. 130-150.
G.R.JAHANSAHAHLOO,A.MEMARIANI,F.HOSSEINZADEH LOFTI,H.Z.REZAI (2005), A note on some of DEA models and finding efficiency and complete ranking using common set of weights. Applied Mathematics and Computation, 166, pp. 265-281.
A.JURADO,J.PEREZ-MAYO (2010), Construction and evolution of a multidimensional
well-being index for Spanish Regions. Social Indicators Research,107, pp. 259-279.
D.KAHNEMAN,A.KRUEGER (2006), Developments in the measurement of Subjective Well Being. Journal of Economic Perspective, 20, pp. 3-24.
C. KAO, H. T. HUNG (2005), Data envelopment analysis with common weights: the compromise solution approach. Journal of the Operational Research Society, 56, pp. 1196-1203.
S.KLASEN (2000), Measuring Poverty and Deprivation in South Africa. Review of Income and Wealth, 46, no. 1, pp. 33-58.
J.KRISHNAKUMAR,A. NADAR (2008). On exact statistical properties of multidimensional
indices based on principal components, factor analysis, MIMIC and structural equation model. Social Indicators Research, 83, no. 3, pp. 481-496.
H.KRUIJK,M.RUTTEN (2007). Weighting dimension of poverty based on people’s priorities: Constructing a Composite Poverty Index for the Maldives. IIDE Institute for international and development economics.
N.LAWLESS,R.LUCAS (2010). Predictors of Regional Well-Being: A County Level Analysis. Social Indicators Research, 101, pp. 341-357.
Q.LI,E.MAASOUMI,J,RACINE (2009). A nonparametric test for equality of distributions with mixed categorical. Journal of Econometrics, 148, no. 2, pp. 186-200.
E.MAASOUMI,G.NICKELSBURG(2008). Multidimensional measures of well-being and an analysis of inequality in the Michigan data. Journal of Business and Economic Statistics, 6, no. 3, pp. 327-334.
E. MAASOUMI, J. RACINE (2002). Entropy and Predictability of Stock Market Returns. Journal of Econometrics, 107, no. 2, pp. 291-312.
W. MELYN, W. W. MOESEN, (1991). Towards a Synthetic Indicator of Macroeconomic Performance: Unequal Weighting when Limited Information is Available. Leuven:
Catholic University of Leuven Centre for Economic Studies. Public Economic Research Paper n. CES17.
G.MUNDA,M. SAISANA (2011). Methodological Considerations on Regional Sustainability Assessment Based on Multicriteria and Sensitivity Analysis. Regional Studies, 45, no. 2, pp. 261-276.
P. MURIAS, F. MARTINEZ,C. DE MIGUEL (2006). An economic well-being index for the Spanish provincies: a Data Envelopment Analysis approach. Social Indicators Research, 77, pp. 395-417.
M.NARDO,M.SAISANA,A.SALTELLI,S.TARANTOLA,A. HOFFMAN,E.GIOVANNINI.
(2005). Handbook on Constructing Composite Indicators: Methodology and User Guide. Organisation For Economic Co.Operation and Development (OECD).
M.NOBLEN,D.MCLENNAN,K.WILKINSON,A. WHITWORTH,H. BARNES,C.DIBBEN
(2008). The English Indices of Deprivation 2007. Communities and Local Government, London.
B. NOLAN,C. T. WHELAN (1996). The relationship between income and deprivation: A dynamic perspective. Revue economique, 47, no. 3, pp. 709-717.
F. NOORBAKHSH (1998). The human development index: some technical issues and alternatives indices. Journal of International Development, 10, no. 5, pp. 589-605.
J.C. NUNNALLY (1970). Introduction to psychological measurement. McGraw-Hill, New York.
D.RINDSKOPF,T.ROSE (1988). Some Theory and Applications of Confirmatory Second-order Factor Analysis. Multivariate Behavioral Research, 23, pp. 51-67.
M.SAISANA,B.D’HOMBRES,A.SALTELLI (2011). Rickety Numbers: Volatility of University Rankings and Policy Implications. Research Policy, 40, pp. 165-177.
E. SCHOKKAERT, L. VAN OOTEGEM (1990). Sen’s concept of the living standard applied to the Belgian unemployed. Recherches Economiques de Louvain, 56, pp. 429-450.
M.J.SIRGY (2002). The psychology of quality of life. Dordrecht, The Netherlands: Kluwer.
M.J.SIRGY,T.CORNWELL (2002). How neighborhood features affect quality of life. Social Indicators Research, 59, no. 1, pp. 79–102.
M. J. SIRGY, T. CORNWELL (2001). Further validation of the Sirgy et al.’s measure of community quality of life. Social Indicators Research, 56(12), pp. 5–143.
M. J. SIRGY, R. N. WIDGERY, D. JIN LEE, G. B. YU (2010). Developing a Measure of
Community Well-Being Based on Perceptions of Impact in Various Life Domains. Social Indicators Research, 96, pp. 295-311.
M. J. SIRGY, T. GAO, R.F. YOUNG (2008). How residents’ satisfaction with community services influence quality of life (QOL) outcomes?. Applied Research in Quality of Life, 3, no. 2, pp. 81–106.
M.J.SIRGY,D.RAHTZ,M.CICIC,R.UNDERWOOD (2000). A method for assessing residents’
satisfaction with community-based services: A quality-of-life perspective. Social Indicators Research, 49, pp. 279–316.
T.N.SRINVASAN (1994). Commodities and capabilities. North-Holland, Amsterdam, and
Oxford.
B.M.S.VAN PRAAG (2011). Well-being inequality and reference groups: an agenda for new research. Journal of Economic Inequality, 9, pp. 111-127.
B.M.S.VAN PRAAG (2007). Perspectives from the Happiness Litearrture and the Role of New Instruments for Policy Analysis. CESifo Economic Studies, 53, pp. 42-68.
B. M. S. VAN PRAAG, P. FRITJERS, A. FERRER-I-CARBONELL (2003). The anatomy of
subjective well-being. Journal of Economic Behavior & Optimization, 51, pp. 29-49.
P. ZHOU, B. W. ANG, D. Q. ZHOU (2010). Weighting and Aggregation in Composite Indicator. Construction: a Multiplicative Optimization Approach. Social Indicators Research, 96, pp. 169–181.
P.ZHOU,E.B.W.ANG(2009). Comparing MCDA Aggregation Methods in Costructing Composite Indicators Using the Shannon-Spearman Measure. Social Indicator Research, 94, pp. 83-96
M.ZOHREHBADIAN,A.MAKUI,A.ALINEZHAD (2010). A compromise solution approach for
finding common weights in DEA: an improvement to Kao and Hung’s approach. Journal of the Operational Research Society, 61, pp. 604-610.
SUMMARY
Comparing weighting systems in the measurement of subjective well-being
There is a growing literature on the assessment of quality of life (QOL) and subjective well-being (SWB) through composite indicators (CI), obtained by aggregating subjective measures of people well-being. Besides the measurement of elementary indicators, the principal challenges in constructing SWB indicator are the aggregation and weighting system. To this respect, literature hasn’t actually reached a unique consensus. The paper investigates the effects that different weighting systems (equally, factorial and DEA weights) have on the rankings and score distributions of the SWB indicators. Data are provide by a sample survey on the quality of life conducted on the residents in the Romagna area during 2010. Results evidence that diverse weighting techniques produce different SWB score distributions while, to a some extent, rankings are maintained.