The clinical utility of three visual attention tests to distinguish
adults with ADHD from normal controls
L’utilità clinica di tre test di attenzione visiva per distinguere adulti con ADHD
dai controlli
MIRAY UNAL
1, EDMOND O’MAHONY
1, COLUM DUNNE
2, DAVID MEAGHER
2, DIMITRIOS ADAMIS
1,2* *E-mail: [email protected]1Sligo Mental Health Services, Clarion Rd, Sligo, Ireland
2University of Limerick Graduate Entry Medical School, Limerick, Ireland; Cognitive Impairment Research Group, Centre for Interventions in Infection, Inflammation & Immunity, Graduate Entry Medical School, University of Limerick, Limerick, Ireland
INTRODUCTION
Attention Deficit Hyperactivity Disorder (ADHD) is a neuropsychiatric disorder characterised by motor restless-ness and symptoms of inattention and impulsivity. ADHD first manifests itself during childhood and affects about 5% of the general population1,2. Of these, 60% continue to be
symptomatic into adulthood with symptoms of inattention being more prevalent than symptoms of hyperactivity or
im-pulsivity3,4. Although ADHD is a disorder diagnosed during
childhood, it has been reported that it can be missed or mis-diagnosed3,5. As a result, individuals with ADHD may
pres-ent for the first time to adult mpres-ental health services with var-ious symptomatology and as such, are often misdiagnosed6,7.
In both children and adults diagnosed with ADHD, cogni-tive deficits including impairments in attention and execucogni-tive function are present, with behavioural manifestations (hyper-activity) seen more often in childhood8-10. Various neuropsy-SUMMARY. Background. Adult patients with ADHD may go unrecognised and undiagnosed. This can result in psychosocial and function-al decline. Objectives. To investigate the clinical use of three objective computerised tests in the diagnosis of adult patients with ADHD. Methods. Case-control study. Inclusion criteria: aged 18-65, ADHD diagnosis; exclusion criteria: visual impairments, colour vision deficien-cies, acute mental illness, amnesia, and learning difficulties. ADHD was diagnosed with Conners’ Adult ADHD Diagnostic Interview (n=14) and were matched for gender and age against normal controls (n=30). Three computer-based tasks, Stroop test, Stroop Plus, and Perceptual Selectivity test were completed. Accuracy (%) and response time (ms) were measured. Generalized Estimating Equations method was used to analyse those repeated measurements data. The Area Under the Curve (AUC) was calculated for each test. Results. Mean age of cases was 47.29 (SD 9.03), 9 males. Mean age of controls was 41.57 (SD 11.42), 13 males. Individuals with ADHD had significantly worse perform-ances in both accuracy and response time in all the tests. The best discriminate ability was the Stroop test (accuracy and response time), fol-lowed by the Perceptual Selectivity test (response time). Comparisons of AUCs of the tests did not show any significant differences. Age had a significant effect on the Stroop and Stroop Plus tests but not in the Perceptual Selectivity test. Conclusions. Adults with ADHD have a longer response time and perform less accurately than controls. Thus, these data suggest that there is a use for objective visual attention tests in the diagnosis of adult ADHD.
KEY WORDS: attention deficit hyperactivity disorder, ADHD, Interference test, Stroop test, Perceptual Selectivity test, psychometrics. RIASSUNTO. Introduzione. Nei pazienti adulti l’ADHD può non essere riconosciuto e diagnosticato. Ciò può comportare un declino psi-cosociale e funzionale. Scopo. Studiare l’uso clinico di tre test computerizzati oggettivi nella diagnosi di pazienti adulti con ADHD. Meto-di. Studio caso-controllo. Criteri di inclusione: età 18-65 anni, diagnosi di ADHD; criteri di esclusione: disturbi della vista, deficit della visio-ne dei colori, malattia mentale acuta, amvisio-nesia e difficoltà di apprendimento. L’ADHD è stato diagnosticato con l’intervista diagnostica ADHD per adulti di Conners (n=14) ed è stato confrontato per sesso ed età rispetto ai controlli (n=30). Sono state completate tre attività basate su computer, test Stroop, Stroop Plus e test di selettività percettiva. Sono stati misurati la precisione (%) e il tempo di risposta (ms). Il metodo delle equazioni di stima generalizzate è stato utilizzato per analizzare i dati delle misurazioni ripetute. L’Area Under the Curve (AUC) è stata calcolata per ciascun test. Risultati. L’età media dei casi era di 47,29 (DS 9,03), 9 maschi. L’età media dei controlli era di 41,57 (SD 11,42), 13 maschi. Gli individui con ADHD hanno mostrato prestazioni significativamente peggiori in termini di accuratezza e tempo di risposta in tutti i test. L’abilità discriminante migliore era il test Stroop (precisione e tempo di risposta), seguito dal test di selettività percet-tiva (tempo di risposta). Il confronto delle AUC dei test non ha mostrato differenze significative. L’età ha avuto un effetto significativo sui test di Stroop e Stroop Plus ma non nel test di selettività percettiva. Conclusioni. Gli adulti con ADHD hanno un tempo di risposta più lun-go e funzionano in modo meno accurato rispetto ai controlli. Pertanto, questi dati suggeriscono che esiste un uso per test oggettivi di atten-zione visiva nella diagnosi di ADHD negli adulti.
chological tests have been proposed to distinguish ADHD from normal subjects and to study the neurocognitive deficits associated with it; the best known in cognitive science is the Stroop test. Stroop test is a test where participants have to re-port the font colour in which a word is printed and ignore the semantic meaning of the word11. Significant differences in
ex-ecutive functioning between normal subjects and those with ADHD have been reported by using the Stroop test in chil-dren. However, in adults this has not always been the case12,13
with meta-analytical studies showing contradictory results12,14.
The theoretical basis of the Stroop test in ADHD is the inter-ference theory and the selective attention theory; the former explores the conflict between past learnt behaviour with new material presented, whereas the latter explores an individual’s ability to extract relevant information when faced with multi-ple stimuli. In individuals with ADHD, interference deficits and impairments in cognitive control were found9,13which
re-sult in delayed responses. However, the explanation of de-layed responses seen in those patients with ADHD has been long debated and alternative explanations have been pro-posed such as underlying dysfunctions of motivational and en-ergetic states of individuals15,16, deficits in working memory
processes17or deficits in arousal adjustment18.
Nevertheless, irrespective of the underlying mechanism(s) the Stroop’s paradigm provides a platform for studying at-tention in individuals with ADHD. Thus, the aim of this study was to investigate three different tests, their clinical utility and diagnostic accuracy to distinguish adults with ADHD from normal subjects. More specifically, we investigated here the differences between individuals with ADHD and normal controls in terms of response time (overall), the accuracy in each test and the predictive validity of each test.
METHOD
Design and participants
This was a cross sectional study. Inclusion criteria included par-ticipants aged between 18 and 65 years of age with minimum of 5 years of education and literate in English. Exclusion criteria were vi-sual impairments, colour vision deficiencies (achromatopsia or dyschromatopsia), acute mental illness, amnesia, and learning diffi-culties. The participants consisted of 14 adults diagnosed with AD-HD (case group) by using the Conners’ Adult ADAD-HD Diagnostic In-terview for DSM-IV (CAADID) who were matched for age and gender with 30 healthy volunteers (control group). Comorbidity of the cases with ADHD was assessed with the Mini International Neu-ropsychiatric Interview 5.0 (MINI v.5). A brief interview was con-ducted with the control group to exclude current or past psychiatric history. The group of cases was recruited from the outpatient clinics. All the cases were newly diagnosed with ADHD and none of them were on medications for ADHD. The group of controls was recruit-ed from the staff working in the hospital and from mrecruit-edical students.
Participants completed three computer-based tasks built by us-ing OpenSesame Experiment builder software and Python 3.2 lan-guage. The tests included (1) Stroop test, (2) Stroop Effect test with visual aid (called thereafter Stroop Plus test), and (3) Perceptual Selectivity test. The investigation was performed in a sound-attenu-ated, dimly lit room with the participant positioned 50 cm from the display screen with their head resting on a chin stand. The pixel res-olution of the display screen was 1024x768 with a refresh rate of 100 Hz and the display monitor was positioned at eye level. Participants
were given three minutes for their eyes to adjust to the room light before the experiment began. For each test, an instruction screen was shown at the start and then participants completed a practice trial with 16 runs and 3 experiment trials each with 16 runs. Each run had a maximum time limit of 2000 milliseconds. The total run time was 10 minutes. If the participant answered incorrectly an er-ror sound was played and if they answered correctly no sound was played. Participants recorded their responses using keyboard keys. Accuracy (%) and response time in milliseconds (ms) was meas-ured in each trial.
Tests
Stroop Test (Stroop Colour-Word): Each run consisted of an initial
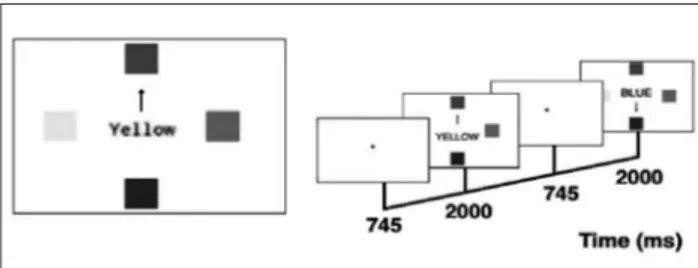
screen where a fixation dot measuring 0.5 cm x 0.5 cm was shown at the centre of the screen for 745 milliseconds. The second screen consisted of the stimulus: one colour word at a pixel resolution of 85 was shown at the centre of the screen. Any of the four colour words were shown randomly (red, green, blue, yellow). The font colour of the words were either congruent to the word itself or incongruent. The ratio of congruent to incongruent tasks was 1:3. Participants were asked to respond to the colour of the word and not the word itself as fast as they could (for example, the word “blue” written in red letters in Figure 1). This task demanded the selection of relevant information (e.g. attention to the colour of the ink) and ignoring the verbal content.
Stroop Plus Test: This test was designed similar to the Stroop test,
however, it also included an inhibitory stimulus in the form of an arrow pointing to a coloured box. The word stimulus was positioned at the centre of the screen with 4 coloured boxes (red, green, blue, yellow) measuring 3 cm x 3 cm positioned at perpendicular angles 5cm from the word stimulus. An arrow measuring 3 cm pointed randomly at any of the coloured boxes during each run and acted as an inhibitory stimulus (Figure 2). The congruent to incongruent ratio of the word stimulus was again 1:3 but when considering the congruency of all the stimuli (word, arrow and coloured box) it was 1:9. Participants were asked to respond to the font colour of the word and not the verbal content of the word as fast as they could by pressing the relevant key. While the Stroop test was used to measure selective attention, the arrow was used to measure intentional motor inhibition, also known as executive inhibition19. Executive function deficits are seen in individuals with ADHD and the term “executive inhibition” refers to the ability to suppress an instantaneous response due to a misleading stimulus in order to respond to a later task demand.
Figure 1. Stroop Test: Incongruent task-colour word “blue” in red font; Congruent task – colour word “green” in green font.
RESULTS
Descriptive statistics
The number of participants in the cases’ group was 14, the mean age was 47.29 (SD 9.03) and from them 9 were males and 5 females. The number of participants in the control group was 30 with a mean age of 41.57 (SD 11.42) and from them 13 were male and 17 were female. No differences were found between the groups regarding age (t-test, t=1.646, df: 42, p=0.107) and gender (x2=1.676, df: 1, p=0.195). Four participants in the case
group were diagnosed with one psychiatric comorbidity and a further six participants had 2 psychiatric comorbidities. These included depression (n=4), generalized anxiety disorder (n=4), paranoid schizophrenia (n=2), bipolar affective disorder (n=1), obsessive compulsive disorder (n=1), substance abuse (n=4).
Table 1 shows the accuracy and the response time in mil-liseconds (means and standard deviations) of each test at each trial for both groups (controls and those with ADHD).
Generalized Estimating Equations (GEE) models
For each test, a separate GEE model was conducted be-tween the independent variable (control/case status) and the dependent variables (accuracy and response time).
The results (parameter estimates and hypotheses test with their significance) of the GEE models are presented in Table 2. As it can be seen from Table 2, individuals with ADHD had significantly worse performances compared to controls in both accuracy and response time in each of the tests.
Using the same model as above (GEE), the effects of age and gender were examined in each of the three tests and in each of the two groups (controls/cases). Gender did not have a significant effect in either group in any of the tests. Therefore, it was dropped from the final models. The results of the effects of age are presented in Table 3. As it can be seen from the results, age had a statistically signifi-cant effect in accuracy (more advanced age, less accurate responses) and in the response time (younger age resulted in faster responses) in the Stroop and the Stoop Plus tests. In contrast, age did not have a significant effect on the Per-ceptual Selectivity test, either in the accuracy or in the re-sponse time. Thus, the accuracy and the rere-sponse time of the Perceptual Selectivity test are independent of the age of the participant and they are solely dependent on whether the participant has ADHD or not.
Finally, the tests were compared between themselves by using the Area Under the Curve (AUC) in a Receiver Op-Perceptual Selectivity Test: The Stroop test was presented at the
centre of the screen. Four shapes with a radius of 1.5 cm were shown 5 cm from the word stimulus and were positioned perpendicularly to it. Three of the shapes were similar and one was different from the rest. The shapes could be either circles or squares. The colour font of the shapes were either all blue or all yellow in 50% of runs. In the other 50%, 3 were yellow and 1 blue and vice versa. In each of the shapes a line of 2.5 cm length was presented and was positioned at either -45o , 0o , 45o or 90o (Figure 3) . In this test the participants were asked to respond to the orientation of the line in the odd shape by pressing the corresponding key and the hence colours were irrelevant. The orientation could be either horizontal or vertical. This test was used to measure a subtype of selective attention known as perceptual selectivity20,21. This term refers to how discriminable a stimulus is: in other words, how effectively the participant can distinguish the goal task when presented with a single stimulus (change in shape only) and when faced with two stimuli (change in shape and the presence of an irrelevant colour).
Statistical analysis
The IBM (SPSS) version 24 software was used for the analysis of the data. Descriptive statistics are presented as counts for cate-gorical variables (gender) and as means and standard deviations (SD) for continuous ones. Given that no intervention was conduct-ed during the study period, the time variable was not of any inter-est and therefore the Generalized Estimating Equations method (GEE) was used to analyse those repeated measurements data. The GEE takes into account the fact that observations within a subject are correlated, and estimates the population average across time. For GEE analysis an exchangeable working correlation matrix structure was assumed, with link function identity. In each GEE
analysis, dependent variables were the mean accuracy (expressed from 0 to 100) and the mean response time of each trial. The inde-pendent variable was the control or case status (Controls/ADHD). Similarly, GEE models were used to estimate the effects of age and gender on the performance of each test in each participant’s group (Controls or ADHD). The non-significant effects were dropped from the final models. In addition, the Area Under the Curve (AUC) was calculated for each test for all the trials and then those areas were compared pairwise between themselves to find out which is the better discriminatory test. For this analysis the Med-Calc v. 18.5 software was used with the method described by22. Figure 2. Stroop Plus Test: Stroop test superimposed with an arrow
to act as an inhibitory stimulus.
Figure 3. (A) The font colour of the shapes are uniform and the ori-entation of the line is vertical in the odd shape (square) (B) The font colour of one shape is different to the others and acts as an inhibito-ry response. The orientation of the line is vertical in the odd shape (square).
erating Characteristic (ROC) analysis. The area measures discrimination, in other words, the ability of the test to cor-rectly classify those with and without the disorder. The
comparison was done by using the DeLong et al.22method.
The areas under the curve and their significance for each test are shown in Table 4. Figure 4 shows the visual
repre-Table 1. Mean and Standard Deviations (SD) of each test in each trial of controls and cases groups.
a
Trials1 2 3
Mean SD Mean SD Mean SD
Controls Stroop test (accuracy) 89.58 16.77 92.08 12.05 96.04 6.86 Stroop test (response time) 1246.97 285.76 1166.27 239.06 1121.67 226.47
Stroop Plus test (accuracy) 82.08 24.16 91.04 17.58 95.00 9.20
Stroop Plus test (response time) 1129.87 384.80 1025.07 358.41 936.73 311.05 Perceptual Selectivity test (accuracy) 59.38 24.50 66.67 21.92 71.88 22.01 Perceptual Selectivity test (response time) 1280.83 297.11 1098.07 277.56 1086.33 279.12 Cases (ADHD) Stroop test (accuracy) 62.31 35.15 70.98 29.58 75.00 25.36
Stroop test (response time) 1588.14 303.55 1495.36 283.52 1456.21 312.31
Stroop Plus test (accuracy) 66.96 30.95 73.21 26.11 83.93 25.32
Stroop Plus test (response time) 1421.14 336.35 1305.14 425.25 1269.07 384.21 Perceptual Selectivity test (accuracy) 35.27 22.28 48.66 30.93 61.61 28.99 Perceptual Selectivity test (response time) 1589.86 299.28 1420.79 271.63 1312.93 289.98 Table 2. Parameter estimates of the effects of cases and controls in each of the tests.
Stroop test (accuracy)
95% Wald C. I Hypothesis Test
Parameter *B Std. Error Lower Upper Wald x2 df Sig.
Intercept 69.43 7.44 54.86 84.01 87.18 1 <.0001
Controls 23.14 7.64 8.18 38.10 9.19 1 .002
ADHD 0** . . . .
Stroop test (response time)
Intercept 1513.24 73.34 1369.50 1656.97 425.79 1 <.0001
Controls -334.94 85.06 -501.64 -168.23 15.51 1 <.0001
ADHD 0 . . . .
Stroop Plus test (accuracy)
Intercept 74.70 6.55 61.86 87.55 129.92 1 <.0001
Controls 14.67 7.11 .73 28.62 4.25 1 .039
ADHD 0 . . . .
Stroop Plus test (response time)
Intercept 1331.79 95.41 1144.78 1518.79 194.84 1 <.0001
Controls -301.23 113.73 -524.13 -78.33 7.02 1 .008
ADHD 0 . . . .
Perceptual Selectivity test (accuracy)
Intercept 48.51 6.29 36.18 60.84 59.48 1 <.0001
Controls 17.46 7.24 3.28 31.64 5.82 1 .016
ADHD 0 . . . .
Perceptual Selectivity test (response time)
Intercept 1441.19 69.10 1305.76 1576.63 434.99 1 <.0001
Controls -286.11 82.71 -448.22 -124.01 11.97 1 .001
ADHD 0 . . . .
* The sign (+ or -) in front of the estimates (B) shows the direction of the relationship with the dependent variable; e.g. the minus (-) in front of the B in the controls in the Stroop test (response time) indicates that the controls where faster (less time) compared to the cases. ** Set to zero because this parameter is redundant.
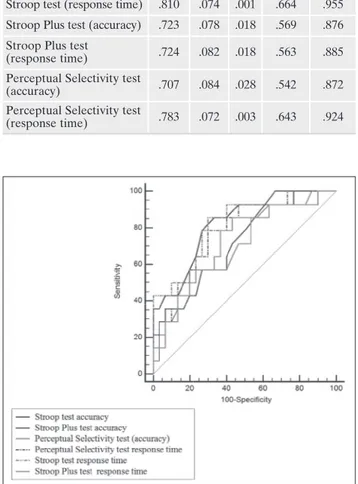
sentation of the areas for all of the tests. From Table 4, it can be deduced that the test with the best discriminatory ability is the Stroop test (accuracy and response time), followed by the Perceptual Selectivity test (response time). However pairwise comparison of all combinations of the tests did not show any significant differences between them (results not shown). Therefore, all the tests have a similar ability to cor-rectly classify between controls and ADHD cases.
DISCUSSION AND CONCLUSIONS
The results of this study show that the three tests are able to distinguish, with relatively good accuracy, normal controls
from the adults with ADHD. However, the most important finding from this study is that age has a significant effect on both accuracy and response time in the two versions of Stroop test (Stroop and Stroop Plus tests) while this age ef-fect is not found in the Perceptual selectivity test.
In a previous meta-analysis of the Stroop interference test in adults with ADHD23, the effect size of the Stroop test was
found to be medium (d=0.47) whereas meta-analyses in chil-dren with ADHD24 have reported a higher effect size
(d=from 0.57 to 0.75) with contradictory results (effect size, d=0.35)25. The main reason for these contradictions is the
cal-culation/scoring of the tests. To avoid this pitfall we have used a simple scoring method – accuracy and response time
Table 3. Parameter estimates of the effects of age in each of the tests in each group. Stroop test (accuracy)
95% Wald C. I Hypothesis Test Parameter *B Std. Error Lower Upper Wald x2 df Sig.
Controls Intercept 110.86 5.36 100.35 121.37 427.38 1 <.0001
Age -.44 .14 -.72 -.16 9.49 1 .002
ADHD Intercept 159.06 23.61 112.78 205.33 45.38 1 .000
Age -1.89 .60 -3.07 -.72 9.98 1 .002
Stroop test (response time)
Controls Intercept 666.21 127.32 416.68 915.75 27.38 1 <.0001
Age 12.32 2.902 6.63 18.00 18.02 1 <.0001
ADHD Intercept 425.21 255.54 -75.65 926.06 2.76 1 .096
Age 23.01 5.1777 12.86 33.16 19.75 1 <.0001
Stroop Plus test (accuracy)
Controls Intercept 114.98 8.518 98.28 131.67 182.17 1 <.0001
Age -.62 .234 -1.07 -.16 6.90 1 .009
ADHD Intercept 169.74 18.013 134.43 205.04 88.79 1 <.0001
Age -2.01 .436 -2.86 -1.15 21.29 1 <.0001
Stroop Plus test (response time)
Controls Intercept 246.31 175.96 -98.57 591.19 1.96 1 .162
Age 18.87 4.48 10.08 27.65 17.71 1 <.0001
ADHD Intercept -57.69 322.29 -689.38 574.01 .03 1 .858
Age 29.38 6.638 16.37 42.39 19.59 1 <.0001
Perceptual Selectivity test (accuracy)
Controls Intercept 78.63 13.70 51.77 105.49 32.92 1 <.0001
Age -.30 .31 -.91 .30 .97 1 .324
ADHD Intercept 43.05 40.36 -36.05 122.15 1.14 1 .286
Age .12 .79 -1.44 1.67 .021 1 .884
Perceptual Selectivity test (response time)
Controls Intercept 900.26 160.61 585.47 1215.05 31.42 1 <.0001
Age 6.13 3.96 -1.64 13.90 2.39 1 .122
ADHD Intercept 1288.22 539.62 230.58 2345.86 5.69 1 .017
Age 3.23 10.43 -17.21 23.68 .09 1 .756*
*The sign (+ or -) in front of the estimates (B) shows the direction of the relationship with the dependent variable; e.g. the minus (-) in front of the B in the age category of the Stroop test (accuracy) suggests that increasing age results in less accurate responses.
– and both were recorded precisely because we have com-puterized the tests. While the Stroop test has been extensive-ly used in research and consistentextensive-ly differentiated between groups of adults with ADHD and controls the other varia-tion that we used (Stroop Plus test), to the best of our knowl-edge, has not been previously used to compare our results with previous studies. Similarly the Perceptual Selectivity test has not been previously used in ADHD research. De-spite that, the results of the present study suggest that the three of these tests can distinguish adults with ADHD from normal controls, with the same degree of accuracy. The orig-inal Stroop test had the highest discriminatory ability but this was not significantly better from the rest. However, the three tests that we have used are based on the assumption that adults with ADHD have interference control deficits and this can explain the similar results in both accuracy and
re-sponse time in each of the tests. The only major difference among the tests was the effect of age which we will discuss below in more detail, given that the adult population has a larger age span compared to children.
Age in the Stoop test and in its variations has received little attention in the studies which have examined differ-ences in attentional performance between adult subjects with ADHD and normal controls26. Balint et al.26in their
meta-analysis found no effect of age in the differences in the attention performances between those two groups. However, the authors have examined together many (n=12) neurocognitive tests and not specifically the Stroop test or its variations. One study which examined the performance on Stroop test in normal adults showed a decline in the per-formance with age27. In addition it was reported28 that
Stroop test performance in individuals with ADHD im-proves with age (age span examined was from 10 to 29 years of age), but in our study which examined an older population, the performance was declined with age in both control and ADHD participants. The implication of those findings is in the new notion of the adult onset ADHD29. It
has been proposed that adults presenting with ADHD symptoms may not necessarily have a childhood-onset neu-rodevelopmental disorder but rather they may manifest their symptoms for first time in adulthood. Although this has not been confirmed yet30, in those cases it is preferable
to use the Perceptual selectivity test which is independent of age, rather than the Stroop test.
Regarding gender we did not find any effect on any of the test in both controls and cases. Although we did not expect any differences, a previous meta-analysis found a relationship be-tween the overall gender ratio and performance in the Stroop test, but this needs to be confirmed by other studies26. ADHD
is predominantly seen as a disorder more commonly affecting males than females, with a reported male to female ratio of 3:1 to 9:131. More recent studies narrow this gap32. The range of
male, female ratio in our sample is inside those limits. In addi-tion we did not find any effect of gender in the control group.
Limitations of the study
A major limitation of our study is the small sample size which did not allow us to evaluate the impact of comorbid disorders in the used tests. Until now only a small number of studies have investigated this effect, with contradictory find-ings. Taylor and Miller33reported that the number of
comor-bid diagnoses was positively related to the degree of atten-tional impairment in their ADHD group while, on the con-trary34,35reported that comorbidity did not necessarily
con-tribute to the pattern of cognitive deficits associated with ADHD. Comorbidity is often the case in adult ADHD but to examine the effects of each comorbid disorder or combina-tions of comorbid disorders in any neurocognitive test would require a huge number of participants which may make any such study impossible to conduct.
Although it would be interesting to know whether disor-ders that are comorbid with ADHD have any effect on at-tention, the present study examines the clinical utility of a common test and two variations of it in a pragmatic clinical sample with comorbidities. As such we can conclude that all
Figure 4. Comparison of ROC curves for each of the tests and for each dependent variable.
Table 4. Areas Under the Curve for each of the tests and for each dependent variable.
95% CI Test Result Variable(s) Area ErrorStd. Sig Lowerbound Upperbound Stroop test (accuracy) .814 .069 .001 .679 .949 Stroop test (response time) .810 .074 .001 .664 .955 Stroop Plus test (accuracy) .723 .078 .018 .569 .876 Stroop Plus test
(response time) .724 .082 .018 .563 .885 Perceptual Selectivity test
(accuracy) .707 .084 .028 .542 .872
Perceptual Selectivity test
three tests that we used had good discriminatory value in dis-tinguishing those with adult ADHD from normal subjects and we can suggest our preference for the Perceptual selec-tivity test, and especially the response time which is inde-pendent of the age of the subject. However, because this is perhaps the first study which uses the Perceptual selectivity test in ADHD, future research should be done with different samples to find out if our conclusions still hold.
Disclosure: the project has been supported with grants from the
Wellcome Trust.
REFERENCES
Preuss U, Ralston SJ, Baldursson G, et al. Study design, baseline 1.
patient characteristics and intervention in a cross-cultural framework: results from the ADORE study. Eur Child Adolesc Psychiatry 2006; 15 Suppl 1: I4-14.
Polanczyk G, de Lima MS, Horta BL, Biederman J, Rohde LA. 2.
The worldwide prevalence of ADHD: a systematic review and metaregression analysis. Am J Psychiatry 2007; 164: 942-8. Kooij SJ, Bejerot S, Blackwell A, et al. European consensus 3.
statement on diagnosis and treatment of adult ADHD: The Eu-ropean Network Adult ADHD. BMC Psychiatry 2010; 10: 67. Valdizan JR, Izaguerri-Gracia AC. [Attention deficit hyperac-4.
tivity disorder in adults]. Revista de Neurologia 2009; 48 Suppl 2: S95-9.
Ahlström BH, Wentz E. Difficulties in everyday life: young per-5.
sons with attention-deficit/hyperactivity disorder and autism spectrum disorders perspectives. A chat-log analysis. Int J Qual Stud Health Well-being 2014; 9: 23376.
Adamis D, Graffeo I, Kumar R, et al. Screening for attention 6.
deficit-hyperactivity disorder (ADHD) symptomatology in adult mental health clinics. Ir J Psychol Med 2018; 35: 193-201. Ginsberg Y, Quintero J, Anand E, Casillas M, Upadhyaya HP. 7.
Underdiagnosis of attention-deficit/hyperactivity disorder in adult patients: a review of the literature. Prim Care Companion CNS Disord 2014; 16 (3).
Faraone SV, Biederman J, Spencer T, et al. Attention-deficit/hy-8.
peractivity disorder in adults: an overview. Biol Psychiatry 2000; 48: 9-20.
Nigg JT. Neuropsychologic theory and findings in attention-9.
deficit/hyperactivity disorder: the state of the field and salient challenges for the coming decade. Biol Psychiatry 2005; 57: 1424-35.
Thapar A, Cooper M. Attention deficit hyperactivity disorder. 10.
Lancet 2016; 387: 1240-50.
Stroop JR. Studies of interference in serial verbal reactions. J 11.
Exp Psychol 1935; 18: 643.
Boonstra AM, Oosterlaan J, Sergeant JA, Buitelaar JK. Execu-12.
tive functioning in adult ADHD: a meta-analytic review. Psy-chol Med 2005; 35: 1097-108.
Soutschek A, Schwarzkopf W, Finke K, et al. Interference con-13.
trol in adult ADHD: no evidence for interference control deficits if response speed is controlled by delta plots. Acta Psy-chol 2013; 143: 71-8.
Lansbergen MM, Kenemans JL, van Engeland H. Stroop inter-14.
ference and attention-deficit/hyperactivity disorder: a review and meta-analysis. Neuropsychol 2007; 21: 251-62.
Sanders AF. Towards a model of stress and human performance. 15.
Acta Psychol 1983; 53: 61-97.
Sonuga-Barke EJ, Wiersema JR, van der Meere JJ, Roeyers H. 16.
Context-dependent dynamic processes in attention deficit/hy-peractivity disorder: differentiating common and unique effects of state regulation deficits and delay aversion. Neuropsychol Rev 2010; 20: 86-102.
Finke K, Schwarzkopf W, Muller U, et al. Disentangling the 17.
adult attention-deficit hyperactivity disorder endophenotype: parametric measurement of attention. J Abnorm Psychol 2011; 120: 890-901.
Sergeant JA. Modeling attention-deficit/hyperactivity disorder: 18.
a critical appraisal of the cognitive-energetic model. Biol Psy-chiatry 2005; 57: 1248-55.
Willcutt EG, Doyle AE, Nigg JT, Faraone SV, Pennington BF. 19.
Validity of the executive function theory of attention-deficit/hy-peractivity disorder: a meta-analytic review. Biol Psychiatry 2005; 57: 1336-46.
Theeuwes J. Perceptual selectivity for color and form. Percept 20.
Psychophys 1992; 51: 599-606.
Theeuwes J. Perceptual selectivity for color and form: on the na-21.
ture of the interference effect. Human Factors Research Inst Tno Soesterberg (Netherlands), 1994.
DeLong ER, DeLong DM, Clarke-Pearson DL. Comparing the ar-22.
eas under two or more correlated receiver operating characteristic curves: a nonparametric approach. Biometrics 1988; 44: 837-45. Hervey AS, Epstein JN, Curry JF. Neuropsychology of adults 23.
with attention-deficit/hyperactivity disorder: a meta-analytic re-view. Neuropsychology 2004; 18: 485-503.
Homack S, Riccio CA. A meta-analysis of the sensitivity and 24.
specificity of the Stroop Color and Word Test with children. Arch Clin Neuropsychol 2004; 19: 725-43.
van Mourik R, Oosterlaan J, Sergeant JA. The Stroop revisited: 25.
a meta-analysis of interference control in AD/HD. J Child Psy-chol Psychiatry 2005; 46: 150-65.
Balint S, Czobor P, Komlosi S, Meszaros A, Simon V, Bitter I. At-26.
tention deficit hyperactivity disorder (ADHD): gender- and age-related differences in neurocognition. Psychol Med 2009; 39: 1337-45.
de Frias CM, Dixon RA, Strauss E. Structure of four executive 27.
functioning tests in healthy older adults. Neuropsychol 2006; 20: 206-14.
Gualtieri CT, Johnson LG. Efficient allocation of attentional re-28.
sources in patients with ADHD: maturational changes from age 10 to 29. J Atten Disord 2006; 9: 534-42.
Moffitt TE, Houts R, Asherson P, et al. Is adult ADHD a child-29.
hood-onset neurodevelopmental disorder? Evidence from a four-decade longitudinal cohort study. Am J Psychiatry 2015; 172: 967-77.
Solanto MV. The Prevalence of “Late-Onset” ADHD in a clini-30.
cally referred adult sample. J Atten Disord 2019; 23: 1026-34. Gaub M, Carlson CL. Gender differences in ADHD: a meta-31.
analysis and critical review. J Am Acad Child Adolesc Psychia-try 1997; 36: 1036-45.
Rucklidge JJ. Gender differences in attention-deficit/hyperac-32.
tivity disorder. Psychiatr Clin North Am 2010; 33: 357-73. Taylor CJ, Miller DC. Neuropsychological assessment of atten-33.
tion in ADHD adults. J Atten Disord 1997; 2: 77-88.
Katz LJ, Wood DS, Goldstein G, Auchenbach RC, Geckle M. 34.
The utility of neuropsychological tests in evaluation of Atten-tion-Deficit/Hyperactivity Disorder (ADHD) versus depres-sion in adults. Assessment 1998; 5: 45-52.
Murphy KR, Barkley RA, Bush T. Executive functioning and ol-35.
factory identification in young adults with attention deficit-hy-peractivity disorder. Neuropsychology 2001; 15: 211-20.