03 July 2021
AperTO - Archivio Istituzionale Open Access dell'Università di Torino
Original Citation:
A 10,000 yr record of high-resolution Paleosecular Variation from a flowstone of Rio Martino Cave, Northwestern Alps, Italy
Published version:
DOI:10.1016/j.epsl.2017.12.047 Terms of use:
Open Access
(Article begins on next page)
Anyone can freely access the full text of works made available as "Open Access". Works made available under a Creative Commons license can be used according to the terms and conditions of said license. Use of all other works requires consent of the right holder (author or publisher) if not exempted from copyright protection by the applicable law. Availability:
This is the author's manuscript
A 10,000 yr record of high‐resolution Paleosecular Variation from a flowstone of
1Rio Martino Cave, Northwestern Alps, Italy
2 3Elena Zanella1, Evdokia Tema1, Luca Lanci2, Eleonora Regattieri3,4, Ilaria Isola5, John C. Hellstrom6,
4
Emanuele Costa1, Giovanni Zanchetta5,7, Russell N. Drysdale8,9, Federico Magrì10
5 1 Dipartimento di Scienze della Terra, Via Valperga Caluso 35, 10125 Torino, Italy 6 2Dipartimento di Scienze Pure e Applicate, Piazza della Repubblica 13, 61029 Urbino, Italy 7 3 Institute of Geology and Mineralogy, University of Cologne, Zülpicher Str. 49a, 50674 Cologne, Germany 8 4Istituto di Geoscienze e Georisorse IGG‐CNR, via Moruzzi 1, 56100 Pisa, Italy 9 5Istituto Nazionale di Geofisica e Vulcanologia INGV, Via della Faggiola 32, 56126 Pisa, Italy 10 6 School of Earth Sciences, University of Melbourne, Victoria 3010 Australia 11 7Dipartimento di Scienze della Terra, Via S. Maria 53 56126 Pisa, Italy 12 8 School of Geography, University of Melbourne, Victoria 3010, Australia 13 9 EDYTEM, UMR CNRS 5204, Université de Savoie‐Mont Blanc, 73376 Le Bourget du Lac cedex, France 14 10Gruppo Speleologico Valli Pinerolesi GSVP, Club Alpino Italiano, Pinerolo, Italy 15 16 Abstract 17 Speleothems are potentially excellent archives of the Earth’s magnetic field, capable of recording 18 its past variations. Their characteristics, such as the continuity of the record, the possibility to be 19 easily dated, the almost instantaneous remanence acquisition and the high time ‐resolution make 20
them potentially unique high‐quality Paleosecular Variation (PSV) recorders. Nevertheless,
21
speleothems are commonly characterized by low magnetic intensities, which often limits their
22
resolution. Here we present a paleomagnetic study performed on two cores from a flowstone
23
from the Rio Martino Cave (Western Alps, Italy). U/Th dating indicates that the flowstone's
deposition covers almost the entire Holocene, spanning the period ca. 0.5‐9.0 ka, while an 25 estimation of its mean growth rate is around 1 mm per 15 years. The flowstone is composed of 26 columnar calcite, characterized by a highly magnetic detrital content from meta‐ophiolites in the 27
cave’s catchment. This favourable geological context results in an intense magnetic signal that
28
permits the preparation and measurement of thin(3 mm depth equivalent) samples, each
29
representing around 45 yr. The Characteristic Remanent Magnetization (ChRM), isolated after
30
systematic stepwise Alternating Field demagnetization, is well defined, with Maximum Angular
31
Deviation (MAD) generally lower than 10°. Paleomagnetic directional data allow the
32
reconstruction of the PSV path during the Holocene for the area. Comparison of the new data with
33
archeomagnetic data from Italian archeological and volcanic records and using the predictions of
34
the SHA.DIF.14k and pfm9k.1a global geomagnetic field models shows that the Rio Martino
35
flowstone represents an excellent recorder of the Earth’s magnetic field during the last 9,000
36
years. Our high resolution paleomagnetic record, anchored by a high‐quality chronology, provide
37
promising data both for the detection of short term geomagnetic field variations and for
38 complementing existing regional PSV curves for the prehistoric period, for which well‐dated data 39 are still scarce. 40 41 Keywords: Paleosecular variation, Rock magnetism, Speleothem, Italy 42 43 1. Introduction 44 To investigate geomagnetic field behavior in the past and to explore its short‐term features, high‐ 45 resolution records from globally distributed archives of different origin are necessary (Mandea and 46
Olson, 2009). For Paleosecular Variation (PSV) reconstructions, an ideal paleomagnetic record
should satisfy several requirements, such as having a stable remanent magnetization, being well 48 dated, offering a continuous record and presenting high‐time resolution. Even though some Earth 49 materials may satisfy a number of these, the characteristics of continuity and high‐resolution are 50 rarely coupled. Marine and lacustrine sediment sequences are best at ensuring continuous records 51 and have therefore been intensively studied to obtain geomagnetic data over long time scales (e.g. 52
Turner and Thompson, 1981; Rolph et al., 2004; Vigliotti, 2006). However, sometimes data
53
reliability may be questionable: the remanence acquisition mechanisms, the smoothing effects of
54
bioturbation, the inclination error and the remanence acquisition delay are just some of the
55
problems that may affect this kind of record. On the other hand, volcanic rocks and fired
56
archeological artifacts may preserve very reliable paleomagnetic data but they are highly
57
discontinuous in time. The age uncertainties of the volcanic products, as well as the lack of
58
continuity and the limited time extension of available in situ archeological baked clay structures,
59
restrict their use for high‐resolution record studies.
60
Several research groups have studied speleothems for both PSV and paleoenvironmental
61
reconstructions (e.g. Latham et al., 1989; Lean et al., 1995; Openshaw et al., 1997; Osete et al.,
62
2012; Xie et al., 2013; Font et al., 2014; Jaqueto et al., 2016; Lascu et al., 2016), revealing their
63
high potential for magnetic and secular variation reconstructions (Lascu and Feinberg, 2011).
64
Paleomagnetic time series from speleothems, although still sparse, can provide excellent temporal
65
resolution if the speleothem has grown continuously and over a considerable age range, as, for
66
example, in the case of the Mexican stalagmite studied in the pioneering work of Latham et al.
67
(1986). The key features of speleothems are that they can grow continuously for 103‐105 yr and
68
can be accurately dated by the uranium‐series method (e.g. Richards and Dorale, 2003). They
69
normally show little or no secondary alteration, and are generally easy to orient and sample
70
(though with obvious consideration of natural heritage values).
Based on magnetic properties, the remanent magnetization of speleothems can be divided into
72
two main genetic forms, detrital (DRM) or chemical (CRM) (Lascu and Feinberg, 2011). Detrital
73
input can originate from flood or drip water sources (Openshaw et al., 1997; Fairchild et al., 2006).
74
Moreover, speleothems present the advantage of acquiring their magnetization rapidly after
75
formation, meaning that the registered magnetic remanence variations reliably reflect the PSV
76
path in the past. Nevertheless, these promising features are confounded by a speleothem’s
77 generally low concentration of magnetic minerals, and thus their low magnetic signal, which limits 78 their use in magnetic studies. To bypass this problem, large samples have been commonly used in 79 paleomagnetic studies, but this reduces the time‐resolution of the sample. Generally, a sample of 80
around 2 cm may average ca 100‐4000 yr (Strauss et al., 2013) and thus the obtained SV time‐
81
resolution is very low.
82
This paper reports the results of a paleomagnetic study performed on a flowstone sampled at Rio
83
Martino Cave (North Western Alps, Italy). The favourable geologic context of the cave, which is
84
mainly surrounded by meta‐ophiolites, makes this flowstone very rich in detrital ferromagnetic
85
components, and thus an ideal geomagnetic field recorder due to its high magnetic remanence
86
properties. Although a high content of detrital material can compromise U/Th dating (Hellstrom,
87
2006), we have been able to produce a continuous, radiometrically‐dated, directional SV record
88 for the area during the last ~10 kyr, at a sampling resolution averaging 45 yr. Comparison of the 89 new data with archeomagnetic data from Italian artifacts and volcanic rocks and using predictions 90 of global geomagnetic field models, shows that the Rio Martino flowstone represents an excellent 91 recorder of the Earth’s magnetic field in the past and demonstrates the potential of speleothems 92 for PSV studies and for the investigation of short‐term variations of the geomagnetic field. 93 94 2. Geological setting and sampling 95
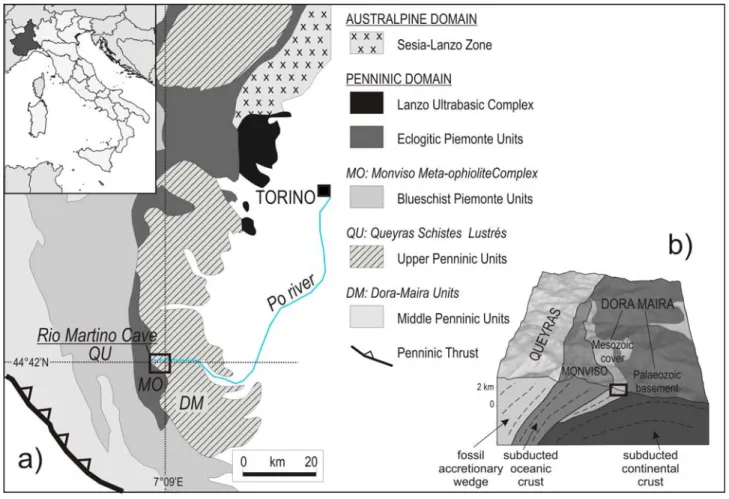
Rio Martino Cave (44o42’ N, 7o09’ E) is located in the inner sector of the Western Alps (Northern 96 Italy), which consists of a range of continental and oceanic tectono‐metamorphic units bounded 97 by major orogen‐scale faulting (Balestro et al., 2014), and exhumed and stacked in the axial sector 98 (Fig. 1). The cave is developed within the Mesozoic carbonate cover of the Palaeozoic Dora Maira 99
(Balestro et al., 2013). This unit is overlain by the Monviso meta‐ophiolite complex, a major
100
eclogized remnant of the Ligurian‐Piedmont oceanic lithosphere, which in turn is tectonically
101 overlain by the Queyras Schistes Lustrés, interpreted as a fossil accretionary wedge. 102 The surface above the cave is overlain mainly by glacial deposits. The cave is located at 1530 m 103 a.s.l. on the right flank of the upper Po valley. It is a spring cave, ca. 3000 m long, with 200 m of 104 elevation difference, and is crossed by a small river with an average discharge of 50 l/s (maximum 105 200 l/s) (Badino and Chiri, 2005). 106 The presence of highly magnetized rocks in the cave's catchment (Fig. 1) and the strong magnetic 107 anomalies observed in the Monviso Massif area (Lanza and Meloni, 2006) could induce a magnetic 108 deflection effect in the area. To evaluate the possible effect exerted by the meta‐ophiolitic masses 109
and to confirm that it does not exert a significant influence on the paleomagnetic sampling, we
110 used a triaxial fluxgate magnetometer to measure the geomagnetic field components outside and 111 next to the entrance, as well as inside the cave. The computed magnetic inclination values of 60.7° 112 outside the cave and 60.5° on the flowstone surface are fully comparable to the 2013 IGRF model 113 of 60.6° (http://www.ngdc.noaa.gov/geomag‐web). Besides, outside the cave we performed some 114 orientation checks by using both the magnetic and the solar compass. The difference between the 115 two declinations was small, ranging from ‐5° to +2°. Such differences are insignificant and indicate 116 that any local magnetic effects on the paleomagnetic sampling can be considered negligible. 117
Two sampling campaigns were carried out to collect two cores from the same flowstone, which
118
has accumulated on the side of a seasonally active stream with a high‐detrital content. The cores
were taken 20‐30 cm apart and drilled using an adapted electric‐powered drill. The first core
120
(RMD1), sampled during a campaign in 2010, was not azimuthally oriented. The second core
121
(RMD8), sampled in 2013, was oriented in situ by magnetic compass and inclinometer (figure S1 in
122
the supplemental material). Each core was ca. 60 cm long and was drilled perpendicular to the
123
flowstone growth axis.
124
A quarter of each core was dedicated to paleomagnetic analysis. The investigated sub‐samples
125
consisted of small slices, about 3 mm thick (varying from 2.5 to 4 mm), cut almost perpendicular to
126
the speleothem's growth direction. Slicing was performed using a very thin non‐magnetic saw,
127
which ensured that only 1 mm of material was consumed during the cut. Following this systematic
128
sampling, we obtained 146 slices from RMD1 and 143 from RMD8. Each slice was positioned in the
129
centre of a non‐magnetic plastic cylinder (2.5 cm diameter, 2.3 cm height) that allowed its
130 handling as per standard paleomagnetic samples (Fig. 2). 131 132 3. Methods 133 3.1. U/Th dating and age modelling 134 Nineteen solid prisms of ~40 mg (~2 mm wide along the lamina and 1 mm thick on growth axis) 135
from RMD1 were used for age determination (Table S1 in Supplementary Material). The U/Th
136
dating was performed at the University of Melbourne (Victoria, Australia) following the method of
137
Hellstrom (2003). Briefly, samples were dissolved and a mixed 236U‐233U‐229Th spike was added
138
prior to removal of the carbonate matrix with ion‐exchange resin. The purified U and Th fraction
139
was introduced in a dilute nitric acid to a multi‐collector inductively coupled plasma mass
140
spectrometer (MC‐ICPMS, Nu‐Instruments Plasma). The 230Th/238U and 234U/238U activity ratios
141
were calculated from the measured atomic ratios using an internally standardised parallel ion‐
counter procedure and calibrated against the HU‐1 secular equilibrium standard. Correction for 143 detrital Th content was applied using initial activity ratios of detrital thorium (230Th/232Th)i of 1.3 ± 144 0.45. This value, and its relative 2σ uncertainty, was calculated using a Monte Carlo ‘stratigraphic 145 constraint’ procedure based on the series of U/Th ages (Hellstrom, 2006). A depth‐age model was 146 constructed using a Bayesian Monte Carlo approach following the method described by Drysdale 147 et al. (2005) and Scholz et al. (2012). 148 3.2. SEM‐EDS analysis 149 The mineralogy of the detrital inclusions in the studied flowstone was investigated by dissolving 150 different portions of various thin slabs of the RMD1 core in diluted hydrochloric acid and passing 151 the digests through 0.45 micrometre cellulose acetate filters. The residues, bearing almost all of 152
the non‐carbonate mineral inclusion types contained in the speleothem, were observed and
153
analysed with a Cambridge Stereoscan 360 Scanning Electron Microscope housed at the Earth
154 Science Department of the University of Torino, Italy. Analyses were performed using an Oxford 155 Inca X‐Act 200 EDS microanalysis equipped with a Link Pentafet detector (thin window), allowing 156 qualitative/quantitative determination of light elements (down to boron). All data were obtained 157 at 15 kV HT, 25 mm WD, probe current range 800 pA – 1.2 nA and analysis time from 60 to 500 s. 158 Primary standardization was performed on SPI Supplies and Polaron Equipment standards, and the 159
system was regularly calibrated against a high‐purity metallic Co standard before each
160
experimental session. Data were processed with the Inca 200 Microanalysis Suite Software,
161
version 4.08, and calibrated on natural mineral standards using the ZAF correction method.
162
Analytical data are considered to be only semi quantitative due to the nature of the samples
163
(rough surface of the particles, lack of horizontality, lack of surface polishing). A total of about
164
1500 analyses was performed on seven samples coming from different portions of the core,
corresponding to about 200 measurements for each filter, randomly scattered on the filter surface 166 for better representativeness. 167 Despite the results of magnetic analysis, very few magnetite particles were found in the filtered 168 material, most likely because the single‐domain magnetic particles were not retained by the 0.45 169 µm filter. Magnetite was indeed observed in sandy materials from Rio Martino, being found in the 170
bed sediments of the relatively high‐energy environment of the cave stream, rather than as
171 detritus in carbonate flowstone speleothems. 172 173 3.3. Rock magnetic measurements 174 175
All magnetic measurements were performed at the ALP Paleomagnetic Laboratory (Peveragno,
176
Italy). Rock magnetic experiments were performed on representative samples from both cores.
177
Rock magnetism was investigated by low‐field susceptibility (km) and natural remanent
178
magnetization (Jr) measurements using a KLY3 kappabridge and a JR6 spinner magnetometer with
179
a sensitivity of the order of 10‐8 SI and 10‐6 A/m, respectively. Susceptibility was measured at least
180
five times per sample in order to calculate a mean value. Standard deviation is low and normally
181
less than 5% for specimens associated with a susceptibility spike; uncertainty grows to 20‐35% for
182
the remaining specimens, characterized by negative (diamagnetic) susceptibility values. All
183
samples were weighed to get the mass‐normalized susceptibility (m3kg‐1) and intensity (J,
184
Am2/Kg). Their values are represented as a function of the core depth in figure S2 of the
185
supplemental material.
186
Isothermal Remanent Magnetization (IRM) curves were obtained with an ASC pulse magnetizer,
187
applying stepwise increasing fields up to 1 T. Thermal demagnetization of a three‐axis composite
188
IRM was also performed on representative samples (Lowrie, 1990). An IRM was imparted with an
ASC pulse magnetizer along the sample's three orthogonal axes, applying first a maximum 1.5 T, 190 then a medium 0.3 T and finally a minimum 0.1 T magnetic field. Crossover plots of IRM curves and 191 alternating field (AF) demagnetization of the saturation IRM (SIRM) were carried out to investigate 192 the magnetic grain size (Symons and Cioppa, 2000). 193
Finally, hysteresis cycles were obtained by a Vibrating Sample Magnetometer (VSM, LakeShore
194
7410 ‐ Maximum applied field Bmax = ± 1 T; H = ± 10.000 Oe / 976.000 A/m) at the Istituto
195
Nazionale di Ricerca Metrologica (INRIM, Torino) and interpreted by RockMag Analyzer 1.0
196
software (Leonhardt, 2006). All specimens were AF demagnetized stepwise up to 100 mT with a
197
ASC‐D 2000 equipment. Representative twin specimens were also stepwise thermally
198 demagnetized with a Schonstedt TSD‐1 furnace. 199 200 4. Results 201 4.1. Chronology 202
All the U/Th ages obtained from RMD1 were in stratigraphic order within the associated
203
uncertainties, except for two samples that were consequently rejected as outliers (Table S1 in
204
Supplementary Material). Macroscopic and thin‐section analyses of core RMD1 shows no growth
205
interruption along its length. Age modelling performed on RMD1 indicates that the flowstone
206 grew continuously between 0.56 ± 0.06 ka and 9.7 ± 1.6 ka b2k (Fig. 3). The mean growth rate is 207 0.058 mm/yr, which implies a mean time‐resolution of ca. 60 yr (3 mm specimen + 1 mm cut) for 208 the PSV record. The time averaged in each 3 mm slice sample is ca. 45 yr. The age of RMD8 was 209
inferred by comparing clearly visible growth layers (Fig. 2a) between the two cores, associated
210
with spikes in both the magnetic mass susceptibility and mass magnetization (figure S2 of the
211
supplemental material).
4.2. EDS 213 The mineralogy of the detrital portion in the RMD1 core is in strong accord with the composition 214 of the surrounding lithology. Apart of the calcareous formation in which the cave has developed, 215 the main rocks in the area are prasinites, amphibolites and serpentines. Minerals were grouped by 216
similar chemistry, with some simplifications: as stated above, analyses were only semi‐
217
quantitative. The main identified groups are: iron oxides (without magnetite, discriminated by
218
morphological features), magnesium silicates (other than serpentine), serpentine group, white
219
mica group, feldspar, tremolite‐actinolite amphiboles, other amphiboles (mainly hornblende),
220
epidote group, chlorite group, quartz and accessories. The main minerals (Fig. 4) are represented
221
by iron oxides (not distinguishable by chemistry for the reason explained above), magnesium
222
silicates and serpentine group minerals. Iron oxides are mostly irregular in shape as if they had
223 undergone reworking from the stream or by feedwater (Perkins, 1996). In few cases, a framboidal 224 shape suggests in situ growth. 225 226 4.3. Magnetic mineralogy 227
The mass magnetic susceptibility of the specimens strongly varies. It mostly shows a prevailing
228 diamagnetic phase with small negative values (from ‐7 to 0 x 10‐9 m3 kg‐1 with a mean value of ‐4 x 229 10‐9 m3 kg‐1), alternating with high positive spikes, up to 970 x 10‐9 m3 kg‐1, suggesting a very low 230 concentration of magnetic minerals in these specimens. Calcite bulk susceptibility is ‐12.09 SI; its 231 mass susceptibility is about ‐4.46 x 10‐9 m3 kg‐1 (Almqvist et al., 2010). Since the literature value for 232 the susceptibility of calcite refers to single crystal, we can assume that the mass susceptibility for 233
calcite in the speleothem is slightly higher, because of mineral porosity. Assuming a constant
234
diamagnetic contribution mostly due to calcite, the relative variability of magnetic susceptibility is
indicative of variations of the concentration of magnetic minerals: a mean value of ‐4 x 10‐9 m3
236
kg‐1 can be assumed to be representative of the “standard” content in magnetite, while high
237
values represent for pulses of higher detrital input.
238
The natural magnetization intensity (Jr) strongly varies from specimen to specimen, being on
239
average around 1‐10 x 10‐6 Am2 kg‐1 with spikes up to 80 x 10‐6 Am2kg‐1. The variations of these
240
two bulk parameters are correlated; the computed correlation coefficients are r = 0.87 and r =
241
0.76 for RMD1 and RMD8, respectively. This corroborates the hypothesis that their values are
242 essentially controlled by changes in concentration of the magnetic oxide. 243 IRM acquisition curves from representative samples saturate at relatively low field (around 0.3 T), 244 indicating the presence of low coercivity minerals (Fig. 5a). The IRM acquisition data were further 245 analyzed applying the MAX UnMix software (Maxbauer et al., 2016) to six flowstone slices and to 246
sand collected from the bed of the cave spring. For three specimens, i.e. RM101 and RM134
247
flowstones and the sand, only one magnetic component was identified with Bh and DP values fully
248
consistent with detrital magnetite (Bh = 1.46, DP = 0.40). In the remaining cases, two components
249
were detected, one as above, and the other pointing to higher‐coercivity magnetite. The
250
computed S‐ratio (S‐0.3 mT) ranges from 0.95 to 1.00.
251
During the thermal demagnetization of the orthogonal IRM components (Lowrie, 1990), two
252
typical behaviors were observed, which are independent of the magnetization intensity of the
253
specimens. The first (e.g. sample RM68a), representing about the 80% of the measured
254
specimens, suggests that the primary remanence is dominated by a soft magnetic carrier,
255
demagnetized at ca 350‐450 °C, which is interpreted as a titanomagnetite (Fig. 5b). The second
256
(e.g. sample RM44a), in the remaining 20%, is characterized by a first drop in the magnetization
257
intensity between 200 and 300 °C, which may be speculatively related to the existence of
258
maghemite (Pan et al., 2000), even though this evidence is not sufficient to unambiguously
identify this magnetic phase (Zhu et al., 2012).The presence of (titano)magnetite of detrital origin
260
is easily justified considering the geologic context of the cave and it is probably originated from
261
the highly magnetic rocks of the surrounding area, mostly meta‐ophiolites (Balestro et al., 2013).
262
The occurrence of small serpentinite lithics was also detected. In those cases, the Median
263
Destructive Field (MDF), which is normally stable and around 50‐60 mT, drops to 5‐25 mT.
264
Deflections from MDF = 50 mT occur only where both the magnetic susceptibility and the
265
magnetization intensity values are high. To check for these variations, we performed the
266
experiment of Symons and Cioppa (2000) on some selected specimens, which were characterized
267
by MDF ranging from 15 to 60 mT. It consists of a crossover plot, where the %SIRM is plotted as a
268
function of the applied field, and using a logarithmic scale (Fig. 5c). The results suggest that,
269
except specimen SP212, which is characterized by MD (titano)magnetite, samples mainly contain
270
SD to PSD (titano)magnetite grains.
271
The modified Lowrie‐Fuller method (Johnson et al., 1975), which represents a valid first‐order
272
indicator of grain‐size composition (Font et al., 2014), was applied to some specimens with MDF in
273
the range 45‐50 mT. Results always show L‐type behaviors with the Anhysteretic Remanent
274
Magnetization (ARM) dominating the Isothermal Remanent Magnetization (IRM) during AF
275 demagnetization treatment, corroborating the occurrence of SD grains. 276 These results are confirmed by the hysteresis cycles (Figure S3 in the supplemental material) 277 performed on 2 specimens, one characterized by high , one by low . After correction for the 278 diamagnetic effect, the curves show the occurrence of a low‐coercivity phase with saturation at 279
0.3‐0.5 T; in both cases, the ratios Mrs/Ms and Bcr/Bc fall next to the PSD field and SD + MD mixing
280 curve in the Day plot (Dunlop, 2002). 281 5. Paleomagnetic directions 282 5.1. Natural Remanent Magnetization and the Anisotropy of Remanent Magnetization 283
Speleothems can potentially offer very useful records of PSV and the remanence acquisition
284
mechanisms in speleothems have been previously studied in detail (e.g., Lascu and Feinberg, 2011;
285
Strauss et al., 2013, and reference therein). In order to provide a reliable PSV record, the
286
magnetization should be acquired and locked soon after the calcium carbonate film is deposited
287
on a speleothem (almost instantaneously). Following Strauss et al. (2013), lock‐time for a
288
speleothem is sub‐annual and the magnetization is a DRM. Synchronicity between crystallization
289
and magnetization has been tested experimentally by synthetic stalagmite growth (Morinaga et
290
al., 1989), confirming the short time‐lapse in acquiring magnetization parallel to the ambient field
291
direction.
292
To test if this requirement is encountered in Rio Martino flowstone and thus to check for its
293
reliability as a PSV recorder, we measured both the Anisotropy of Magnetic Susceptibility (AMS)
294
and the Anisotropy of Isothermal Remanent Magnetization (AIRM) on two selected sets of
295 samples from RMD1 (azimuthally non‐oriented core), each comprising a time interval of ca 1000 296 yr. The first set comprised 16 samples (SP200 to SP260) from 4.26 ± 0.23 to 3.30 ± 0.03 ka, and the 297 second set 14 samples (SP346 to SP397) from 7.76 ± 0.12 to 6.91 ± 0.11 ka. A difference of 20° in 298
the mean magnetic ChRM inclination distinguished these two sets of specimens. The AMS was
299
measured by a KLY‐3 kappabridge. The results obtained on both sets of samples show a well‐
300
defined (confidence angles < 15°) mean minimum susceptibility axis, k3, which is statistically
301 vertical and perpendicular to the flowstone growth laminae (Fig. 6a). For the AIRM measurements, 302 each specimen was first AF demagnetized using a tumbling 2G demagnetizer at 60 mT peak field 303 and then given an isothermal remanent magnetization (IRM) with a steady field of 20 mT using an 304 AGICO PUM‐1 pulse magnet. After measurement with the spinner magnetometer, the sequence 305 was repeated for a total of 12 different orientations of the IRM in order to calculate the anisotropy 306 tensor. The experiment (Fig. 6b‐c) shows that for both sets, the maximum IRM anisotropy axis I1 is 307
concordant or statistically indistinguishable from the mean ChRM direction, showing no relation
308
with the speleothem growth laminae. This shows that ChRM direction is due to the statistical
309
alignment of the magnetic particle and fully agrees with the conclusions of Zhu et al. (2012), who
310
performed both AMS and AIRM on stalagmites. They found that the AMS was dominated by the
311
calcite fabric, being the minimum susceptibility axis k3 aligned perpendicular to the stalagmite
312
growth laminae, while the AIRM fabric showed the maximum remanence axis I1 almost parallel to
313
the NRM direction. These data all point to a detrital origin of the magnetization, with the
314 geomagnetic field control in the orientation of the ferromagnetic minerals. 315 316 5.2. Characteristic Remanent Magnetization determination 317
Demagnetization results are represented by intensity‐decay curves and plotted in Zijderveld
318
diagrams (Fig. 7). Most of the specimens are characterized by a small viscous remanent
319
magnetization (VRM), which is easily removed at an AF field of 15‐20 mT. The remaining
320
demagnetization path is linear and points to the origin, indicating a stable remanent
321
magnetization; this component has been interpreted as the Characteristic Remanent
322
Magnetization (ChRM). The ChRM direction is mostly well defined and characterized by low MAD
323
values (lower than 8o for the 91% of the studied samples). AF and thermal demagnetization results
324
obtained from twin specimens are very similar (Fig. 7), confirming the reliability of the ChRM
325 direction (Fig. 8; Table S2 in Supplementary Material). In the thermal demagnetization (Fig. 7b and 326 7d), an inflection in the intensity decay curve it is observable at ca. 150 °C. As suggested by Strauss 327 et al. (2013) the decay could be correlated with the occurrence of goethite, not detected however 328 by any other experiment. The AF demagnetization treatment has been preferred rather than the 329
thermal demagnetization, as it permits the further use of the same samples for
330
paleoenvironmental and relative paleointensity investigations through Anhysteretic Remanent
Magnetization (ARM) measurements. Therefore, all samples were systematically AF demagnetized
332
and ChRM directions were obtained from the AF demagnetization results. Demagnetization
333 behavior in samples with low‐ and high‐remanence (spike) does not change significantly except for 334 specimens where serpentinite clasts were recognized. 335 336 6. Directional Paleosecular Variation during Holocene 337
Paleomagnetic directions obtained from the two cores (reported in Table S2 of Supplementary
338
material) are plotted versus depth from the top of the core in Figure 9. Some spikes in declination
339
show a strong correspondence with atypical MDF values, lower/higher than 20/60 mT. These
340
deflected directions have been ascribed to the presence of small serpentinite lithic fragments and
341
were thus rejected. The declination of RMD1, which was not azimuthally oriented, has been
342
recovered after adjustment of its mean value to the Geocentrical Axial Dipole (GAD) calculated at
343
Rio Martino according to the following procedure: first, the mean direction of RMD1 has been
344 calculated for the last 10 kyr and then its deviation from the GAD value has been computed. The 345 difference in declination between the core and the GAD has been extracted from each declination 346 value of the RMD1 core. 347 Generally, directions obtained from both RMD1 and RMD8 are in good agreement with each other 348
and data reproducibility is high (Fig. 9). This is particularly evident for the inclination data at
349
depths between 200.0 and 600.0 mm, where the two records match each other. Instead, in some
350
cases, mostly at depths from 150.0 to 200.0 mm, differences in inclination of around 20°‐25° are
351
observed. The cause of such differences is not clear, even though uncertainties during sampling
352
(slices not perfectly perpendicular to the flowstone growth) and deflections related to a possible
353
anisotropy effect connected to the calcite crystals growth cannot be completely excluded. To
guarantee the high quality of the new data, only ChRM directions characterized by MAD values
355
lower than 6o have been used in the plots. Directional data of each core have been kept clearly
356
distinguishable, because only RMD1 was directly dated and even though the paleomagnetic
357
records from the two cores are consistent and despite the fact that the two cores are only 30 cm
358
apart, their simultaneous growth cannot be fully guaranteed.
359
The paleosecular variations registered by the Rio Martino speleothem are compared with spot
360 archeomagnetic directions obtained from dated archeological structures and volcanic rocks from 361 Italy. The data from the in situ archeological material are taken from the Italian archeomagnetic 362 dataset (Tema et al., 2006; Tema, 2011) updated by some recently published results (Malfatti et 363 al., 2011; Kapper et al., 2014; Tema et al., 2013; 2015; 2016). The data from the Italian volcanic 364
eruptions have been downloaded from the GEOMAGIA50.v3 database (Brown et al., 2015). All
365
data have been relocated at the geographic coordinates of Rio Martino via the virtual geomagnetic
366
pole method (Noel and Batt, 1990). The comparison shows that the archeomagnetic and volcanic
367
data generally fit very well to the speleothem directions (Fig. 10). Some discrepancies in
368
declination can be observed around 1000 AD. For this period the speleothem declination values
369
are very low and quite dispersed. Nevertheless, it is particularly interesting to note that for the BC
370
period, the available archeomagnetic data, even if very limited and often accompanied by large
371
error bars, are in excellent agreement with the new data, in spite of the speleothem inclination
372
being systematically higher. Recently, Ponte et al. (2016) noticed that the inclination values in
373 speleothems seem to vary as a function of the orientation of the calcite growth. To check for this 374 effect, we calculated the mean paleomagnetic direction for both RMD1 and RMD8 applying Fisher 375 Statistics, selecting ChRMs with MAD < 6°. Their mean directions (RMD1: D = 358.8°, I = 65.1°, 95 376
= 1.9°; RMD8: D = 2.4°, I = 65.8°, 95 = 1.7°) are close to the GAD at Rio Martino’s geographic
377
coordinate (D = 0°, I = 63°), even if statistically distinguishable. However, AIRM shows a reliable
consistency between the mean ChRM and the mean I1 axis, which confirms that the orientation of
379
the ferromagnetic minerals was mainly controlled by the geomagnetic field present during
380
speleothem accumulation. This substantiates the high potential of Rio Martino speleothems to
381
continuously and reliably register the Earth's magnetic field, offering a unique source of high
382
quality data for the BC period where in situ archeological artifacts are very scarce.
383
The new data are also compared with the predictions of global geomagnetic field models. Here,
384
we have used for comparison the pfm9k.1a (Nilsson et al., 2014) and the SHA.DIF.14k (Pavón‐
385
Carrasco et al., 2014) models that are the most recently published global geomagnetic models for
386
the Holocene. There is good agreement between the speleothem records and the global models
387
predictions, confirming some interesting features of the Earth's magnetic field in the past. The
388
eastward declinations around 1000 BC mainly observed in the SHA.DIF.14k model are observed in
389
the speleothem data for the same time period, and also show high declination values. For the
390
4000‐2000 BC period, only small declination variations are shown by the speleothem data, in
391
agreement with the pfm9k model's predictions, while the declination peaks seen in the
392
SHA.DIF.14k model (e.g. around 3600 BC) are not confirmed by the speleothem data. For periods
393
older than 5000 BC, speleothem records show generally higher declination values compared to the
394
model predictions and other archeomagnetic data. Interestingly, similar eastward declination
395
values were found for cave sediments in Switzerland (Kapper et al., 2014). Regarding the
396
inclination data, good agreement can be observed for the periods 6000‐3500 BC and 500 BC‐500
397
AD. However, around 1000 BC, speleothems show an interesting high‐inclination peak that is not
398
observed in the models or sustained by the available archeomagnetic data. This peak is actually
399
only observed on the data from the RMD8 core and definitely more independent records are
400
necessary to investigate if it corresponds to a real abrupt directional change (as it corresponds also
401
to high declination values) of the geomagnetic field at this time period. For the 7500 BC to 6000 BC
period, the speleothem records show continuously increasing inclination with a peak around 6000 403 BC that seems to be in agreement with the model’s predictions. 404 405 7. Conclusions 406 Some outstanding characteristics of the Rio Martino flowstone, such as its continuous growth, the 407 well‐constrained chronology and the intense magnetic signal, make its paleomagnetic directional 408
record for the Holocene in the northwestern Italy particularly appropriate for PSV investigation.
409
The high magnetic signal permits a high‐resolution record of around 60 yr per data point; the
410
regular scatter of paleomagnetic data through time shows an almost constant distribution of
411
directional data though the Holocene.
412
The obtained directional results are well defined and offer a unique, almost continuous, secular
413
variation record for the last 10,000 years. Although some discrepancies can be observed,
414
comparison with archeomagnetic data and global geomagnetic field models confirms the high
415 potential of these speleothems to the reconstruction of the Earth's magnetic field variations in the 416 past. 417 Our results show that the Rio Martino flowstones are not affected by recrystallization effects or 418
secondary alterations. The speleothems do not show any inclination shallowing when compared
419 with model predictions, and in some cases show high inclination peaks that are not observed by 420 the models (e.g. around 3800 BC, 1000 BC, 800 AD). 421 The record characteristics overcome some typical features affecting both clastic sedimentary and 422 the archeomagnetic PSV records, including the smoothness of the magnetic data in the case of the 423 former and the presence of temporal gaps and uneven data distribution in the case of the latter. 424 The high resolution obtained points to the possibility of detecting short and abrupt geomagnetic 425 field changes by studying a wide variety of Earth Magnetic Field variations at a timescale from tens 426
of years to the millennia and highlights the importance of regional differences when modelling the 427 Earth’s field. The use of speleothem records for PSV reconstructions can be particularly important 428 for the prehistoric period where other sources if data coming from archeological artifacts or well‐ 429 dated volcanic eruptions are scarce. 430 431 Acknowledgments 432 We thank the Associazione Gruppi Speleologici Piemontesi (AGSP) for the logistical support during 433
field campaign and in particular Raffaella Zerbetto for her kindness and competence. E. Ferrara
434 (INRIM) is gratefully acknowledged for hysteresis measurements and A. Roncioni for his support in 435 coring operations. J.M. Feinberg and two anonymous referees are thanked for helpful reviews that 436 greatly improved the manuscript. This paper is dedicated to the memory of Prof. Roberto Lanza 437
who enthusiastically supported this study during the last months of his life giving fundamental
438 advices and suggestions. 439 References 440 Almqvist, B.S.G., Herwegh, M., Schmidt, V., Pettke, T., Hirt, A.M., 2010. Magnetic susceptibility as a 441
tool to study deformed calcite with variable impurity content. Geochemistry Geophysics
442 Geosystems, 11, Q01Z09, doi:10.1029/2009GC002900 443 Badino, G., Chiri, M., 2005. First data from the underground meteorological station of Rio Martino, 444 Italy. Hellenic Speleological Society. 21‐28 August 2005, Kalamos, Greece. 445
Balestro, G., Fioraso, G., Lombardo, B., 2013. Geological map of the Monviso massif (Western
446
Alps). Journal of Maps, 9, 4, 623‐634, doi: 10.1080/17445647.2013.842507
447
Balestro, G., Festa, A., Tartarotti, P., 2014. Tectonic significance of different block‐in‐matrix
448
structures in exhumed convergent plate margins: examples from oceanic and continental HP
rocks in Inner Western Alps (northwest Italy). International Geology Review. DOI: 450 10.1080/00206814.2014.943307. 451 Brown, M.C., Donadini, F., Korte, M., Nilsson, A., Korhonen, K., Lodge, A., Lengyel, S.N., Constable, 452 C.G., 2015. GEOMAGIA50.v3: 1.General structure and modifications to the archeological and 453 volcanic database. Earth Planets Space, 67:83, doi:10.1186/s40623‐015‐0232‐0 454 Drysdale, R.N., Zanchetta, G., Hellstrom, J.C., Fallick, A.E., Zhao, J.X., 2005. Stalagmite evidence for 455
the onset of the Last Interglacial in southern Europe at 129+/−1 ka. Geophysical Research
456
Letters 32, 1–4.
457
Dunlop, D.J., 2002. Theory and application of the Day plot (Mrs/Ms versus Hcr/Hc) 1. Theoretical
458
curves and tests using titanomagnetite data. J. Geophys. Res., 107, 2056, doi:
459
10.1029/2001JB000486
460
Fairchild, I.J., Smith, C.L., Baker, A., Fuller, L., Spötl, C., Mattey, D., McDermott, F., 2006.
461
Modification and preservation of environmental signals in speleothems. Earth Science
462
Reviews, 75, 105‐153, doi:10.1016/j.earscirev.2005.08.003
463
Font, E., Veiga‐Pires, C., Pozo, M., Carvallo, C., de Siqueira Neto, A.C., Camps, P., Fabre, S., Mirão,
464
J., 2014. Magnetic fingerprint of southern Portuguese speleothems and implications for
465
paleomagnetism and environmental magnetism. Journal of Geophysical Research, 119,
466
7993‐8020, doi:10.1002/2014JB011381.
467
Hellstrom, J.C., 2003. Rapid and accurate U/Th dating using parallel ion‐counting multicollector
468
ICP‐MS. Journal of Analytical Atomic Spectrometry 18, 1346–1351
469
Hellstrom, J.C., 2006. U‐Th dating of speleothems with high initial 230Th using stratigraphical
470
constraint. Quaternary Geochronology, 1, 289‐295.
Jaqueto, P., Trindade, R.I.F., Hartmann, G.A., Novello, V.F., Cruz, F.W., Karmann, I., Strauss B.E., 472 Feinberg, J.M., 2016. Linking speleothem and soil magnetism in the Pau d’Alho cave (central 473 South America). Journal of Geophysical Reseach, 121, doi:10.1002/2016JB013541. 474 Johnson, H.P., Lowrie, W., Kent, D.V., 1975. Stability of Anhysteretic Remanent Magnetization in 475
fine and coarse magnetite and maghemite particles. Geophysical Journal of the Royal
476
astronomical Society, 41, 1‐10.
477
Kapper, L., Anesin, D., Donadini, F., Angelucci, D., Cavulli, F., Pedrotti, A., Hirt, A., 2014. Linking site
478
formation processes to magnetic properties. Rock and archaeomagnetic analysis of the
479
combustion levels at Riparo Gaban (Italy). Journal of Archaeological Science, 41, 836‐855.
480
Kapper, L., Donadini, F., Mauvilly, M., Panovska, S., Hirt, A.M., 2014. New directional
481
archaeomagnetic data of burned cave sediments from Switzerland and geomagnetic field
482
variations in Central Europe. Geophysical Journal International, 198, 1208‐1221,
483 doi:10.1093/gji/ggu184 484 Lanza, R., Meloni, A., 2006. The Earth’s Magnetism. An Introduction for Geologists. Springer,278 485 pp. 486
Lascu, I., Feinberg, J.M., 2011. Speleothem magnetism. Quaternary Science Reviews, 30, 3306‐
487
3320.
488
Lascu, I., Feinberg, J.M., Dorale, J.A., Cheng, H., Edwards, R.L., 2016. Age of the Laschamps
489
excursion determined by U‐Th dating of a speleothem geomagnetic record from North
490
America. Geology, 44,139‐142, doi: 10.1130/G37490.
491
Latham, A.G., Schwarcz, H.P, Ford, D.C., 1986. The paleomagnetism and U‐Th dating of Mexican
492
Stalagmite, Das2. Earth Planetary Science Letters, 79, 195‐207.
Latham, A. G., Ford, D.C., Schwarcz, H.P., Birchall, T., 1989. Secular variation from Mexican 494 stalagmites: Their potential and problems. Physics of the Earth and Planetary Interiors, 56, 495 34–48. 496
Lean, C.B., Latham, A.C., Shaw, J., 1995. Palaeosecular variation from a Vancouver Island
497
Stalagmite and comparison with Contemporary North American records. J. Geomag.
498 Geoelectr., 47, 71‐87. 499 Leonhardt, R., 2006. Analyzing rock magnetic measurements: The RockMagAnalyzer 1.0 software. 500 Computers & Geosciences, 32, 1420‐1431. 501 Lowrie, W., 1990. Identification of ferromagnetic minerals in a rock by coercivity and unblocking 502 temperature properties. Geophysical Research Letters, 17, 159‐162. 503
Malfatti, J., Principe, C., Gattiglia, G., 2011. Archeaomagnetic investigation of a metallurgical
504 furnace in Pisa (Italy). Journal of Cultural Heritage, 12, 1‐10. 505 Mandea, M., Olsen, N., 2009. Geomagnetic and Archeomagnetic Jerks: Where Do We Stand? Eos, 506 Transactions, American Geophysical Union, 90, 24, 208‐208. 507
Maxbauer, D.P., Feinberg, J.M., Fox, D.L., 2016. MAX UnMix: A web application for unmixing
508
magnetic coercivity distributions. Computers & Geosciences, 95, 140‐145.
509
Morinaga, H., Inokuchi, H., Yaskawa, K., 1989. Palaeomagnetism of stalagmites (speleothems) in
510
SW Japan. Geophys. J., 96, 519‐528.
511
Nilsson, A., Holme, R., Korte, M., Suttie, N., Hill, M., 2014. Reconstructing Holocene geomagnetic
512
field variation: new methods, models and implications. Geophysical Journal International,
513
198, 1, 229‐248.
514
Noel, M., Batt, C.M., 1990. A method for correcting geographically separated remanence
515
directions for the purpose of archaeomagnetic dating. Geophysical Journal International,
516
102, 753‐756.
Openshaw, S., Latham, A., Shaw, J., 1997. Speleothem Palaeosecular Variation Records from 518 China: Their contribution to the coverage of Holocene Palaeosecular Variation Data in East 519 Asia. J. Geomag. Geoelectr., 49,485‐505. 520 Osete, M. L., Martin‐Chivelet, J., Rossi, C., Edwards, R.L., Egli, R., Munoz‐Garcia, M.B., Wang, X.F., 521
Pavon‐Carrasco, F.J., Heller, F., 2012. The Blake geomagnetic excursion recorded in a
522
radiometrically dated speleothem. Earth Planetary Science Letters, 353, 173–181.
523
Pan, Y., Zhu, R., Banerjee, S.K., Gill, J., Williams, Q., 2000. Rock magnetic properties related to
524
thermal treatment of siderite: behaviour and interpretation. Journal of Geophysical
525 Research, 105, 783‐794. 526 Pavón‐Carrasco, F.J., Osete, M.L., Torta, J.M., De Santis, A., 2014. A geomagnetic field model for 527 the Holocene based on archaeomagnetic and lava flow data. Earth Planetary Science Letters, 528 388, 98 ‐ 109. 529
Perkins, A.M., 1996. Observations under microscopy of magnetic minerals extracted from
530 speleothems. Earth and Planetary Science Letters, 139, 281‐289. 531 Ponte, J., Font, E., Veiga‐Pires, C., Hillaire, M.C., 2016. Paleomagnetism in speleothems: Influence 532 of calcite growth dip on the natural remanent magnetization. EGU General Assembly 2016, 533 17‐22 April, Vienna, p.7199 534
Richards, D.A., Dorale, J.A., 2003. Uranium‐series chronology and environmental applications of
535 speleothems. Review in Mineralogy and Geochemistry, 52, 407‐460. 536 Rolph, T.C., Vigliotti, L., Oldfield, F. 2004. Mineral magnetism and geomagnetic secular variation of 537 marine and lacustrine sediments from central Italy: timing and nature of local and regional 538 Holocene environmental change. Quaternary Science Review, 23, 1699–1722. 539
Scholz, D., Hoffmann, D.L., Hellstrom, J., Bronk Ramsey, C., 2012. A comparison of different
540
methods for speleothem age modelling. Quaternary Geochronology. 14, 94–104.
Strauss, B.E., Strehlau, J.H., Lascu, I., Dorale, J.A., Penn, R.L., Feinberg, J.M., 2013. The origin of
542
magnetic remanence in stalagmites: observations from electron microscopy and rock
543
magnetism. Geochemistry Geophysics Geosystems, 14, doi: 10.1002/2013GC004950
544
Symons, D.T.A., Cioppa, M.T., 2000. Crossover Plots: a useful method for plotting SIRM data in
545
paleomagnetism. Geophysical Research Letters, 27 (12), 1779‐1782.
546
Tema, E., 2011. Archaeomagnetic Research in Italy: Recent achievements and future perspectives.
547
In: The Earth’s Magnetic Interior, IAGA Special Sopron Book Series, Volume 1, Chapter 15,
548 pp. 213‐233. Eds: Petrovsky, E., Herrero‐Bervera, E., Harinarayana, T., Ivers, D., Springer, doi: 549 10.1007/978‐94‐007‐0323‐0_15. 550 Tema, E., Hedley, I., Lanos, Ph., 2006. Archaeomagnetism in Italy: A compilation of data including 551
new results and a preliminary Italian Secular Variation curve. Geophysical Journal
552 International, 167, 1160‐1171. 553 Tema, E., Fantino, F., Ferrara, E., Lo Giudice, A., Morales, J., Goguitchaichvili, A., Camps, P., Barello, 554 F., Gulmini, M., 2013. Combined archaeomagnetic and thermoluminescence study of a brick 555 kiln excavated at Fontanetto Po (Vercelli, Northern Italy). J. Arch. Science, 40 (4), 2025‐2035. 556
Tema, E., Camps, P., Ferrara, E., Poidras, T., 2015. Directional results and absolute
557
archaeointensity determination by the classical Thellier and the multi‐specimen DSC
558 protocols for two kilns excavated at Osterietta, Italy. Studia Geophysica Geodaetica, 59, 554‐ 559 577. 560 Tema, E., Ferrara, E., Camps, P., Conati Barbaro, C., Spatafora, S., Carvallo, C., Poidras, Th., 2016. 561
The Earth's magnetic field in Italy during the Neolithic period: New data from the Early
562
Neolithic site of Portonovo (Marche, Italy). Earth and Planetary Science Letters, 448, 49‐61.
Turner, G.M., Thompson, E., 1981. Lake sediment record of the geomagnetic secular variation in 564 Britain during Holocene times. Geophysical Journal of the Royal Astronomical Society, 65 (3), 565 703‐725. 566
Vigliotti, L., 2006. Secular variation record of the Earth's magnetic field in Italy during the
567 Holocene: constraints for the construction of a master curve. Geophys. J. Int., 165, 414–429. 568 Xie, S., Evershed, R.P., Huang, X., Zhu, Z., Pancost, R.D., Meyers, P.A., Gong, L., Hu, C., Huang, J., 569 Zhang, S., Gu, Y., Zhu Y., 2013. Concordant monsoon‐driven postglacial hydrological changes 570
in peat and stalagmite records and their impacts on prehistoric cultures in central China.
571
Geology, 41, 827‐830, doi:10.1130/G34318.1
572
Zhu, Z., Zhang, S., Tang, C., Li, H., Xie, S., Ji, J., Xiao, G., 2012. Magnetic fabric of stalagmites and its
573
formation mechanism. Geochemistry Geophysics Geosystems, 13, doi:
574
10.1029/2011GC003869.
575 576
Figure Caption 577 578 Figure 1. a) Structural sketch map of the Western Alps; b) 3D reconstruction of the Inner Western 579
Alps in the Rio Martino zone (modified after Balestro et al., 2014). The square indicates the
580
location of the Rio Martino Cave. Note: the region highlighted in the small inset map is not the
581 same as the one shown in the enlargement. 582 Figure 2. a) Part of core RMD8; b) part of the flowstone systematically cut and sampled in 3 mm‐ 583 thick slices; c) the amagnetic plastic cylindrical holder created in order to fix the small samples in 584 the centre of the cylinder and treat them as standard paleomagnetic samples. 585 Figure 3. Age‐depth model for RMD1 core. The age is expressed both in ka AD and in b2k (before 2 586 ka). 587 Figure 4. The distribution of the mineral species in the insoluble (detrital) fraction of Rio Martino 588 speleothem. The picture is the sum of ca 1500 EDS determinations from seven different portions 589
from the same core. The “accessory minerals” are species <2.5 % of the analyzed particles, for
590
each sample and includes rutile, zircon, monazite, apatite (mainly apatite‐F), sphene, xenotyme,
591
galena, pyrite, ilmenite, barite.
592
Figure 5. a) Isothermal remanent magnetization (IRM) acquisition curves; b) thermal
593
demagnetization of a composite three‐axes IRM (Lowrie, 1990); c) crossover plots (Symons and
594
Cioppa, 2000).
595
Figure 6. Equal area stereographic projections of the eigenvectors for a) the anisotropy of
596
magnetic susceptibility, and for b) and c) isothermal remanent magnetization, where the
597
maximum, intermediate, and minimum eigenvectors are denoted by squares, triangles, and
598
circles, respectively. The 95% confidence ellipses for the eigenvectors are shown by unfilled
ellipses. The mean ChRM directions and their alpha95 errors for specimens SP200 to SP260 (b) and
600
SP346 to SP397 (c) are denoted by stars with grey ellipses.
601
Figure 7. Thermal and AF demagnetization results from twin specimens from samples a‐b) RM7
602 and c‐d) RM20 plotted in intensity decay plots (left) and Zijderveld diagrams (right). Symbols: full 603 dots = declination; open dots = apparent inclination. 604 Figure 8. Equal‐area projections of the ChRM directions for five samples obtained from a) AF and 605 b) thermal demagnetization on twin specimens. The star represents the mean value calculated for 606 each group of samples following a Fisherian distribution. 607
Figure 9. a) Declination and b) inclination data from cores RMD1 (red) and RMD8 (blue) plotted
608
versus depth in mm from the top of the core.
609
Figure 10. a) Declination and b) inclination plots of the RMD1 (red) and RMD8 (blue) compared
610
with the Italian archaeomagnetic data from archeological artefacts (green diamonds) and volcanic
611
rocks (black squares) and the pfm9k (magenta line) and SHA.DIF.14k (black line) global
612
geomagnetic field models. All directions are calculated at the geographic coordinates of Rio
613
Martino (44.7o N, 7.15o E). Age is given both as Calendar Age (year AD) and b2k (before 2 ka).
614
Figure caption of the Supplemental material 615
Figure S1. a) Photograph of the flowstone's sampling and b) of the device to orient the core.
616
Figure S2. a) Mass susceptibility and b) mass remanence intensity from RMD1 (red) and RMD8
617
(blue) plotted versus depth in mm from the top of the core.
618
Figure S3. Hysteresis curves (mass magnetization versus applied field) for specimens SP421 and
619
SP460. In a) uncorrected curves; in b) slope‐corrected for diamagnetic effect curves.
Table caption 621
Table S1. Corrected U/Th ages for RMD1 core. Isotope ratios are expressed as activity ratios
622
standardized to the HU‐1 secular equilibrium standard. Ages have been calculated using decay
623
constants of 9.195 × 10⁻⁶ (230Th) and 2.835 × 10⁻⁶ (234U). Depths are from top.
624
Table S2. Characteristic remanent magnetization directions (ChRMs) of the samples from the
625
RMD1 (left) and RMD8 (right) cores. Legend: z = depth in mm from the core top; D, I = magnetic
626
declination and inclination; MAD = Mean Angular Deviation; Dcorr = declination corrected by
627
subtracting the angular difference between the DGAD = 0° and the mean ChRM declination (D =
628 146.1°). 629 630 Figure 1 631
632 Figure 2 633 634 Figure 3 635
636 Figure 4 637 638 Figure 5 639
640
Figure 6
642
Figure 7
644 Figure 8 645 646 Figure 9 647
648 Figure 10 649 650