Urban non-urban agglomeration divide:
is there a gap in productivity and wages?
Eleonora Bartoloni, Andrea Marino, Maurizio Baussola, Davide Romaniello
Quaderno n. 148/novembre 2020
DIPARTIMENTO DI SCIENZE ECONOMICHE E SOCIALI Università Cattolica del Sacro Cuore
Urban non-urban agglomeration divide:
is there a gap in productivity and wages?
Eleonora Bartoloni, Andrea Marino, Maurizio Baussola, Davide Romaniello
Eleonora Bartoloni, Andrea Marino, ISTAT, Istituto Nazionale di Statistica, sedi regionali Lombardia e Liguria.
Maurizio Baussola, Davide Romaniello, Dipartimento di Economia e Finanza, Università Cattolica del Sacro Cuore, Milano.
[email protected] - [email protected]
[email protected] - [email protected] I quaderni possono essere richiesti a:
Dipartimento di Scienze Economiche e Sociali, Università Cattolica del Sacro Cuore
Via Emilia Parmense 84 - 29122 Piacenza - Tel. 0523 599.342 http://dipartimenti.unicatt.it/dises
[email protected] www.vitaepensiero.it
All rights reserved. Photocopies for personal use of the reader, not exceeding 15% of each volume, may be made under the payment of a copying fee to the SIAE, in accordance with the provisions of the law n. 633 of 22 april 1941 (art. 68, par. 4 and 5). Reproductions which are not intended for personal use may be only made with the written permission of CLEARedi, Centro Licenze e Autorizzazioni per le Riproduzioni Editoriali, Corso di Porta Romana 108, 20122 Milano, e-mail: [email protected], web site www.clearedi.org.
Le fotocopie per uso personale del lettore possono essere effettuate nei limiti del 15% di ciascun volume dietro pagamento alla SIAE del compenso previsto dall’art. 68, commi 4 e 5, della legge 22 aprile 1941 n. 633.
Le fotocopie effettuate per finalità di carattere professionale, economico o commerciale o comunque per uso diverso da quello personale possono essere effettuate a seguito di specifica autorizzazione rilasciata da CLEARedi, Centro Licenze e Autorizzazioni per le Riproduzioni Editoriali, Corso di Porta Romana 108, 20122 Milano, e-mail: [email protected] e sito web www.clearedi.org
© 2020 Eleonora Bartoloni, Andrea Marino, Maurizio Baussola, Davide Romaniello ISBN 978-88-343-4448-4
Abstract: This paper investigates the productivity-wage relation in the Italian Lombardy region using a novel and integrated database of firms’ plant. We find that agglomeration economies play a significant role in affecting productivity and wages differentials at the local level. However, this effect depends on the technological and knowledge-based resources characterising the industrial mix within the urban and non-urban agglomerations, also controlling for firm-specific factors concerning, in particular, job-related characteristics. High-density urban areas show a positive wage gap in the high technology and knowledge-intensive services, brought about higher productivity. In contrast, manufacturing plants show a reduction of the gap only partially offset by sectoral specificities.
JEL Codes: R12, R15, R30, L25, C21, J24, J31
Key words: labour productivity, wage determination, spatial
1. Introduction
The dynamics of wages and productivity has always been crucial to understanding the pace of a country’s growth path and its relative position regarding inflation and income distribution, i.e., labour and capital shares.
This issue has, of course, relevant implications and has been investigated both on a time series perspective and in a spatial framework. These two approaches complement each other, as the first provides the intertemporal macroeconomic framework in which a more disaggregated analysis may be undertaken eventually.
The macroeconomic picture that one can derive from the mid 1990’s suggests that, at least for the OECD countries, there has been a significant and constant decoupling between labour productivity growth and wage growth, in that the latter’s pace has been significantly lower than that of the former.
It is also observed an increase in the wage growth dispersion, as real median wage growth significantly overtakes the real average wage growth (Uguccioni 2016). On the whole, labour productivity and wages grew at a lower pace in the last two decades compared to the previous post-WWII periods. However, a significant decoupling is operational and is also accompanied by a decline in the labour share. (OECD 2018) The spatial counterpart of the productivity-wage relation emphasizes the role of regions or other spatial areas in affecting both variables and, ultimately, the productivity-wage gap. The studies which follow this approach typically aim to ascertain whether regional characteristics – also controlling for industry
and firm characteristics – affect the wage and productivity differences. This paper addresses the question from a regional level of analysis, aiming to investigate the role of localization in high- and low-density areas and sectoral specificity.
Local differences in productivity and wages may have different explanations. So far, empirical evidence shows agglomeration economies may enhance the economic performance of firms operating in urban areas in terms of productivity and wage growth (Beaudry and Schiffauerova, 2009). Also, it has been identified the presence of an urban-rural divide in terms of business productivity (Webber et al., 2009; Rizov and Walsh, 2011; Bartoloni and Baussola, 2019), with establishments in rural areas showing lower productivity compared to more densely populated areas not only because of less favorable industrial structure but also because of firm-specific characteristics in terms of firm structure, capital, and skills endowment. As for the latter, firms in the highest density areas may find it easier to access diversified job experiences, thus increasing workers’ abilities.
In this respect, workers’ characteristics may directly affect the company performance in the highest density areas. Besides these positive externalities, congestion impacts (Henderson, 1974) may originate from competition among firms for the skilled workforce, which may lead to higher production costs and further upward pressure on wages (Combes and Duranton, 2006; Zheng, 2011).
Given these considerations, we are interested in investigating how urbanization, together with industry firm-specific factors and workers’ characteristics, impacts the productivity-wage gap
at the sub-regional level, using a new establishment data set. The analysis is focused on the Italian Lombardy region, which is one of the so-called four motors of Europe, together with Baden-Wuttemberg, Rohn-Alpes, and Cataluna. This cluster of regions represents core European areas characterized by high level of per capita income, industrialization and innovativeness. This paper may, therefore, represent the first step for further comparative analysis aimed to investigate the pattern of productivity and wages among the most developed European areas thoroughly, thus providing useful information for policy intervention. Results indicate that agglomeration economies play a significant role in affecting productivity and wages differentials at the local level. However, this effect depends on the technological and knowledge-based resources characterising the industrial mix within the urban and non-urban agglomerations.
The paper, therefore, proceeds as follows. The next section discusses the literature on the geographical differences of productivity and wages and its link with the more general debate on this issue at the macroecononomic level. Section 3 presents the data and the level of geographical disaggregation used. Section 4 explores aggregate patterns of productivity, wages and productivity-wage gap at the local area and sectoral level of analysis. Section 5 provides the analysis at the establishment level. Section 6 provides further evidence on sector heterogeneity and deals also with endogeneity issues. Section 7 concludes the paper.
2.
Space, productivity and wages
A large body of literature has focused on different patterns of firms’ performance according to their location. Hence, micro grounded investigations are particularly suited for verifying the role of firm, industry and geographical factors in affecting firms’ productivity.
The studies by Henderson (2003), Martin et al. (2011), Baldwin et al. (2008) and Anderson and Loof (2011) provide estimates of the impact of urbanization - and agglomeration in general - on firms’ productivity in different economic contexts and industries. Although these studies provide evidence of a clear productivity gain as long as urban density increases, it also arises that firms’ cost may be affected by agglomeration, thus reducing their profitability (Jensen Verwijnaran, 2010; Bartoloni and Baussola, 2019; Stavropoulos and Skures, 2016). As wages are a significant component of a firm’s production costs, it is therefore worth analyzing if space, and more precisely agglomeration, matters in describing the wage determination at the firm/plant level.
However, exogenous institutional factors, i.e., unionization and collective bargaining, may play a non-negligible role and thus may impact on wages across geographical areas significantly. Indeed, the idea that the wage setting rules in continental Europe may distort the productivity-wage link is at the center of a controversial debate.
One can argue that a centralized wage bargaining setting may deter wages to adjust in areas where productivity is relatively low, thus causing an increase in unemployment (Konings and
Marcolin 2014, Pench et al., 1999). However, this argument does not take into account the role played by structural unemployment which typically is less sensitive to wage variation. Additionally, one should consider that a centralized wage setting reflect minimum wages and therefore such wages may be sufficiently low in areas characterized by lower productivity. This mechanism is operational for example in Italy’s disadvantage areas in the South, where National Contractual Agreement (NCA) wage represents a lower floor, in that firms pay a salary equal or slightly higher than the minimum fixed by the national agreement, as well documented in Dell’Aringa and Pagani (2005). Furthermore, the demand side mechanism should be considered, if one wants to fully understand the mechanism which determines productivity growth and unemployment regional differentials (Deleidi et. al. 2020).
Our investigation aims to highlight differences in firms’ productivity and wages according to their location regarding high density populated areas or rural areas. The institutional framework that contributes to determine wages lies therefore in the background of the analysis and may help explain the difference between the productivity and wages dispersion across areas.
It is worth highlighting that this disaggregated analysis is relevant because one of the most significant and striking evidence of the growth pattern in the OECD countries is represented by the patchy territorial characteristics of growth even within regions characterized by higher average living standards.
In particular, we do observe an urban – rural divide, which requires a more in–depth analysis based specifically on firms’ behavior in different industries and areas. This analysis may help delineate policy aimed at reducing discrepancies in growth opportunities between areas and hence stimulate the whole economy growth.
Ahrend et. al. (2014) underline the crucial role of urban areas -and more specifically high–density populated metropolitan areas – in affecting wages and , according to their reasoning, productivity. Thus, an explicit investigation of a productivity-wage gap is not considered, thereby assuming a straightforward relation between these two variable. As we discuss later in this paper, such a relation is not always clear-cut among regions and even sub-regional geographical areas, suggesting therefore that both variables should be analysed to derive a more precise evidence of an area’s economic performance.
Along this line of reasoning Kampelmann et.al (2018) analyse the drivers of regional differences in productivity and wages emphasizing the role of worker, firm and regional characteristics. Taking the institutional framework of the wage setting rules in the background, i.e., the relevance of NCA in the wage setting mechanism in continental Europe (in their case Belgium), they derive the impact on productivity and wages conditional on workers’ human capital, gender, age and taking into account industry characteristics.
Also, firms’ characteristics may account for their size and other structural characteristics like capital intensity. Areas’ characteristics, i.e., population density, reflect agglomeration economies related to following Duranton and Puga (2005)
-the sharing of productive infrastructure, learning mechanisms and matching opportunities between firms and employer-employees.
However, together with such positive externalities, diseconomies of agglomeration may be operational, and they may affect firms’ performance if one considers not only productivity but also their earnings. Baussola and Bartoloni (2019) find that an urban- non-urban productivity divide exists in a sample of Italian sub-regional areas, but this premium vanishes when considering profitability, thus calling for a negative role played by diseconomies (cost) of agglomerations. This finding is also confirmed in a previous study for the Tokio metropolitan area by Zheng (2001), in that diseconomies of agglomeration are significant and reflect mainly high housing and land prices, long commuting times, and a low environmental quality of life.
The core hypothesis of our study is, therefore, to test and quantify the urban non-urban productivity divide and its main determinants related to firm and industry characteristics. Simultaneously, we explicitly consider spatial wage discrepancies, and the productivity wage gap.
This analysis enables us to verify how wage variability among areas is less noticeable, depending on the relevance of national and industry wage setting rules. It also underlines the main drivers of such differences which nevertheless exist although at a lesser extent compared with productivity differentials.
3.
Data description
We use the territorial 2016 Structural Business Statistics (SBS, FRAME), i.e., the Italian business register which integrates establishment data by using (i) the SBS register, the main data source on structural and economic characteristics for the total population of Italian enterprises and (ii) the Statistical Archive of Active Firms (ASIA-UL), the statistical register of business establishments. Information on job quality stems from the ASIA Employment Archive, a matched employer-employee data set from which we derive additional variables on the demographic and job-related characteristics of employment at the firm level. The localization of productive units is defined at the municipality level (Local Administrative Units, LAU2), whose degree of urbanization is detected using the DegUrba methodology1. The data set covers all industry and services activities, excluding the financial sector as well as some personal and household services. The economic sector at the establishment level corresponds to its principal activity according to the Nace Rev. 2 classification.
1 The DegUrba classification was set up by Eurostat and adopted within
various surveys conducted at the European level. Based on a combination of criteria of geographical contiguity and minimum population threshold, this type of aggregation produces a map of the regional territory by a grid square cell of 1 km2 to avoid distortions caused by using local administrative units varying in size and/or shape. This methodology creates a classification of municipalities in three groups: high densely populated areas (at least 50% of the population lives in high-density urban centres), intermediate urban areas (at least 50% of the population lives in urban clusters) and rural areas (at least 50% of the population lives in rural grid cells)
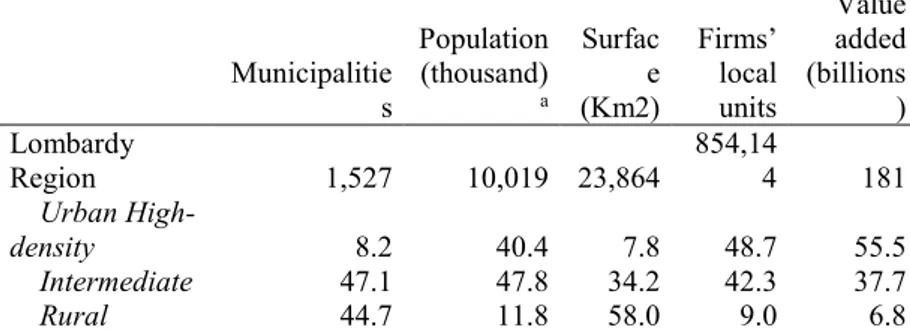
We adopt a sector aggregation according to the level of technology and knowledge intensity (Eurostat)2. Although based on the NACE Rev.2 classification, this aggregation of activities is better suited to better capture differences related to the firm’s technological capabilities and the availability of skills within the productive units. We have more than 4.7 million establishments in Italy, generating almost 716 billion euros of value-added. In Lombardy, more than 850 thousand establishments are localized, which generates 186 billion euros of value-added, corresponding to about one-fourth of the national amount. Descriptive statistics by areas are reported in Table 1.
Table 1. Basic characteristics of the DegUrba clusters (totals and % by aggregations)
aResidents at the 1th of January 2017
2Htech classification: https://ec.europa.eu/eurostat/cache/metadata/en/htec_esms.htm
Municipalitie s Population (thousand) a Surfac e (Km2) Firms’ local units Value added (billions ) Lombardy Region 1,527 10,019 23,864 854,144 181 Urban High-density 8.2 40.4 7.8 48.7 55.5 Intermediate 47.1 47.8 34.2 42.3 37.7 Rural 44.7 11.8 58.0 9.0 6.8
4.
Descriptive analysis
4.1 Aggregate patterns3
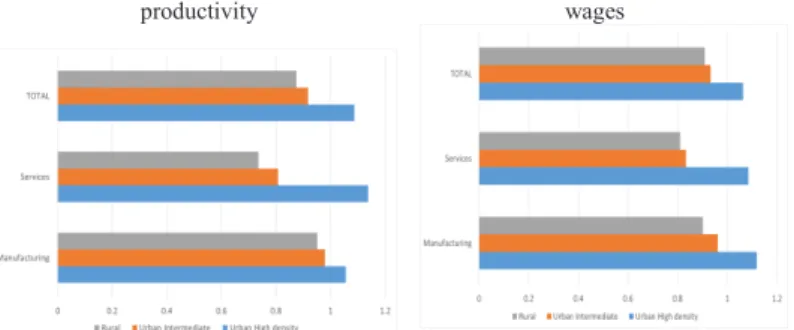
The aggregate evidence shows that both productivity and wages are higher in manufacturing (65k and 33k EUR, respectively) than in services (47k and 28k EUR). One should note, however, that financial services are excluded in our investigation and hence this fact does affect this comparison. The difference in productivity is higher than in wages, and we observe a higher productivity-wage gap in manufacturing than in services (32k and 20k, respectively).
These patterns are clearly correlated to localization (Figure 1): establishments in high-density areas are better off than those located in the others. However, this advantage is not equally shared between services and manufacturing units. The productivity gain is mainly concentrated in services, whereas differences across areas are less pronounced in manufacturing. The wage gain, conversely, is less differentiated between these two sectors.
3In the analysis developed in this section all aggregates are computed by summing up
plant-level values for full-time equivalent employees, value added and gross wages. The full set of aggregates are available on request.
Figure 1. Aggregate patterns of productivity (on the left) and wages (on the right): between-area variations. Lombardy=1
productivity wages
A step forward in this descriptive analysis aims to disentangle the contribution to the total variability due to the specific industry mix within the area, from the contribution due to the average performance of the establishments operating there. The analysis is performed at the 2 digit NACE industry classification for manufacturing and services. We use a decomposition technique (Rice, 2006; Rizov and Walsh, 2011) according to which the aggregate economic performance (component A in the tables of results) in the area is a weighted average of industry performances using the appropriate industry shares as weights. The methodology may be summarized as follows:
(1) 𝑝𝑝𝑎𝑎 = ∑ 𝑝𝑝𝑖𝑖 𝑎𝑎𝑖𝑖λ𝑎𝑎𝑖𝑖 = ∑ 𝑝𝑝𝑖𝑖 𝑎𝑎𝑖𝑖𝜆𝜆̅𝑖𝑖 + ∑ 𝑝𝑝̅𝑖𝑖 𝑖𝑖λ𝑎𝑎𝑖𝑖 + ∑ (𝑝𝑝𝑖𝑖 𝑎𝑎𝑖𝑖 −
𝑝𝑝̅𝑖𝑖)(λ 𝑎𝑎
𝑖𝑖 − 𝜆𝜆̅𝑖𝑖 ) − ∑ 𝑝𝑝̅𝑖𝑖𝜆𝜆̅𝑖𝑖 𝑖𝑖
Let 𝑝𝑝𝑎𝑎𝑖𝑖 be the average economic performance in sector i and area
a and 𝑝𝑝̅𝑖𝑖 the average of performance for sector i in the Lombardy region (i.e., aggregating all the sub-regional areas a). In the case of productivity, the average value is given by the ratio of sectoral value added to employment in the specific area, while in the case of wages this is given by the ratio of sectoral gross wages to payroll registered employees.
Let λ𝑎𝑎𝑖𝑖 be the share of industry i in area a, given by the share of employment. We can denote industry size in area a as 𝑆𝑆𝑎𝑎 = ∑ 𝑠𝑠𝑖𝑖 𝑎𝑎𝑖𝑖 and λ𝑎𝑎𝑖𝑖 = 𝑠𝑠𝑎𝑎𝑖𝑖/𝑆𝑆𝑎𝑎 . Finally, the share of industry i in Lombardy region is given by 𝜆𝜆̅𝑖𝑖=∑ 𝑠𝑠
𝑎𝑎𝑖𝑖/ ∑ 𝑆𝑆𝑎𝑎 𝑎𝑎
𝑎𝑎 .
The first term on the right-hand side of the above equation (component B, Table 2) is the average firms’ performance in the area, which is conditional on the industry composition being the same as for the Lombardy region. The second term (component C, Table 2) is the average performance in the area given its industry composition, but assuming that the average performance of each industry equals the value observed at the regional level. The third term (component D, Table 2) measures the residual covariance between industry performance and industry composition in each area, while the last term is the aggregate regional performance. Results are normalized by dividing each component by the aggregate regional performance so that we obtain a straightforward interpretation in terms of indexes).
Table 2. Decomposition of Productivity and Wages by area Productivity Wages A -Aggrega te Firm B C -Industr y D -Residu al A -Aggrega te Firm B C -Industr y D -Residu al average productivity composition covariance average wages composition covariance producti
vity index index wages index index All firms Urban High-density 108.4 100.3 107.7 0.4 106.2 99.8 106.8 -0.5 Intermedia te 91.9 99.6 90.6 1.7 93.3 99.9 90.9 2.5 Rural 87.8 99.8 84.9 3.1 90.9 101.8 86.4 2.7 Manufacturing firms Urban High-density 105.7 104.2 101.8 -0.3 111.9 103.5 107.9 0.5 Intermedia te 98.0 98.0 101.1 -1.1 95.8 98.4 96.6 0.8 Rural 95.1 98.9 94.7 1.4 90.2 99.3 89.3 1.5 Services firms Urban High-density 113.3 103.0 110.9 -0.6 108.6 102.2 106.6 -0.2 Intermedia te 80.5 95.7 84.1 0.7 84.0 96.9 85.7 1.5 Rural 73.3 92.9 78.9 1.6 79.8 95.2 82.8 1.9
The results indicate that the gain concerning the productivity of the aggregate index is mainly driven by the industry composition element, which is particularly relevant in services (+10.9 percentage points (p.p.) compared to the regional performance). This component is also relevant in the manufacturing sector (+ 1.8 p.p.), but here firm-specific efficiency conditions play a more relevant role in determining aggregate productivity in high-density areas (+ 4.2 p.p.). The sectoral mix is also more relevant than the firm-specific compensation in affecting the
wage gain of the highly dense urban areas without significant differences between the manufacturing and services activities. The conclusion that can be drawn regarding the productivity-wages gap (Table 3) at this aggregate level of analysis is that: (i) services establishments in the highly dense populated areas show a positive and higher gap compared with the region on the whole, thereby suggesting that their profit share is higher as well; (ii) manufacturing establishments in these areas show a larger share going to labour, compared to the region as a whole given that the labour compensation index is higher than the productivity index.
Table 3. The productivity-wage gap
A
-Aggregate B - Firm Industry C - D -Residual average productivity composition covariance productivity index index
All firms Urban High-density 2.2 0.5 0.8 0.9 Intermediate -1.4 -0.3 -0.3 -0.8 Rural -3.1 -2.0 -1.5 0.4 manufacturing firms Urban High-density -6.1 0.8 -6.1 -0.8 Intermediate 2.2 -0.3 4.4 -1.9 Rural 4.9 -0.4 5.4 -0.1 services firms Urban High-density 4.7 0.8 4.2 -0.3 Intermediate -3.6 -1.1 -1.6 -0.8 Rural -6.5 -2.3 -3.9 -0.3
4.2 Firm level analysis
The use of establishment data allows us to investigate the dispersion thoroughly across economic units. This means that we can document differences across areas based on average values, thus supporting the evidence that we get at the aggregate level. More interestingly, we can measure firm heterogeneity reflected in the dispersion patterns within the areas under investigation. This analysis is restricted to the sub-sample of establishments with payroll registered employees.4
Thus the individual wage is given by the ratio of gross wages to the number of payroll registered employees. Labour productivity is computed as the ratio of value added to the total number of employees. We assume that independent employees, representing 26% of the regional employment,5 have the same gross wage paid to salaried employees. External employment, including agency workers, are not included in the computation of labor cost. The cost for external employment takes part of intermediate consumption; thus it does not contribute to value added formation. (Arnaldi et al., 2016, p. 65)
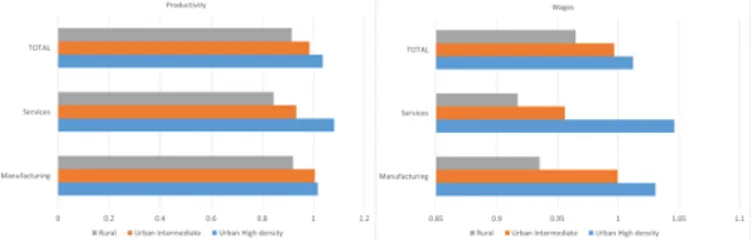
Although restricted to the subsample of establishments with salaried employees, results, based on median values6, are in line with aggregate patterns (Figure 2). Being localized in the high density areas provides a significant difference for the services activities. These establishments show a positive
productivity-4This sub-sample represent the 35% of the total number of establishments
in the region.
5The share is lower in the manufacturing (11%) than in the services (30%). 6Mean values are available on request and do not change the aggregate
wage gap that we do not observe for the manufacturing as a whole and is mainly determined by their higher productivity. An additional breakdown by sectors indicates that in services the positive gap is mainly concentrated in the high technology and knowledge intensive services while in manufacturing, where on average we observe a negative gap, which means that the medium-high and high technology activities still gain a premium (Figure 3). We use Kernel density estimations to investigate firm specific heterogeneity within each area (Figure 4).
Figure 2. Establishment level patterns of productivity and wages (medians): between area variations. Lombardy=1
Figure 3. Productivity-wage gap by sector: between area variations. Lombardy=1
Productivity
Distributions for manufacturing and service establishments are right-skewed, thus having higher mean values than the medians. Descriptive statistics show that the mean productivity is almost 46k EUR compared to the median values, which are equal to 34k EUR.
In both manufacturing and services, the distributions in the urban areas are slightly shifted to the right compared to the rural areas. However, in the urban locations, we observe a higher share of establishments toward the central values in the intermediate areas and, conversely, a higher share toward the tail in the high-density locations. Box plots also show that within-area dispersion in manufacturing characterizes all the within-areas, while in services is much more pronounced in the high-density locations. These patterns are also reflected in the median values, which are aligned in both high density and intermediate areas in manufacturing, while in services are quite different.
Wages
Although in both manufacturing and services the distributions appears right skewed, in the latter we observe a bimodal distribution, with a large share of units concentrated toward the central values between the two peaks. However, in both services and manufacturing the share of units operating toward the tail of the distribution is higher in the high-density locations. Box plots show that the within-area wage dispersion is less pronounced, even in services.
Productivity-wage gap
These patterns are also reflected in the heterogeneous distribution of the productivity-wage gap. Firstly, manufacturing firms show not only a higher median gap compared to services, but also a higher dispersion of the data. This is well described by the kernel curves which are taller and thinner in the services compared to the manufacturing establishments in all the areas. Secondly, we can notice that manufacturing data are equally spread across different locations, with median values quite aligned, while in services the spread seems to correlate with the location of the units, thus indicating a higher level of heterogeneity in the dense locations, compared to the others and, also, less heterogeneity in the rural areas compared to the urban ones. As for the services establishments in the high density locations, the kernel density estimations show a lower share around the central values and a slightly higher share toward larger values. All in all these evidence reveals a higher degree of heterogeneity within services linked to localization factors.
Figure 5. Productivity-wage gap: Kernel density estimation and box plot
5.
The empirical model
Methodology
We estimate separately three equations for labour productivity (log Y), wages (log W) and the productivity-wage gap (log(Y/W) at the local level. The empirical specification may be represented as follows:
where yigenerically indicates the dependent variable of interest
for the establishment i, a is the area of interest according to the DegUrba classification, and s is the sector of activity within the services and the manufacturing industries. Xi is a vector of firm specific variables while Ia indicates a vector of area-level
characteristics.
With this specification we can explore interaction effects between localization (the agglomeration characteristics of the area) and the sector of activity at the establishment level. This modeling procedure is suggested by the aggregate results previously discussed, indicating that the productivity gain that we observe in high density areas is unevenly distributed between services and manufacturing activities. In a linear model, the overall effect of, say, 𝑠𝑠𝑖𝑖 on the dependent variable must be computed as a percent change by making the algebraic sum of the stand-alone coefficient 𝛼𝛼𝑠𝑠 and the coefficient of the interacted term 𝛼𝛼𝑎𝑎𝛼𝛼𝑠𝑠 .
In addition, the inclusion of individual characteristics that may directly affect the performance at the establishment level allows us to control for differences in productive scale (six size classes), the international openness of the firm (a dummy variable indicating whether the establishment is part of an exporting firm) and to account for different types of labour input in terms of gender, type of contract (temporary/permanent), workers’ age and labour quality (the share of high-education workers). Finally, we assume that vector I captures other demand or supply factors affecting the local labour market. Descriptive statistics are reported in Table 4.
Table 4. Descriptive Statistics for the variables used in the empirical model
Variable Mean Std. Dev. Min Max
productivity (log) 10.37 0.91 0.00 12.42 wage (log) 9.85 0.57 8.17 11.29248 gap (log) 0.52 0.73 -11.02 4.240541 less than 10 0.83 0.38 0 1 size 10-19 0.10 0.29 0 1 size 50-249 0.05 0.21 0 1 size 20-49 0.03 0.16 0 1 size 250-499 0.00 0.05 0 1 size 500 + 0.00 0.03 0 1
urban high density 0.49 0.50 0 1
urban intermediate 0.42 0.49 0 1 rural 0.08 0.28 0 1 HT manuf. 0.01 0.10 0 1 MHT manuf. 0.06 0.23 0 1 MLT manuf. 0.07 0.25 0 1 LT manuf. 0.08 0.26 0 1 HITS services 0.05 0.21 0 1 KWNMS services 0.18 0.39 0 1 other services 0.44 0.50 0 1 Household services 0.12 0.33 0 1 internationalization 0.22 0.41 0 1 aged 30-49 0.53 0.32 0 1 high education 0.12 0.23 0 1 males 0.49 0.38 0 1 temporary 0.14 0.24 0 1 employment rate 50.96 2.81 29.94 74.02
*N=254,689- HITS=Higher intensity technology services; KWNMS=knowledge intensive market services(https://www.istat.it/it/files//2017/08/GlossarioNotaMetodologica.pdf,) HT= higher tech. manufacturing; Medium tech. manufacturing; LT=low tech. manufacturing (Pavitt taxonomy)
Given the cross sectional nature of the data, we estimate this specification by using OLS and report heteroscedasticity corrected standard error7. At low inflation rates characterizing both consumption and production prices we use nominal values for both productivity and wages8.
In Table 5 we present the results for the overall sample of establishments operating in the manufacturing and services industries9. In this set of estimates, the localization dummies are interacted with two industry dummies related to the services and the manufacturing industries, with the latter as the reference. In Table 6 and Table 7 we present results for the manufacturing and the services separately. In both these set of estimates we explore further the industry impact by interacting the localization dummy with the sectors defined according to their technology and knowledge intensity (low technology manufacturing and household services are the reference category, respectively). In
7We tested the appropriateness of a SUR specification in order to take into
account simultaneity effects between wage and productivity, without any efficiency gain over OLS. Moreover, given the skewness of the data we also estimated the model using a median regression. We obtained very similar results, thus we decided to opt for the mean regression. This choice is also justified on the ground that the OLS model allows us to derive coefficients for the productivity- wage gap regression which are easily interpreted as the difference of the coefficients for the productivity equation and the wage equation. All these additional estimations are available on request.
8We also estimated our models by using real values of our focus variables.
We adopted two alternatives to get real values: in the first one we used the value added deflator for both productivity and wages, in the other one we used the Consumer Price Index for wages. We obtained coefficients very close to the regressions with nominal values.
9We exclude from the analysis the extraction and utilities sector and the
construction sector, whose characteristics are not directly comparable to the manufacturing or the services activities.
all the estimations the urban intermediate area is used as the reference category.
Results: all establishments
The estimates based on the overall sample show that, in general, being localized in the highest density areas does not affect significantly the productivity at the establishment level, having as the reference category the manufacturing activities in the urban intermediate clusters. Nevertheless, the services activities localized in the high density clusters show a 9.5% gain in productivity, as indicated by the interacted coefficient, thus partially offsetting the general loss of the services industry (-13.7%). Conversely, the establishments in the rural areas reduce the productivity by 3.7%, without any significant difference between services and manufacturing activities (see the interacted coefficient rural*services which is not significant). As concerns the wage variable, higher density areas show a positive contribution (+4.5%) to workers’ compensation. It is worth noting that average wages in services are lower than in manufacturing. However, the latter sector’s specific characteristics imply that the wage premium in the high-density areas is amplified; on the other hand, a negative impact on compensation in the rural clusters prevails (-4.3%), although this effect is moderated by a sectoral services effect.
Looking at the productivity-wage gap estimates, the coefficient of the services dummy is negative (-6.1%), implying that profit margin reduces compared to manufacturing. However, localization matters as the contribution to the productivity-wage
gap when the services dummy is interacted with the high density areas is positive (+6.4%) and, also, tends to completely offset the negative impact previously described.
These interactions between localization and industry activity are estimated controlling for individual characteristics, included in the X vector of additional variables, which may have a direct impact on productivity. One should recall that the set of size dummies clearly indicates that the establishment productivity is positively affected by increasing the scale of production. Taking the less than 10 employees category as the reference group, productivity increases with size, but not in the last group (>500 employees) representing large enterprise. In this group of companies decreasing returns are operational, implying a 24.2% reduction in productivity compared to small firms.
The impact of firm size on labour compensation is positive, in that we do observe an increase in wages as one moves towards higher size classes with the highest impact registered in the medium size (250-499), but with a lower pace for establishments with 500 and more employees. Conversely, this group of establishments shows a positive effect on labour compensation which is lower than that observed in the other size class except the 10-20 class, but is enough to determine a negative impact on the productivity-wage gap in the larger class size (-4.4%). Regarding the characteristics of the labour input, we do find a significant gender gap, probably related to the positive correlation between part time contracts and the proportion of a firm’s female employment. A one p.p. increase in the proportion of a firm’s male employment determines an almost 0.2% gain in productivity.
Age has a positive impact on productivity too, as being in the middle aged group (30-49 years of age) does improve productivity. In this case a one p.p. increase in the proportion of a firm’s employment in this age class, entails a 0.1% increase in productivity.
However, temporary employment leads to a decrease in productivity equal to almost 0.3%, whereas human capital proxied by the level of education shows the highest impact among the labour input variables: a one p.p. increase of the share of high educated workers determines an increase in productivity of 0.75%.
Finally, the impact of the local labour market is captured by the employment rate at the municipality level10. This variable reflects the condition of labour demand and, therefore, the possible relevance of labour market slacks. In other words, higher employment rate reflects the tightness of the labour market and, therefore, the extent to which firms do compete to acquire better workers. The estimates suggest a significant positive impact equal to 10%.
Results by industry
The medium-low, high and medium-high technology establishments represent 70% of the Lombardy manufacturing
10Other potential proxies could be used in order to capture the effect of
local labour market conditions. Given the high disaggregation of our data at the local level, we can only account on labour force census statistics collected at the municipality level.
industry in terms of total employment. Our estimates show that these establishments exhibit, on average, higher level of productivity when compared to the low-tech counterpart, with the medium-high category showing the highest impact (+31%) (Table 6). These plants gain an additional increase when located in the highest density areas. In this case the gain is higher for the establishments of the high-tech sectors (a further +7.6% increase). As for the manufacturing establishments in rural areas, they do not show significant differences in productivity, compared to the urban intermediate locations, which are the reference category. As previously stressed for the overall sample of manufacturing and services establishments, even in the manufacturing industry localization in the highest density areas does not represent a driver of productivity per se, but it does in combination with sectoral specificities.
Conversely, agglomeration economies have a distinctive role in the wage setting. Our estimates show that in the highest density areas wages increase by 4% compared to the intermediate locations, with a substantial further increase for the high-tech establishments (+7.1%). Also, in the rural areas wages are lower, on average (-3.8%), with the medium-high technology establishments showing an additional significant negative effect (-2.7%).
The impact regarding the productivity-wage gap indicates that, although in the high-density areas, the wage pressure tends to limit this gap, it increases when considering the medium-high and medium-low tech sectors.
As for services, being localized in the highest density areas does increase productivity (+2.7%), although this positive effect,
computed at the reference category of the household services, falls behind that regarding wages (+6.2%), thus determining a reduction of the productivity-wage gap. Localization in the rural areas by itself does not affect significantly productivity in the services sector, but it does when interacted with the sectoral dummies. Infact, sectoral specificities are relevant within the services industries and we observe a significant loss of productivity in each of the services sector analysed, compared to the reference category of household services, when the establishments are localized in the rural areas. Interestingly, the knowledge intensive market (KWNMS) services show the highest gain in productivity (+42%), with an additional increase for those localized in the highly density areas (+14%).
Contrary to the general (reductive) effect of agglomeration on the productivity-wage gap previously described, the gain concerning wages for those establishments operating within these knowledge intensive services is not aligned with productivity, giving rise to an increase in the productivity-wage gap, particularly in the high density locations: a further 1.1%, which adds to the stand-alone KWNMS services dummy (+1.5%).
Other significant differences between manufacturing and services arise when considering the direct impact of firm-specific characteristics. One can note that the share of male employment, which is higher in manufacturing than in services (72% vs. 48%), affects productivity and wages much more in manufacturing (respectively +0.3% and 0.4%) than in the services (+0.1% and +0.3%) due to a one p.p. increases in the male share.
Temporary employment, whose share is more relevant in services, reduces productivity and wages more in this latter than in manufacturing (0.3% and 0.2% in the services vs about 0.1% in both variables in the manufacturing. Interestingly, labour quality affect manufacturing and services evenly (more than +6% in both cases with a one p.p. increase in the share of highly educated workers). The increase in compensation is lower (about +5% in both sectors), thus causing a positive contribution to the average gap.
Finally, we should consider the impact of internationalization, which is captured by a dummy variable, reflecting that a firm does export goods or services. Of course, manufacturing companies are more exposed to international competition, and on the whole, the degree of internationalization is also higher in this sector. Therefore, it is reasonable to expect that the impact on productivity is positive and possibly higher for the fewer services firms that compete on international markets compared with their counterparts that operate only in a national context. One should note that the share of exporters in services is far below that in manufacturing (5% vs. 30%).
The estimates suggest that internationalization significantly affects both manufacturing and services’ productivity, but the impact on this latter is higher (+57%). In both cases, the productivity-wage gap tends to increase, although more in services (+23.8%) than in manufacturing (+15.2%).
6. Further evidence on sector heterogeneity and
endogeneity issues
The evidence of previous paragraphs suggests that the influence exerted by urbanization upon productivity and wages may substantially vary -in both sign and size- across economic sectors according to their characteristics of technology intensity. In this section we shed further light on impact heterogeneity, by computing estimates at a sectoral level. This allows us to evaluate the effects of location for the entire set of sectors (whereas the industry effects in the estimates of Tables 5-7 are measured with respect to a chosen reference sector). Moreover, we explicitly address the issue of possible endogeneity bias in the OLS estimates of the link between urbanization and the dependent variables of interest. For the sake of space, we will report only results concerning the productivity-wage gap, which represents the main focus of the present paper. We will also briefly comment on unreported estimates obtained for productivity and wages, to the extent to which this is useful to explain the results we present for the gap regressions.11
In order to accomplish these tasks, we will work with a simpler regression specification, which includes only a modified (dichotomous) measure of urbanization and excludes interaction terms. Doing so allows a substantial reduction in the number of parameters to estimate and, correspondingly, in the number of instrumental variables required to perform IV estimation. In practice, the regression specification is as follows:
(3) 𝑦𝑦𝑖𝑖 = 𝛽𝛽0+ 𝛽𝛽1𝑿𝑿𝑖𝑖 + 𝛽𝛽2𝑰𝑰𝑎𝑎+ 𝛽𝛽𝑈𝑈𝑈𝑈 + 𝜀𝜀𝑖𝑖
where U is a dummy variable measuring urbanization derived i from the DegUrba classification, while the other variables have the same interpretation as before. Recalling that the DegUrba classification splits municipalities into three groups, two alternative definitions for the dichotomous variable have been considered:
1) settingUi 1for areas with high or intermediate density and Ui 0 for rural areas
2) setting Ui 1 for high-density areas and Ui 0 for the two remaining areas
While we will report estimates based upon both alternatives to check sensitivity of results, it is worth noting that the implied partitions are of interest in their own. The former is closer to the broad idea of an urban-rural divide. The latter distinguishes big urban agglomerations from other areas. As such, it may be seen also as an index testing for the productivity advantages of large cities, which have been a focus of the recent literature (see e.g. Combes et al., 2012).
6.1 Sectoral OLS estimates
OLS estimation of specification (3) does not obviously imply any additional technical difficulty with respect to those of Tables 5-7. The main results of interest here are reported in Table 8. For the sake of clarity, the table includes only coefficients of the
urbanization dummy; results concerning the other covariates are similar to those of Tables 5-7.
Let us first look at the upper part of Table 8, where the urbanization dummy equals 1 for both high- and intermediate density areas and zero for rural ones. The first block of four regressions concerns manufacturing industries. The coefficient of urbanization in these estimates is generally far from being statistically significant (and in some cases actually close to zero). This is consistent with the unreported estimates concerning productivity and wages, where the positive impact of urbanization is of similar magnitude.
The following block of results reports OLS estimates concerning services. The interest of the technology-based sector classification adopted here emerges clearly. In the two sub-sectors with higher technology intensity (HITS and KWNMS) the coefficient of the urbanization dummy in the gap regressions is positive, relatively large and statically significant. By contrast, the point estimate is negative for the two remaining sectors and significantly so in the case of “Household Services”. An intuitive interpretation of this set of results is that the positive externalities related to urban agglomerations may overcome the increase of wages (which depends on the increase in congestion costs) only in more technologically sophisticated sectors.
The bottom part of Table 8 reports results obtained when the urbanization dummy takes on a value equal to 1 for high-density urban areas only. As to the manufacturing firms, the interesting difference with respect to the estimates above is that the coefficient of urbanization is always negative and statistically significant in all sectors but the MLT one. In the case of HT and
MHT manufacturing industries, this happens because the positive productivity gains from urban agglomeration are too low with respect to the increase in wage costs. On the other hand, low tech industries (LOT) locating in high density urban areas do not even enjoy productivity advantages from locating in high density urban areas (the coefficient in the unreported productivity regression is insignificant and actually close to zero). Estimates concerning services look much like those in the upper panel of the table, the only relevant difference being that the urbanization dummy is now significant also in the regression of the “Other Services” sector.
To sum up, adopting a narrow definition of “Urbanization” brings about two major implications upon the estimates: 1) the coefficient of the dummy is estimated with higher precision (and is almost systematically significant); 2) the importance of sectoral specificities in influencing the sign of the coefficient emerges more clearly (as far as services are concerned). A clear difference in the sign of the estimated coefficient appears, when comparing the more technologically sophisticated sectors of both manufacturing and services activities. Such a divergence might reflect differences in the role played by agglomeration externalities in manufacturing and services industries, but might be also related to typical differences in input demand.12 As a more in-depth investigation of this issue would be beyond the scope of the present paper, we leave it as an interesting topic for future research.
12 For instance, manufacturing plants might earn lower productivity gains
from urbanization, because they generally require higher land use and land is a much more expensive production factor in urban areas.
6.2 Sectoral IV estimates
Different sources of endogeneity bias may be at work in our estimation framework. As Combes and Gobillon (2015) explain, when estimating the effects of location on outcome variables like productivity and wages, endogeneity bias due to omitted variables may take place both at the local economy level and at the individual level. For instance, omitted variables bias may occur at the local economy if the local availability of amenities like transport infrastructures influences both density and productivity. A similar bias may take place at the individual level if unobserved abilities, not accounted for in the regression specification, influence both individual outcomes and how economic agents sort across locations.13 Another source of endogeneity might come from possible measurement error in the categorical variable measuring the degree of urbanization.14 Bias deriving from reverse causality is in theory possible as well (e.g. as locations offering higher wages attract new workers,
13Sorting effects (the self-selection of more productive firms and workers in
larger cities) and selection effects (the tendency of large cities to select more efficient economic agents through competition) are two potential explanations -along with traditional agglomeration externalities- of why per-capita output is higher in larger cities. Behrens et al. (2014) provide a model accounting for all these mechanisms.
14The impression one gets when taking a bird’s eye view of the DegUrba
data is broadly consistent with what might be expected, with Milan and other major urban cities being classified as “high-density” and small, agricultural centres classified as “rural”. However, some misclassification might be present. For instance, contrary to intuition, the rather small municipality of Rognano (619 inhabitants, and a density of less than 70 inhabitants per square km according to the 2011 population census data) is included into the set of high-density locations.
thereby increasing local density); in practice, however, this is considered a minor concern in the literature (see Melo et al., 2009, on this).
In order to tackle endogeneity, we follow a recent applied work related to ours, Di Giacinto et al. (2014), in that we adopt a two-step procedure for binary endogenous variables suggested by Angrist and Pischke (2008).15 This involves computing first a logistic model in which the dummy U is regressed on a set of i instrumental variables Z as well as on the other covariates included in specification (3); then, the predicted value of the dummy U obtained from the logistic model, say i Uˆ , is used asi
the instrument for U itself in the IV estimation of equation (3).i This estimation strategy implies that the second-stage regression is exactly identified (so that no usual over-identification tests are reported and some caution is needed when interpreting the IV results). The two-step procedure is repeated for each sector and the set of instrumental variables Z is held fixed across sectors and equations for the sake of comparison. Since lagged values of the DegUrba classification are unavailable, we follow again hints in Di Giacinto et al. (2014) in that we select altitude and a lagged (1991) value of population density as the variables to be included into Z.16
15 Analyzing a large sample of Italian manufacturing firms over the years
1995-2006, Di Giacinto et al. (2014) evaluate the location effects of two different kinds of spatially concentrated areas, namely “urban areas” and “industrial districts”. They find that firms located in both types of areas enjoy a productivity premium with respect to those located elsewhere, the gain being significantly larger for producers located in cities.
161991 is the year of the most distant population census for which Istat (the
IV results are reported in Table 9. To begin with, it is worth noting that the instrumental variable we build for each sector is certainly not weak. The first-stage F-statistics is systematically much larger than the conventional threshold value of 10, below which weak identification is usually considered a potential issue (this rule of thumb origins from critical values tabulated in Stock and Yogo, 2005). This being said, the picture provided by IV estimates looks much like that of OLS regressions, as far as the sign and the significance of the coefficient of interest are concerned. Indeed, IV estimates for services sectors perfectly mirror the OLS ones. As to manufacturing activities, the only differences concern sectors with low or medium-low technology intensity. For instance, in the LOT sector the coefficient of urbanization -regardless of how it is defined- is not only negative (consistently with the OLS result) but achieves also statistical significance at a 99% level. Actually, the major difference between the OLS and the IV results concerns the size of the coefficients, with the IV point estimates being almost systematically larger in absolute value. As this is a known implication of mismeasurement error (see e.g. Angrist and Pischke, 2008), a possible explanation of the differences between OLS and IV coefficients is that “attenuation bias” might actually affect the former. Apart from differences in the magnitude of estimated marginal effects, IV regressions are strongly consistent with the OLS ones in that the impact of urbanization upon the variables of interest changes significantly across economic sectors.
administrative boundaries consistent with current ones (i.e. those underlying the DegUrba classification).
7. Conclusions
We have analysed the productivity-wage relation by using a novel and integrated database, which considers establishment information for sub-regional areas in the Italian Lombardy region. In particular, we have investigated whether an urban non-urban agglomeration divide does exist and estimated the impact of industry and firm-specific effects.
More precisely, we find that Lombardy’s manufacturing activities show on average higher productive and tend to pay higher wages compared to non-financial services. They also show a higher wage-gap which is crucially driven by their higher productivity compared to services.
Overall, agglomeration economies play a significant role in affecting productivity and wages differentials at the local level. However, this effect depends on the technological and knowledge-based resources characterising the industrial mix within the urban and non-urban agglomerations.
By applying a separate investigation between manufacturing and services, it is shown that
establishments localised in the high-density areas have higher levels of productivity and wages compared to the regional average; however, this advantage is not equally shared between the manufacturing and services activities. The productivity premium is, on average, higher in services (+13.3 p.p.) compared to manufacturing (+5.7 p.p.). In contrast, the manufacturing establishments in the high-density areas pay higher compensation compared to service (+11.9 p.p. vis a
vis +8.6 p.p.). Accordingly, in the high densely populated areas,
a positive productivity-wage gap prevails for the services’ plants, whereas a negative gap for the manufacturing establishments is observed.
However, it is the industry mix which plays a role in causing these aggregate patterns. The industry composition index for both productivity and wages in the urban high-density areas is above the regional reference level, thus suggesting that, even when agglomeration economies exist, sectoral differences exert a significant effect when a more disaggregated level of analysis is taken into account. Firm-specific characteristics, as captured in this descriptive step by a firm productivity index, also play a role in affecting the higher performance of the densely populated areas, although to a lesser extent - at least in the services sector and on average.
The micro econometric investigation complements the previous analysis and specifically considers the interactions between localisation and industry characteristics.
We adopt an industry classification which enables us to identify manufacturing and services activities according to the level of technological and knowledge intensity to capture the potential interactions between geographical proximity and the transmission of knowledge spillovers better. Moreover, the introduction of firm-level variables allows us to control for the moderating role of firm-related effects, particularly those related to job-related characteristics, i.e. workers’ human capital. We find that the interaction between agglomeration economies and industry characteristics affects plants’ productivity positively. Indeed, localisation in a high-density area without any interaction with industry dummies does not exert a
significant impact in manufacturing. However, when an interaction with dummy variables reflecting an industry’s technological level is considered, such an effect is operational. This impact in services is positive, although it is mainly driven by plants operating in the high technology and knowledge-intensive sectors. Also, the average increase in productivity due to the high-density dummy alone is not aligned with the increase in wages, thus reducing, ceteris paribus, the productivity wage gap.
As concerns wages, localisation in the high-density areas shows a positive and significant effect on compensation in both the manufacturing and services (+4 % and + 6.2 % respectively). Nevertheless, sectoral characteristics may further widen this effect when associated with agglomeration economies. When located in the high-density areas, manufacturing plants in the high technology industries show an additional 7.1% increase in compensation. At the same time, those plants operating in high technology and the intensive knowledge services get a wage increase of 3.3 % and 2,7% respectively. This pattern does not apply to the medium-low technology manufacturing, or to the more traditional service's activities where the interacted coefficients indicate a mild or non-significant effect.
The productivity-wage gap presents less clear-cut evidence. As concerns services, the positive wide gap favouring the high-density areas is confirmed. This effect is confined, however, to those plants in the high technology and knowledge intensive services, because of their higher productivity level, and it is not observed for the more traditional services. Conversely, for the manufacturing plants, the overall reduction of the gap in the
high-density areas, in line with the results of the aggregate analysis, is only partially offset by sectoral specificities.
This fact may be rationalised on the ground that manufacturing plants do not show a substantial gain in productivity due to agglomeration economies. The highest gain is obtained by those establishments in the high technology sectors, also controlling for the quality of firms' labour force. However, this gain is aligned with that of wages.
Al in all, our study provides a thorough explanation of the productivity and wage differentials that characterises a modern and economically advanced economy as is Lombardy. This explanation is relevant for policy aimed at stimulating local and regional growth, on the whole, emphasising, in particular, the role of industry and firms’ characteristics in affecting productivity.
The gap between rural and high-density areas is, therefore, effective and hence policy aimed at closing this gap should be taken into consideration, if the economy-wide growth pattern is the more general goal.
References
Angrist J.D., Pischke J. (2008), “Mostly Harmless Econometrics: An Empiricist’s Companion”, Princeton, Princeton University Press.
Arnaldi, S., C. Baldi, R. Filippello, L. Mastrantonio, S. Pacini, P. Sassaroli and F. Tartamella. (2016) The labour cost variables in the building of the “Frame SBS”. Rivista di statistica ufficiale, 18(1), 47-69.
Ahrend, R., E. Farchy, I. Kaplanis and A. Lembcke. (2014) What makes cities more productive? Evidence on the role of urban governance from five OECD countries. OECD Regional Development Working Papers, No. 2014/05, OECD Publishing, Paris, https://doi.org/10.1787/5jz432cf2d8p-en.
Andersson, M. and H. Lööf. (2011) Agglomeration and productivity: evidence from firm-level data. The annals of regional science, 46(3), 601-620.
Baldwin, J.R., D. Beckstead, W. Mark Brown and D.L. Rigby. (2008) Agglomeration and the geography of localization economies in Canada. Regional Studies, 42(1), 117-132.
Bartoloni, E. and M. Baussola. (2019) Productivity and earnings at Firms’ Local Unit Level: the case of Lombardy urban and non-urban agglomerations. Dipartimento di Scienze Economiche e Sociali, 144, 3-51.
Beaudry, C. and A. Schiffauerova. (2009) Who's right, Marshall or Jacobs? The localization versus urbanization debate. Research policy, 38(2), 318-337.
Behrens Kristian, Duranton Gilles and Frédéric Robert-Nicoud (2014), “Productive Cities: Sorting, Selection and Agglomeration”, Journal of Political Economy, 122(3), 507-553.
Combes, P. and G. Duranton. (2006) Labour pooling, labour poaching, and spatial clustering. Regional Science and Urban Economics, 36(1), 1-28.
Combes Pierre-Philippe, Duranton Gilles, Gobillon Laurent, Puga Diego and Sébastien Roux (2012), “The Productivity Advantages of Large Cities: Distinguishing Agglomeration from Firm Selection”, Econometrica, 80(6), 2543-2594.
Combes Pierre-Philippe, Laurent Gobillon (2015), “The Empirics of Agglomeration Economies”, in Duranton Gilles, Vernon Henderson and Will Strange (Eds.) “Handbook of Urban and Regional Economics” vol.5, Elsevier.
Deleidi, M., W.P. Meloni, L. Salvati and F. Tosi. (2020) Exploring the Determinants of Productivity Growth in Italian Regions: a Kaldorian Perspective, Working Papers 0051, ASTRIL - Associazione Studi e Ricerche Interdisciplinari sul Lavoro.
Dell'Aringa, C. and L. Pagani. (2005) Regional wage differentials and collective bargaining in Italy. Rivista Internazionale di Scienze Sociali, 267-287.
Di Giacinto Valter, Matteo Gomellini, Giacinto Micucci and Marcello Pagnini (2014), “Mapping local productivity advantages in Italy: industrial districts, cities or both?”, Journal of Economic Geography, 14, 365-394.
Duranton, G. and D. Puga. (2004). Micro-foundations of urban agglomeration economies. In Anonymous Handbook of regional and urban economics: Elsevier, 2063-2117.
Henderson, J.V. (2003) Marshall's scale economies. Journal of Urban Economics, 53(1), 1-28.
Henderson, J.V. (1974) The sizes and types of cities. The American Economic Review, 64(4), 640-656.
ISTAT (2016) Jennen, M. and P. Verwijmeren. (2010) Agglomeration effects and financial performance. Urban Studies, 47(12), 2683-2703.
Kampelmann, S., F. Rycx, Y. Saks and I. Tojerow. (2018) Does education raise productivity and wages equally? The moderating role of age and gender. IZA Journal of Labor Economics, 7(1), 1.
Konings, J. and L. Marcolin. (2014) Do wages reflect labor productivity? The case of Belgian regions. IZA Journal of European Labor Studies, 3(1), 11.
Martin, P., T. Mayer and F. Mayneris. (2011) Spatial concentration and plant-level productivity in France. Journal of Urban Economics, 69(2), 182-195.
Melo Patricia, Daniel Graham and Robert Noland (2009), “A Meta-Analysis of Estimates of Urban Agglomeration Economies”, Regional Science and Urban Economics, 39(3), 332-342.
OECD. (2018) OECD Economic Outlook, Volume 2018 Issue 2, 51-65.
Pench, L.R., P. Sestito and E. Frontini. (1999). Some Unpleasant Arithmetics of Regional Unemployment in the EU: Are there any lessons for EMU?: European Commission, Directorate-General for Economic and Financial Affairs.
Rizov, M. and P.P. Walsh. (2011) Is there a rural–urban divide? Location and productivity of UK manufacturing. Regional Studies, 45(5), 641-656.
Stavropoulos, S. and D. Skuras. (2016) Firm profitability and agglomeration economies: An elusive relationship. Tijdschrift voor economische en sociale geografie, 107(1), 66-80.
Stock James and Motohiro Yogo (2005), “Testing for Weak Instruments in Linear IV regression”, in D.W.K. Andrews (Ed.) “Identification and Inference for Econometric Models”, ch. 5, 80-108, New York, Cambridge University Press.
Uguccioni, J. and A. Sharpe. (2016). Decomposing the Productivity-Wage Nexus in Selected OECD Countries, 1986-2013: Centre for the Study of Living Standards.
Webber, D., N. Curry and A. Plumridge. (2009) Business productivity and area productivity in rural England. Regional Studies, 43(5), 661-675.
Zheng, X. (2001) Determinants of agglomeration economies and diseconomies: empirical evidence from Tokyo. Socio-economic planning sciences, 35(2), 131-144.
Finito di stampare GieGi srl - Triuggio (MB)
Urban non-urban agglomeration divide:
is there a gap in productivity and wages?
Eleonora Bartoloni, Andrea Marino, Maurizio Baussola, Davide Romaniello
Quaderno n. 148/novembre 2020