2020-11-16T16:18:19Z
Acceptance in OA@INAF
Astrochemical evolution along star formation: overview of the IRAM Large Program
ASAI
Title
Lefloch, Bertrand; Bachiller, R.; Ceccarelli, C.; Cernicharo, J.; CODELLA,
CLAUDIO; et al.
Authors
10.1093/mnras/sty937
DOI
http://hdl.handle.net/20.500.12386/28364
Handle
MONTHLY NOTICES OF THE ROYAL ASTRONOMICAL SOCIETY
Journal
477
Number
arXiv:1803.10292v1 [astro-ph.GA] 27 Mar 2018
Astrochemical evolution along star formation: Overview of
the IRAM Large Program ASAI
Bertrand Lefloch
1,10⋆, R. Bachiller
2, C. Ceccarelli
1, J. Cernicharo
3, C. Codella
4,
A. Fuente
2, C. Kahane
1, A. L´
opez-Sepulcre
6,1, M. Tafalla
2, C. Vastel
7, E. Caux
7,
M. Gonz´
alez-Garc´ıa
2,3, E. Bianchi
4,5, A. G´
omez-Ruiz
8,4, J. Holdship
9, E. Mendoza
10,
J. Ospina-Zamudio
1, L. Podio
4, D. Qu´
enard
9, E. Roueff
11, N. Sakai
12, S. Viti
9,
S. Yamamoto
13, K. Yoshida
13, C. Favre
4, T. Monfredini
14, H.M. Quiti´
an-Lara
14,
N. Marcelino
3, H.M. Boechat-Roberty
14, S. Cabrit
151CNRS, IPAG, Univ. Grenoble Alpes, F-38000 Grenoble, France
2IGN Observatorio Astron´omico Nacional, Apartado 1143, 28800 Alcal´a de Henares, Spain
3Group of Molecular Astrophysics, ICMM, CSIC, C/Sor Juana In´es de La Cruz N3, E-28049, Madrid, Spain 4INAF, Osservatorio Astrofisico di Arcetri, Largo Enrico Fermi 5, I-50125 Firenze, Italy
5Universit`a degli Studi di Firenze, Dipartimento di Fisica e Astronomia, Via G. Sansone 1, I-50019 Sesto Fiorentino, Italy 6IRAM, 300 rue de la Piscine, 38406 Saint-Martin d’ H`eres, France
7Universit´e de Toulouse, UPS-OMP, IRAP, Toulouse, France
8CONACYT-Instituto Nacional de Astrof´ısica, Optica y Electr´onica, Luis E. Erro 1, 72840 Tonantzintla, Puebla, M´exico 9Department of Physics and Astronomy, UCL, Gower St., London, WC1E 6BT, UK
10IAG, Universidade de S˜ao Paulo, Cidade Universit´aria, SP 05508-090, Brazil
11Sorbonne Universit´e, Observatoire de Paris, Universit´e PSL, CNRS, LERMA, F-92190, Meudon, France 12The Institute of Physical and Chemical Research (RIKEN), Wako, Saitama 351-0198, Japan
13Department of Physics, University of Tokyo, Bunkyo-ku, Tokyo 113-0033, Japan
14Observatorio do Valongo, Universidade Federal do Rio de Janeiro, Rio de Janeiro, 20080-090, Brasil 15Sorbonne Universit´e, Observatoire de Paris, Universit´e PSL, CNRS, LERMA, F-75014 Paris, France
Accepted 2018 March 22. Received 2018 March 9; in original form 2017 November 4
ABSTRACT
Evidence is mounting that the small bodies of our Solar System, such as comets and asteroids, have at least partially inherited their chemical composition from the first phases of the Solar System formation. It then appears that the molecular complexity of these small bodies is most likely related to the earliest stages of star formation. It is therefore important to characterize and to understand how the chemical evolution changes with solar-type protostellar evolution. We present here the Large Program ”Astrochemical Surveys At IRAM” (ASAI). Its goal is to carry out unbiased millimeter line surveys between 80 and 272 GHz of a sample of ten template sources, which fully cover the first stages of the formation process of solar-type stars, from prestellar cores to the late protostellar phase.
In this article, we present an overview of the surveys and results obtained from the analysis of the 3 mm band observations. The number of detected main isotopic species barely varies with the evolutionary stage and is found to be very similar to that of massive star-forming regions. The molecular content in O- and C- bearing species allows us to define two chemical classes of envelopes, whose composition is dominated by either a) a rich content in O-rich complex organic molecules, associated with hot corino sources, or b) a rich content in hydrocarbons, typical of Warm Carbon Chain Chemistry sources. Overall, a high chemical richness is found to be present already in the initial phases of solar-type star formation.
Key words: physical data and processes: astrochemistry – ISM: jets and outflows-molecules-abundances – Stars:formation
⋆cE-mail: [email protected]
1 INTRODUCTION
Understanding ”our chemical origins”, i.e. the evolu-tion of matter during the long process that brought it from prestellar cores, to protostars, protoplanetary disks, and eventually to the bodies of the Solar System, is one of the most active topics in contemporary Astrophysics (Caselli & Ceccarelli 2012).
Once the gravitational collapse is underway, the form-ing star is at the center of a thick envelope, from where it accretes matter. Class 0 sources represent the first stages of the collapse (e.g. Andr´e et al. 1993). The innermost envelope regions, with a size of a few 100 AU, known as hot corinos, are heated by the radiation emitted by the central object and the ices are sublimated. The molecules forming the ices are thus liberated and injected into the gas phase, where they may undergo further reactions. They share similarities with hot cores but are not just scaled-down versions of them (Bottinelli et al. 2007). Hot corinos are similar in size and composition to the nebula precursor of the Solar System (see e.g. Jaber et al. 2014), so that their study can be considered as an archeological study of our Solar System.
Only a handful of hot corinos have been identified so far (IRAS16293-2422: Cazaux et al. 2003; IRAS2, IRAS4B: Bot-tinelli et al. 2007; IRAS4A: BotBot-tinelli et al. 2004b, Taquet et al. 2015; HH212: Codella et al. 2016; L483: Oya et al. 2017; B335: Imai et al. 2016). Their nature as well as their molec-ular composition remain unclear: IRAS16293 is the only hot corino investigated in detail until now (Caux et al. 2011; Jaber et al. 2014; Jørgensen et al. 2012, 2016), and may not be representative of the whole Class 0. As a matter of fact, Sakai et al. (2008) have discovered a different type of chemically distinct Class 0 protostars, the so-called Warm Carbon Chain Chemistry (WCCC) sources, that are C-chain enriched, but -unlike hot corinos- poor in complex organic molecules (COMs). The actual composition of all these pro-tostars, their similarities and differences, and their origin (that could be related to the infall dynamics) remain yet to be established. The protostellar phase plays a major role in building up the molecular complexity, as highlighted by the recent detection of pre-biotic molecules, like e.g. glycolalde-hyde (Jørgensen et al. 2012) and formamide (Kahane et al. 2013) around the solar-type protostar IRAS 16293-2422.
Evidence is mounting that the small bodies of our Solar System, such as comets and asteroids, have at least partially inherited their chemical composition from the first phases of the Solar System formation. For example, the molecular abundances in comet Hale-Bopp were found to be similar to those in the protostellar outflow L1157 (Bockel´ee-Morvan et al. 2000) , and the HDO/H2O ratio measured in the ice of
comets is, within a factor of two, equal to the ocean value (Mumma & Charnley, 2011; Ceccarelli et al. 2014). More-over, the large deuteration of amino acids in meteorites sug-gests that at least a fraction of them were formed during the first phases of the Solar System (Pizzarello & Huang 2005). Thanks to the recent spectacular progress of radioastro-nomical and far infrared observatories, detailed observations of systems at different evolutionary stages have become pos-sible, and these can shed light on the most decisive chemi-cal processes determining the evolution. However, despite a wealth of fragmentary studies in the literature, the
charac-terization and understanding of the chemical evolution along solar-type protostellar evolution are far from being achieved. Systematic spectral line surveys constitute the most powerful diagnostic tool to carry out a comprehensive study of the chemical evolution of star-forming regions. In gen-eral terms, as transitions with different upper energy levels and Einstein coefficients are excited at different tempera-tures and densities, line surveys permit to efficiently probe different regions along the line of sight (see e.g. Tercero et al. 2010; Caux et al. 2011). Star-forming regions are particularly complex because of their strong spatial chemical differenti-ation and because different lines from the same species are excited under different conditions (temperature, density, ve-locity field, etc), with sometimes complex kinematics, where infall and outflow motions are simultaneously present.
Unbiased spectral surveys of low-mass, solar-type ob-jects have been carried out so far only towards TMC1 and Barnard 1 (Marcelino et al. 2009; Cernicharo et al. 2012), IRAS16293 (Blake et al. 1994; Caux et al. 2011; Jørgensen et al. 2016), IRAS4 (Blake et al. 1995), L1527 at 3 mm only (Takano et al. 2011) and R CrA IRS7B at 0.8mm (Watan-abe et al. 2012). Now, the new capabilities of the IRAM 30m telescope have made it possible to take a major step forward in the investigation of molecular complexity along with star formation, by observing with unprecedented sensitivity the emission of molecular rotational transitions in the millime-ter domain, from 80 GHz to 272 GHz, in a greatly reduced amount of time.
With all this in mind, we have undertaken a Large Pro-gram called ASAI1 (Astrochemical Studies At IRAM) to
characterize and to understand the chemical evolution along solar-type protostellar evolution. To do so, we have used the IRAM 30m telescope to carry out unbiased millimeter line surveys of a sample of template sources, which cover the full formation process of solar-type stars, from prestellar cores to protoplanetary disks. The objective of this paper is to describe the general characteristics of the survey: observa-tional strategy, methods of the data analysis and features of the target, together with some overall and first results (some of them already published in dedicated papers) illustrating the richness of the obtained data.
In this presentation article of the project, we have fo-cused on the molecular content of the 3 mm band (80–116 GHz). It is the only band which was observed towards all the template sources, with the exception of AB Aur. The sys-tematic approach of our Large Program allows us to draw some first conclusions on the molecular richness of sources as a function of their evolutionary status. The detailed ASAI data analysis including the bands at 2 mm and 1.3 mm is still under way. Further results on the different sources, transver-sal studies, as well as a full analysis of the survey will be presented in forthcoming papers.
2 THE SOURCE SAMPLE
We have selected a sample of ten template sources il-lustrating the different chemical stages a solar-type star un-dergoes during its formation process, presented in Table 1.
1 http://www.oan.es/asai/
TMC1 is a quiescent dense ridge in Heiles Cloud 2 at d ≃140 pc (Cernicharo & Gu´elin 1987) in the Taurus lar cloud complex. It is characterized by a very rich molecu-lar spectrum and strong chemical differences along the ridge, and is considered as an ideal source to study the chem-istry of dark clouds (e.g. Pratap et al. 1997, Liszt & Ziurys 2012). The position observed here, ’the cyanopolyyne peak’, is particularly rich in carbon chains, including radicals and cyanopolyynes, and it was previously surveyed in the 3-mm band with the IRAM 30m radiotelescope (see Marcelino et al. 2007, 2009; Cernicharo et al., 2012). Among the molecules detected in these previous surveys with the 30m IRAM tele-scope it is worth noting the completely unexpected saturated propene molecule CH3CHCH2 (Marcelino et al., 2007).
L1544 is a starless core in the Taurus molecular cloud complex (d ≃ 140 pc; Cernicharo & Gu´elin 1987) on the verge of the gravitational collapse (Caselli et al. 2012, and references within). It is considered the prototype of prestel-lar cores. Its central high density (2 × 106cm−3
) and very low temperature (∼7 K) generate a chemistry typical of the interiors of dark clouds in which CO is depleted and the deu-terium fractionation is high, although differentiated chemi-cal processes can take place in the external layers (Caselli et al. 1999; Vastel et al. 2006, 2014, 2015b, 2016).
Barnard 1 is a dense core in the Perseus molecular complex (Bachiller & Cernicharo 1984, 1986) at d≃ 230 pc (Hirano & Liu, 2014). It contains several active star-forming sites of which the position studied here, B1b, is one of the most interesting because of its rich molecular spectrum (Bachiller et al. 1990a; Cernicharo et al. 2012; Daniel et al. 2013). B1b was previously surveyed in the 3 mm band with the IRAM 30m radiotelescope by Marcelino et al. (2009) and Cernicharo et al. (2012). It consists of two objects B1-bN and B1-bS, separated by approximately 18′′(Pezzuto et
al. 2012; Gerin et al. 2015), which have been proposed as candidates for the first hydrostatic core (FHSC) stage based on the properties of their spectral energy distribution and their outflows (Gerin et al. 2015; Fuente et al. 2017). Both sources have a low luminosity of 0.28 L⊙ and 0.49 L⊙,
re-spectively (Pezzuto et al. 2012). The targeted position lies approximately halfway between B1-bN and B1-bS (see Ta-ble 1). We have reported in TaTa-ble 1 the total luminosity of the system (0.77 L⊙). Several molecular species have been
detected, some of them of high importance for astrochem-istry, such as NH3D+(Cernicharo et al., 2013), CH3O
(Cer-nicharo et al., 2012) and HCNO, the high energy isomer of isocyanic acid (Marcelino et al. 2009). The source exhibits a large deuteration, as evidenced by the detection of multi-ply deuterated species such as D2CS (Marcelino et al. 2005),
ND2H (Roueff et al. 2005) and ND3(Lis et al. 2002). Also,
a very high abundance in sulfur compounds was reported by Marcelino et al. (2005) and Fuente et al. (2016).
L1527 is a dark cloud in the Taurus molecular com-plex (d ≃ 140 pc) containing IRAS04368+2557, a proto-star with a luminosity of 2.75 L⊙ (Tobin et al. 2013).
Re-cently, Robitaille et al. (2007) and Tobin et al. (2013) pro-posed that L1527 probably lies at an intermediate stage Class 0/I, more evolved than previously thought. The po-sition observed here is the nominal popo-sition of the protostar from which emerges a highly collimated molecular outflow (Hogerheijde et al. 1998). The complex kinematical struc-ture of the region around the protostar has been recently
investigated with ALMA by Oya et al. (2015) and Sakai et al. (2017). This source is considered as a prototypical warm-carbon-chain-chemistry (WCCC) source (Sakai et al. 2008, 2010; Sakai & Yamamoto 2013).
NGC1333-IRAS4A is a binary Class 0 source located in the Perseus molecular complex at d ≃ 260 pc (Schlafly et al. 2014). The two components, IRAS4A1 and IRAS4A2, have a separation of about 1.8′′
(∼420 AU) and a total lu-minosity of 9.1 L⊙(Karska et al. 2013). The IRAS4A system
is associated with a spectacular large-scale (a few arcmin-utes) bipolar molecular outflow (e.g. Blake et al. 1995; Choi 2001, 2005; Yildiz et al. 2012; Santangelo et al. 2014). High-angular resolution observations by Santangelo et al. (2015) have disentangled two distinct molecular jets powered by each of the two components. IRAS4A was the subject of a spectral line survey between 200 and 400 GHz with the Caltech Submm Observatory (CSO) and the James Clerck Maxwell Telescope (JCMT) by Blake et al. (1995). The weakness of the lines made it impossible to obtain a com-plete coverage of the spectral windows. Thanks to more re-cent, sensitive observations with the IRAM 30m telescope, IRAS4A was identified as a hot corino protostar, the sec-ond one after IRAS16293-2422 (Bottinelli et al. 2007). San-tangelo et al. (2015) and L´opez-Sepulcre et al. (2017) con-firmed that only source IRAS4A2 is a hot corino protostar, in agreement with the previous detections of dimethyl ether (CH3OCH3), ethyl cyanide (C2H5CN) and water (H182 O)
by Persson et al. (2012); also, de Simone et al. (2017) re-ported the detection of glycolaldehyde (CH2OHCHO).
In-terestingly, no COM emission is detected towards IRAS4A1. L1157mm (IRAS 20386+6751) is the Class 0 source driving the powerful L1157 molecular outflow (Bachiller et al. 1993, 2001; Gueth et al. 1996; Tafalla et al. 2015) in a quite isolated dark cloud in Cepheus at d≃ 250 pc (Looney et al. 2007). The protostar of ∼ 3 L⊙ is surrounded by a
circumstellar disk and a protostellar envelope embedded in filamentary cloud (Gueth et al. 2003; Looney et al. 2007).
SVS13A is part of the multiple system NGC1333-SVS13 (d≃ 260 pc; Schlafly et al. 2014), where three mil-limetre sources, called A, B, and C, have been identified by interferometric observations (Bachiller et al. 1998; Looney et al. 2007). The angular distance between A and B is 15′′
, while C is 20′′away from A. The luminosity of SVS13-A has
been estimated to be 34 L⊙ (Tobin et al. 2016). SVS13-A
itself is a close (70AU) binary (VLA4A, VLA4B)in the ra-dio cm (Tobin et al 2016). Although SVS13-A is still deeply embedded in a large-scale (∼ 6000 AU; e.g. Lefloch et al. 1998a) envelope, its extended (> 0.07 pc) outflow, associ-ated with the HH7-11 chain (e.g. Lefloch et al. 1998b, and references therein), and its low Lsubmm/Lbol ratio (∼ 0.8%)
lead to the classification as a Class I source (e.g. Chen et al. 2009 and references therein).
AB Aur is one of the best-studied Herbig Ae stars that host a prototypical Herbig Ae disk. Located at d ≃ 145 pc in Taurus, the star has a spectral type A0-A1, a mass ∼ 2.4 M⊙, and a Tef f ≃ 9500 K (van den Ancker et al.
1998). The disk around AB Aur shows a complex struc-ture: it exhibits an asymmetric dust ring at R= 70-140 AU from the star (Pi´etu et al. 2005, Tang et al. 2012), outer spiral-arm features traced by the CO and its isotopologues emission, and inner spiral arms connecting the dusty ring with the star that have been recently imaged by Tang et al.
c
(2017). The chemical structure of the disk has been studied at high resolution in selected molecular lines by Schreyer et al. (2008), Fuente et al. (2010), Guilloteau et al. (2013) and Pacheco-V´asquez et al. (2015, 2016).
L1157-B1 is a bright hot-spot in the southern blue-shifted lobe of the powerful L1157 outflow (d≃ 250 pc; Looney et al. 2007). This outflow is considered the archetype of the so-called chemically active outflows (Bachiller & P´erez-Guti´errez 1997, Bachiller et al. 2001, Burkhardt et al. 2016). The richness and intensity of the molecular spec-trum from L1157-B1 has made this position a testbed for shock-chemistry models and a favoured target for molecular surveys (e.g. Gusdorf et al. 2008; Codella et al. 2010, 2015; Lefloch et al. 2010, 2012; Yamaguchi et al. 2012; Busquet et al. 2014; G´omez-Ruiz et al. 2015; Holdship et al. 2016). In particular, the emission of the shock region in the 3 mm band was observed recently in an unbiased manner with the 45m telescope of the Nobeyama Radio Observatory (NRO) by Yamaguchi et al. (2012) and Sugimura et al. (2011).
L1448-R2 is a bright spot in the southern redshifted lobe of the bipolar molecular outflow L1448 (Bachiller et al. 1990b) which is emanating from a ∼ 11 L⊙Class 0 protostar
in the Perseus molecular complex at d≃ 235 pc. High angu-lar resolution observations in SiO lines (Dutrey et al. 1997) were found in agreement with a structure of incomplete and fragmented bow-shocks caused by discrete episodes of ejec-tion from the central star (’molecular bullets’). Strong H2O
and high-J CO line emission was detected toward this and other L1448 bright spots by Nisini et al. (2000, 2013), San-tangelo et al. (2012) and Gomez-Ruiz et al. (2013) indicat-ing the presence of very dense (∼ 106cm−3) molecular gas
at temperatures in excess of 500 K.
As shown in this short presentation of the different sources of the sample, these objects have all been the subject of previous molecular gas studies at millimeter wavelengths. Maps of the molecular emission and the velocity field ob-tained with both millimeter single-dish telescopes and inter-ferometers, are available for several molecular species and were used to model the origin of their emission.
3 OBSERVATIONS
Spectral line surveys of the full source sample were car-ried out with the IRAM 30m telescope over six semesters from September 2012 to March 2015, using the broad-band EMIR receivers E090, E150 and E230, connected to the Fast Fourier Transform Spectrometers (FTS) either in the high (50 kHz) or low (200 kHz) spectral resolution mode. The observations were carried out in Wobbler Switching Mode, with a throw of 3′
, in order to ensure a flat baseline across the spectral bandwidth observed. The instrumental setup was decided according to the sources:
• TMC1: full coverage of the 3 mm band with a 50 kHz spectral resolution was obtained previously by another team (see e.g. Marcelino et al. 2007, 2009) and will be published elsewhere (Cernicharo in prep.) Only the 2 mm band was observed. The lower-frequency range 130-150 GHz was ob-served at 50 kHz spectral resolution, and the high-frequency band 150-170 GHz was observed with the FTS in its 200 kHz resolution mode.
• L1544: only the band 72 to 115 GHz was observed, using the FTS in its 50 kHz resolution mode.
• Protostars and Outflow Shocks (B1b, L1527, IRAS4A, L1157mm, SVS13A, L1157-B1, L1448-R2): the 3 mm (80–116 GHz) and 2 mm (126–170 GHz) bands were observed simultaneously. The 1.3 mm (200-272 GHz) band was covered observing both LSB and USB simultaneously using the FTS in its 200 kHz resolution mode. Complemen-tary observations of the band 72–80 GHz were obtained in January 2016 for L1527, IRAS4A, L1157mm, SVS13A and L1157-B1.
• AB Aur: the spectral line density is so low that it was decided to perform very deep integrations of a few spectral bands of 4–8 GHz only, instead of covering the full spectral windows. Observations and results are presented in Pacheco-V´asquez et al. (2015).
Whereas E090 and E230 are 2SB receivers, most of the observations in the 2 mm band were carried out with the ”old” E150 receiver, providing an effective instantaneous bandwidth of 4 GHz in double polarization H and V. A 2SB receiver at 2 mm was installed at the IRAM 30m telescope in Summer 2014, allowing full coverage of the band 130–150 GHz for TMC1. Observations were carried out with very good to excellent, stable weather conditions. The half power beamwidth of the IRAM 30m telescope (HPBW) is de-scribed with a good accuracy by the HPBW(′′
)= 2460/Fre-quency(GHz). The typical beamwidth of the ASAI observa-tions lies therefore in the range 21′′
– 34′′ , 14′′ – 19′′ , 9′′ – 12′′at 3mm, 2mm and 1.3mm, respectively.
Pointing was carefully checked every hour on bright nearby continuum sources: NGC7538 (B1, L1157-mm), 0316+413 and 0333+321 (B1, IRAS4A, SVS13A), 0439+360 (TMC1, L1527, L1448-R2). Pointing corrections were always less than 3′′. Focus corrections were done at the
beginning of each observing session. They were repeated ev-ery 6 hours, or when relevant temperature changes occurred (e.g. after sunrise or sunset). Focus corrections were always below 1 mm.
Image band rejection of the EMIR receivers usually ranges between -10 and -20 dB, depending on the frequency (see e.g. IRAM report by D. Maier, 2014). The sensitivity of the ASAI observations is so high that line contamination from the image band cannot be ignored. In order to per-mit easy identification of lines from the image band in the spectrum, it was decided to regularly shift the frequency of the Local Oscillator (LO) by a fixed amount of 50 MHz. Spurious features in the spectral bands were identified and subsequently corrected for, in close collaboration with the IRAM receiver engineers group (see e.g. IRAM report by Kramer et al. 2014 for more details).
Contamination by the nearby reference position was ob-served towards IRAS4A, SVS13A, L1448-R2 and L1527 for bright molecular lines like CO,13CO, HCO+, HCN, for
in-stance. The corresponding spectral settings were re-observed in position switching mode with a ”clean” reference position, checked to be free of emission.
Data reduction was performed using the GILDAS/CLASS software2. A simple flat baseline was
first subtracted to each spectra and spectra with very
2 http://www.iram.fr/IRAMFR/GILDAS/
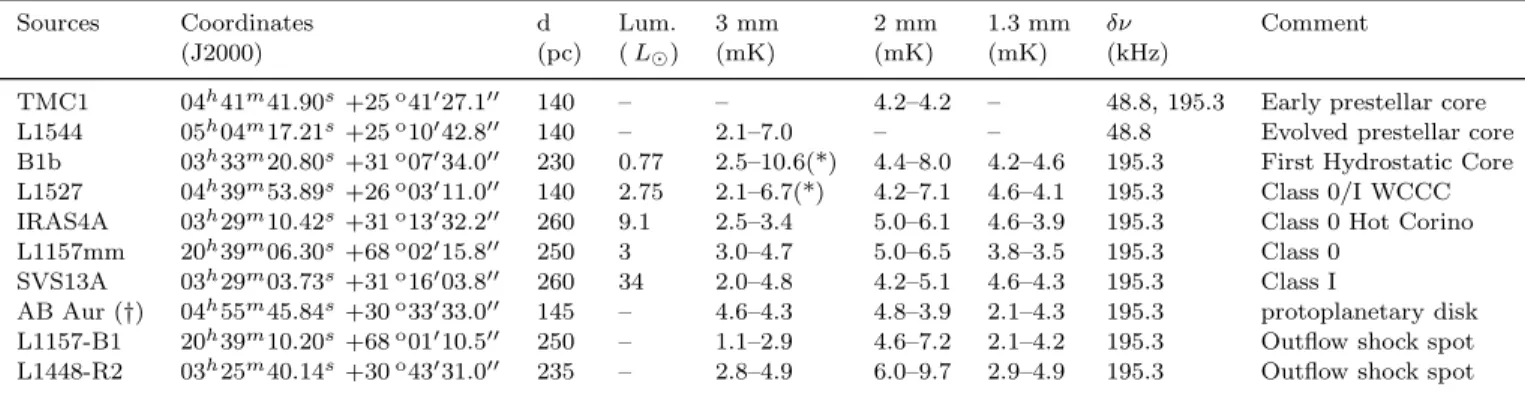
Table 1.Source and observational characteristics. The first 4 columnes refer to the source name, coordinates, distance and luminosity. The following columns report the observed spectral windows and the range of rms noise achieved in a 1 km s−1channel for each spectral
window. The rms values (in T∗
A) are measured in the range 86–87 GHz and 113–114 GHz at 3 mm, 132-133 GHz and 169–170 GHz at 2
mm, 220-221 and 260-261 GHz at 1 mm.
Sources Coordinates d Lum. 3 mm 2 mm 1.3 mm δν Comment
(J2000) (pc) ( L⊙) (mK) (mK) (mK) (kHz)
TMC1 04h41m41.90s+25o41′27.1′′ 140 – – 4.2–4.2 – 48.8, 195.3 Early prestellar core
L1544 05h04m17.21s+25o10′42.8′′ 140 – 2.1–7.0 – – 48.8 Evolved prestellar core
B1b 03h33m20.80s+31o07′34.0′′ 230 0.77 2.5–10.6(*) 4.4–8.0 4.2–4.6 195.3 First Hydrostatic Core
L1527 04h39m53.89s+26o03′11.0′′ 140 2.75 2.1–6.7(*) 4.2–7.1 4.6–4.1 195.3 Class 0/I WCCC
IRAS4A 03h29m10.42s+31o13′32.2′′ 260 9.1 2.5–3.4 5.0–6.1 4.6–3.9 195.3 Class 0 Hot Corino
L1157mm 20h39m06.30s+68o02′15.8′′ 250 3 3.0–4.7 5.0–6.5 3.8–3.5 195.3 Class 0
SVS13A 03h29m03.73s+31o16′03.8′′ 260 34 2.0–4.8 4.2–5.1 4.6–4.3 195.3 Class I
AB Aur (†) 04h55m45.84s+30o33′33.0′′ 145 – 4.6–4.3 4.8–3.9 2.1–4.3 195.3 protoplanetary disk
L1157-B1 20h39m10.20s+68o01′10.5′′ 250 – 1.1–2.9 4.6–7.2 2.1–4.2 195.3 Outflow shock spot
L1448-R2 03h25m40.14s+30o43′31.0′′ 235 – 2.8–4.9 6.0–9.7 2.9–4.9 195.3 Outflow shock spot
(*)3 mm coverage until 112GHz only. rms is measured in the range 110-111 GHz. (†) uncomplete coverage for AB Aur: 85–96 GHz, 134–145 GHz, 200–208 GHz, 216.4–228 GHz, 232.6–240GHz, 248.3–256.2 GHz, 264.2–272 GHz
high noise were discarded. From comparing every scan with their (50 MHz LO) frequency shifted counterpart, spurious signals from the image band could be identified and removed. The resulting scans were then averaged in order to produce the final spectral bands. In the three millimeter bands, the final rms lies in the range 2mK and 5mK per interval of 1 km s−1, depending on the frequency.
For each source, the observed position, the nominal spectral resolution of the observations, and the rms achieved in the covered spectral bands are summarized in Table 1. The official ASAI repositories are at OAN3and IRAM4. The
ASAI database provides fully reduced, calibrated spectra. The achieved rms of the ASAI data is similar to that of the TIMASS survey of IRAS16293-2422 (Caux et al. 2011). As mentionned in Sect. 2, two sources of our sample have been previously surveyed in the same spectral range: IRAS4A and L1157-B1. In the first case, the JCMT-CSO survey by Blake et al. (1995) yielded a typical rms of about 100 mK. In the second case, the NRO 45m survey by Ya-maguchi (2012) and Sugimura et al. (2011), yielded an rms of 4–10mK per channel of 1 MHz. By comparison, the rms of the ASAI is ≈ 1 − 3mK per element of resolution of 0.3 MHz.
4 OVERALL RESULTS
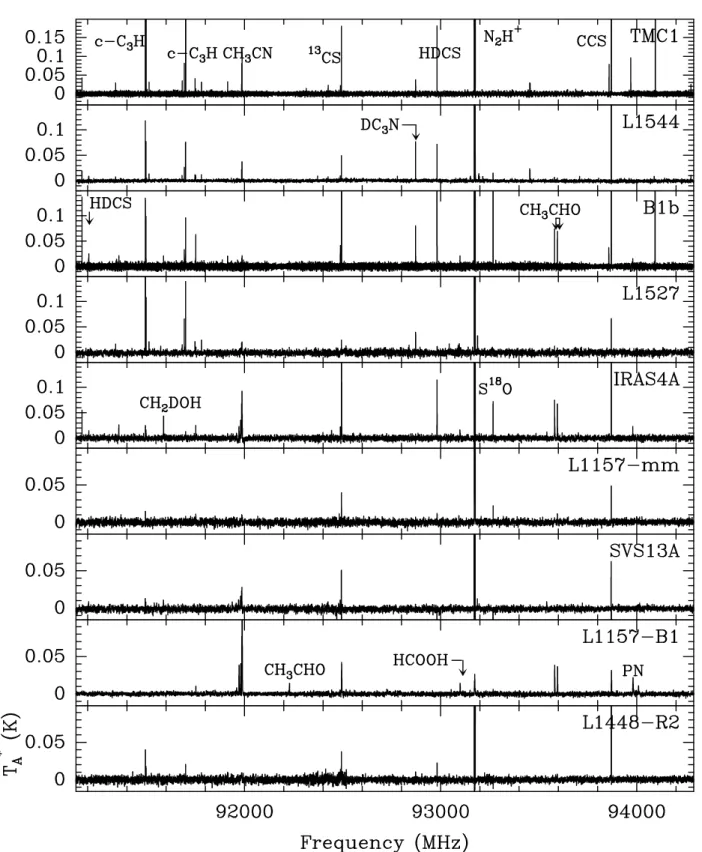
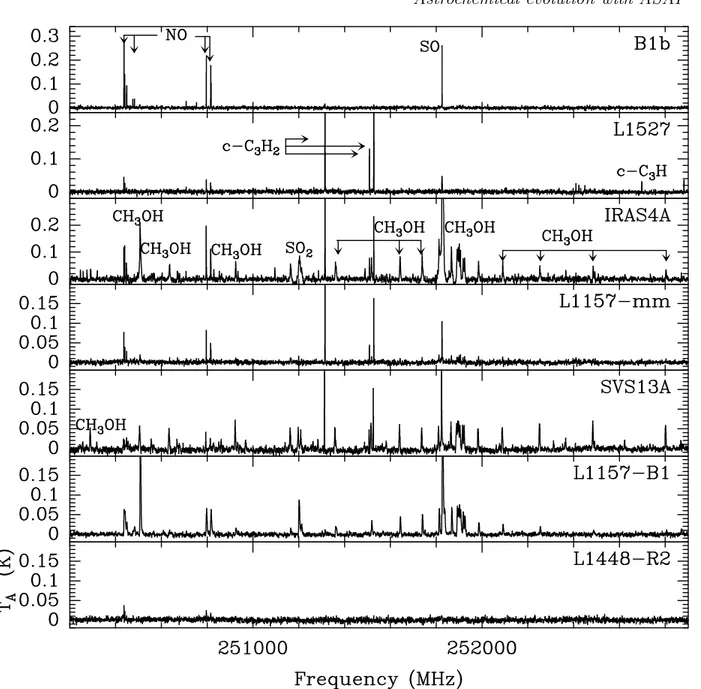
The spectra of the different targets exhibit very sig-nificant differences, reflecting the evolutionary stage and the physical conditions of the different sources. This is il-lustrated in Figs.1–3, which display the emission in the spectral bands 91.1–94.5 GHz (Fig. 1), 144.1–147.2 GHz (Fig. 2), 250.2–252.9 GHz (Fig. 3). An example is provided by the emission of the cyano methyl radical (CH2CN) lines
at 100600 MHz (se Fig. A1). Bright CH2CN emission is
detected mainly towards the early sources (prestellar cores TMC1 and L1544, first hydrostatic core candidate B1b) and
3 http://www.oan.es/asai
4 http://www.iram.fr/ILPA/LP007/
the WCCC protostar L1527. There is a striking anticorrela-tion with the emission of methyl cyanide CH3CN, a
chem-ically related species, whose emission is extremely bright towards the more evolved and luminous sources (IRAS4A, SVS13A, L1157-B1) and faint towards the early sources. Only the low-excitation transitions of CH3CN are detected
towards the CH2CN-rich sources, and their lines are much
narrower than those of CH3CN. A detailed modelling of the
CH2CN and CH3CN emission in the ASAI sample is
cur-rently going on (Vastel in preparation).
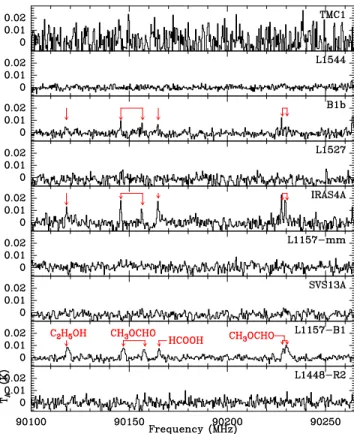
Comparison of the COM emission in the range 90100– 90258 MHz provides another interesting example of the chemical differentiation which can be observed between the sources of the sample (Fig. A2). This band was chosen as it contains several rotational transitions of ethanol (C2H5OH),
methyl formate CH3OCHO, and formic acid (HCOOH). The
signatures of COMs are absent of the PSC (TMC1 and L1544) and the WCCC sources (L1527 and L1157-mm), and SVS13A (Class I). On the contrary, they are detected with a very good SNR towards B1b, IRAS4A and L1157-B1. Linewidths increase markedly from FHSC to Class 0 and to the shock region L1157-B1. It is remarkable that such bright COM emission is detected towards the outflow shock region L1157-B1 whereas no emission is detected in the envelope of the protostar L1157-mm and the initial gas and dust chemi-cal conditions are very similar. The diversity of spectral sig-natures was also found to reflect the diversity of excitation and chemical conditions among the sample sources. This is well illustrated by the analysis of the CO line profiles de-tected towards the shock region L1157-B1 by Lefloch et al. (2012).
We used the CASSIS5software (Vastel et al. 2015a) for the line identification, using the CDMS6
(M¨uller et al. 2005) and JPL7 databases (Pickett et al. 1998). We considered all
the lines detected with an intensity higher than 3σ. We examine here how much the molecular content
dif-5 http://cassis.irap.omp.eu 6 http://www.astro.uni-koeln.de 7 http://spec.jpl.nasa.gov
c
Figure 1.Molecular line emission detected with ASAI in the spectral bands: 91100–94300 MHz. The spectral resolution is 350kHz for all sources, except for TMC1 (100 kHz). The TMC1 data were taken from Marcelino et al. (2009).
fers between sources, based on the molecular line identifica-tion in the 3 mm band.
4.1 Molecular content
We have classified the identified molecular species in ”el-emental families”: carbon, nitrogen, oxygen, sulfur, silicon, phosphorus bearing.
• The carbon family contains only hydrocarbons CxHy.
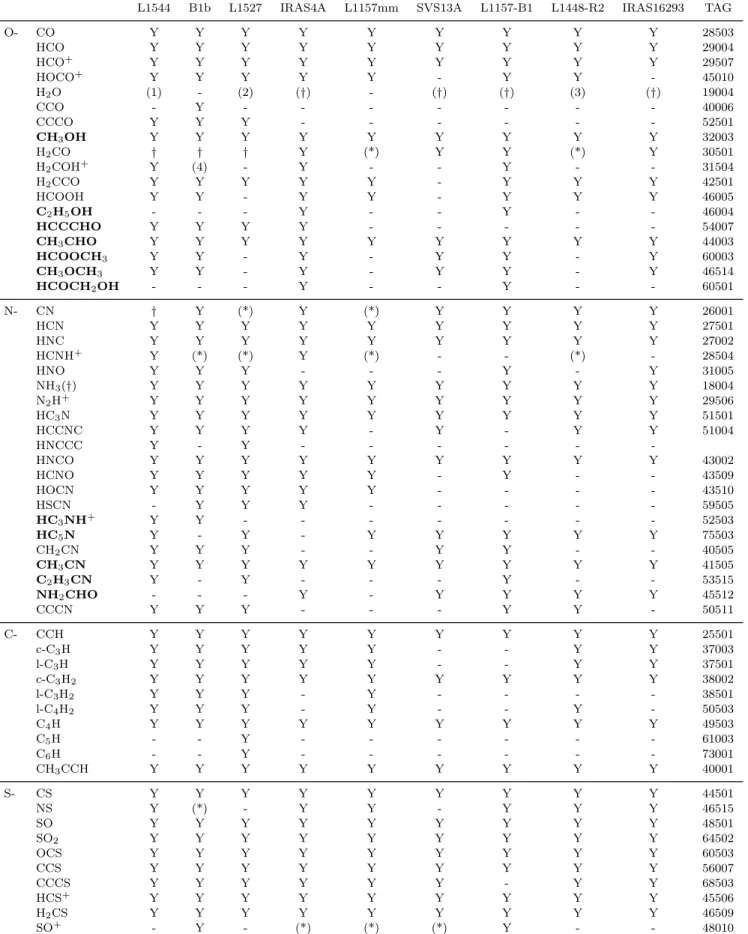
Table 2.3 mm band observations: Census of detected molecular species classified per elemental family: oxygen, nitrogen, carbon, sulfur. In a few cases marked with †, species were detected through the emission of their rare isotopologues (D,13C). O- and N-bearing COMs
are marked in boldface. For each molecular species, we indicate the associated TAG, according to the database used for identification (CDMS or JPL). In the last column, we have reported the molecular content of the IRAS16293-2422 envelope based on the TIMASS survey (Caux et al. 2011).
L1544 B1b L1527 IRAS4A L1157mm SVS13A L1157-B1 L1448-R2 IRAS16293 TAG
O- CO Y Y Y Y Y Y Y Y Y 28503 HCO Y Y Y Y Y Y Y Y Y 29004 HCO+ Y Y Y Y Y Y Y Y Y 29507 HOCO+ Y Y Y Y Y - Y Y - 45010 H2O (1) - (2) (†) - (†) (†) (3) (†) 19004 CCO - Y - - - 40006 CCCO Y Y Y - - - 52501 CH3OH Y Y Y Y Y Y Y Y Y 32003 H2CO † † † Y (*) Y Y (*) Y 30501 H2COH+ Y (4) - Y - - Y - - 31504 H2CCO Y Y Y Y Y - Y Y Y 42501 HCOOH Y Y - Y Y - Y Y Y 46005 C2H5OH - - - Y - - Y - - 46004 HCCCHO Y Y Y Y - - - 54007 CH3CHO Y Y Y Y Y Y Y Y Y 44003 HCOOCH3 Y Y - Y - Y Y - Y 60003 CH3OCH3 Y Y - Y - Y Y - Y 46514 HCOCH2OH - - - Y - - Y - - 60501 N- CN † Y (*) Y (*) Y Y Y Y 26001 HCN Y Y Y Y Y Y Y Y Y 27501 HNC Y Y Y Y Y Y Y Y Y 27002 HCNH+ Y (*) (*) Y (*) - - (*) - 28504 HNO Y Y Y - - - Y - Y 31005 NH3(†) Y Y Y Y Y Y Y Y Y 18004 N2H+ Y Y Y Y Y Y Y Y Y 29506 HC3N Y Y Y Y Y Y Y Y Y 51501 HCCNC Y Y Y Y - Y - Y Y 51004 HNCCC Y - Y - - - -HNCO Y Y Y Y Y Y Y Y Y 43002 HCNO Y Y Y Y Y - Y - - 43509 HOCN Y Y Y Y Y - - - - 43510 HSCN - Y Y Y - - - 59505 HC3NH+ Y Y - - - 52503 HC5N Y - Y - Y Y Y Y Y 75503 CH2CN Y Y Y - - Y Y - - 40505 CH3CN Y Y Y Y Y Y Y Y Y 41505 C2H3CN Y - Y - - - Y - - 53515 NH2CHO - - - Y - Y Y Y Y 45512 CCCN Y Y Y - - - Y Y - 50511 C- CCH Y Y Y Y Y Y Y Y Y 25501 c-C3H Y Y Y Y Y - - Y Y 37003 l-C3H Y Y Y Y Y - - Y Y 37501 c-C3H2 Y Y Y Y Y Y Y Y Y 38002 l-C3H2 Y Y Y - Y - - - - 38501 l-C4H2 Y Y Y - Y - - Y - 50503 C4H Y Y Y Y Y Y Y Y Y 49503 C5H - - Y - - - 61003 C6H - - Y - - - 73001 CH3CCH Y Y Y Y Y Y Y Y Y 40001 S- CS Y Y Y Y Y Y Y Y Y 44501 NS Y (*) - Y Y - Y Y Y 46515 SO Y Y Y Y Y Y Y Y Y 48501 SO2 Y Y Y Y Y Y Y Y Y 64502 OCS Y Y Y Y Y Y Y Y Y 60503 CCS Y Y Y Y Y Y Y Y Y 56007 CCCS Y Y Y Y Y Y - Y Y 68503 HCS+ Y Y Y Y Y Y Y Y Y 45506 H2CS Y Y Y Y Y Y Y Y Y 46509 SO+ - Y - (*) (*) (*) Y - - 48010 CH3SH - Y - Y - - Y - Y 48510
(1) Caselli et al. (2012) (2) Karska et al. (2013) (3) Nisini et al. (2012) (4) Fuente et al. (2016) c
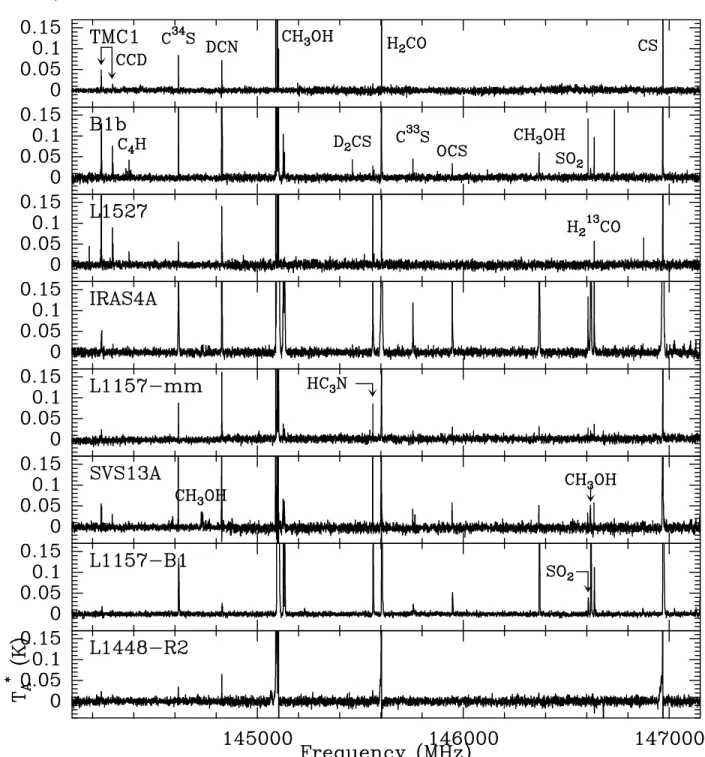
Figure 2.Molecular line emission detected with ASAI in the spectral bands 144100–147200 MHz. The spectral resolution is 500 kHz for all the sources.
Table 3. 3 mm band observations: Census of Silicon-bearing and Phosphorus-bearing molecular species detected. We have indicated the main isotopologues. For each molecular species, we indicate the associated TAG, according to the database used for identification (CDMS or JPL).
Source L1544 B1b L1527 IRAS4A L1157mm SVS13A L1157-B1 L1448-R2 IRAS16293 TAG
Si- SiO - Y - Y Y Y Y Y Y 44505
SiS - - - Y - Y 60506
P- PN - Y - Y - - Y - Y 45511
PO - - - Y - - 47507
Figure 3.Molecular line emission detected with ASAI in the spectral bands 250200–252900 MHz. The spectral resolution is 700 kHz for all the sources, except L1157-B1 (780 kHz).
• The oxygen family contains only molecules of the type CxHyOz.
• The nitrogen family contains only molecules of the type CxHyOzNt.
• The sulfur family contains any Sulfur-bearing molecules, of the type CxHyOzNtSu
• The silicon (phosphorus) family contains any Si-bearing (P-bearing) species.
These definitions are of course incomplete from a chemi-cal point of view, when considering the molecular reaction network associated with each elemental family. A simple molecule like SO is obviously involved in both the sulfur and oxygen chemical networks. The above definitions are intro-duced for the sake of the analysis which follows hereafter, as they permit identification of evolutionary trends in the gas chemical composition.
Some molecular species were identified from their rare isotopomers (D, 13C): they are indicated with a † in
Ta-ble 2. In a few cases, species missed by ASAI in the 3mm band were known to be present thanks to their signature in the 2 mm and 1.3 mm bands, like SO+ or H
2CO. These
few species are marked with an asterisk (∗) in Table 2. In the case of water, we have mentioned the detection of the main isotopologue by Herschel when the rare isotopomers HDO and H18
2 O were not detected by ASAI. This is the
case for L1544 (Caselli et al. 2012), L1527 (Karska et al. 2013) and L1448-R2 (Nisini et al. 2012). We also note that H2COH+was marginally detected towards B1b by Fuente et
al. (2016), thanks to higher sensitivity observations. These cases are rare enough that they should not significantly af-fect the statistics nor our conclusions. Of course, the differ-ence of main beam filling factors between extended sources (prestellar cores, shocks) and compact, strongly diluted hot
c
corino sources, influence to some extent the conclusions of this analysis and this study will be extended to the analy-sis of the 2 mm and 1.3 mm, for which such a bias effect is less pronounced. On the other hand, the spatial distribu-tion of the molecular emission also conveys some important information on the source chemistry.
The new generation of interferometers such as ALMA and NOEMA reveals the presence at a much smaller angu-lar scale of additional molecuangu-lar species, which are missed by sensitive single-dish surveys such as ASAI. So far, only IRAS16293-2422 has been investigated in an unbiased man-ner in the course of the PILS survey (Jorgensen et al. 2016). Thanks to ALMA, spectral signatures of glyco-laldehyde CH3OHCHO (Jorgensen et al. 2012), acetic acid
CH3COOH, ethylene glycol (CH2OH)2 (Jørgensen et al.
2016) and ethanol C2H5OH (Lykke et al. 2017) have been
detected towards IRAS16293-2422. Some of the of the ASAI sources have been studied at high angular resolution (and high sensitivity with ALMA and NOEMA (see e.g. L´ opez-Sepulcre et al. 2017), but there is no coherent data set in terms of frequency range, sensitivity and angular resolution for the whole ASAI source sample.
We first made an inventory of the number of molecu-lar species, counting separately the main isotopologues and the rare isotopologues detected. The detection of the lat-ter crucially depends on the sensitivity of the survey and the gas column density. Hence, the number of detected iso-topologues and molecular lines is a better indicator of the excitation conditions, whereas the number of main isotopo-logues rather traces the molecular complexity of the source. The results are summarized in Tables 2 and 3, with the ex-ception of TMC1, which was not observed at 3 mm. For the sake of comparison, we have included IRAS16293-2422, the only hot corino source investigated in detail until now (Caux et al. 2011; Jaber et al. 2014, 2017; Jorgensen et al. 2016). In order to avoid possible bias in the analysis, we take into account only the molecular transitions detected at an angu-lar scale comparable to that of the ASAI survey (10′′
–30′′
) and in the same spectral range.
The chemical richness can be first described by the num-ber of detected main isotopologues in the ASAI sources, as shown in Table 5. It is typically 40, ranging from 35 (SVS13A) to 51 (B1b). This number varies little between sources, independently of their evolutionary stage and lumi-nosity. Overall, there is no marked difference between the relative importance of the different chemical families.
The ratio r of O-bearing/hydrocarbon species allows us to discriminate between the hot corino sources (r ≃ 1.9– 3.8) and the WCCC sources (r ≃ 1.0–1.4). The definitions adopted for the O- and C-families are very conservative but offers the advantage of lifting any ambiguity on the value of r and r∗(see below). We observe that the ratio r tends to
in-crease with time, from FHSC (r = 1.9) to Class I (r = 2.3). Based on this ratio, we could classify L1157mm as a WCCC source (r= 1.4) and B1b and SVS13A as hot corino sources (r=1.9 and 2.3, respectively), in agreement with the inven-tory of detected complex organic molecules (see Table 2). As can be seen in Table 5 and Fig. 4, the difference between O-rich and hydrocarbon-O-rich sources appears markedly when considering the ratio r∗ of the number of molecular lines
from O- to C-bearing species. The range of values is r∗=
0.3–1.5 for WCCC sources and r∗
= 2.2–8.6 for hot corino sources.
A trend seems to emerge between the chemical prop-erties of the envelopes and the location of the protostars inside the molecular clouds. The large SCUBA survey of the Perseus molecular cloud by Hatchell et al. (2005) shows that the three hot corino sources of our sample (B1b, IRAS4A, SVS13A) are located inside dense filamentary clouds (see also Savadoy et al. 2014). This is unlike L1527, which is lo-cated outside the dense filaments of the Taurus molecular cloud (Goldsmith et al. 2008) and L1157-mm, which lies in a small isolated cloud (see e.g. Chiang et al. 2010). This sug-gests that environmental conditions could play an important role in the origin of the chemical protostellar diversity. Sys-tematic studies on a much larger sample should be carried out in order to confirm this trend.
Two ASAI sources display a low content in Carbon-bearing species: SVS13A and L1157-B1. It is difficult to conclude if this is a consequence of specific chemical activity associated with outflows, or simply a time evolution effect, or both.
Since many sources are associated with outflow shock regions inside the telescope beam, it may seem not so sur-prising that many lines and species are detected in common towards protostars and pure outflow shock regions. However, the two protostellar shocks studied here display unexpected results: L1157-B1 (in a WCCC protostellar region) has a signature typical of hot corino regions (r=3.8), a fact con-firmed by the large number of detected COMs in the shock (Lefloch et al. 2017), whereas L1448-R2, associated with a hot corino region, has a signature typical of WCCC (r=1.3). Detailed analysis of the chemical conditions in L1448-R2 is currently going on to understand why so many C-chains are still present in the shock.
The number of detected S-bearing species is rather con-stant. CH3SH is the only S-bearing COM in the ASAI
sam-ple. D-isotopologues are detected at all stages of evolution. The number of deuterated species is found quite high in the prestellar and Class 0 phase, before dropping in the ad-vanced Class I phase (Bianchi et al. 2017). Many deuterated species are in both shocks, which reveal the presence of fossil deuteration in the outflowing gas (see Codella et al. 2012).
Overall, we detect from ≈ 200 to 400 molecular lines per source in the 3 mm band. The number of detected molecular lines increases with source luminosity in the early protostel-lar stage, and decreases with evolutionary stage, from Class 0 to Class I. We do not observe any marked difference in terms of spectral line density between prestellar and proto-stellar objects, with σ ≃ 6 − 12 lines/GHz (Table 5). Unex-pectedly, the spectral line density measured in protostellar shocks and prestellar cores is comparable to that measured towards protostars: the lowest spectral line density are mea-sured towards the lower luminosity protostars and/or more evolved protostars.
Interestingly enough, the number of main isotopo-logues detected towards the prototypical hot corino source IRAS16293-2422 (Caux et al. 2011) and the high-mass star forming region Orion KL (Tercero et al. 2010) are rather similar to those of the ASAI sources: 41 and 43, respec-tively. A difference appears when considering the number of lines in the ASAI sources: the number of detected lines in the 3 mm band is typically 200–400, hence fully comparable
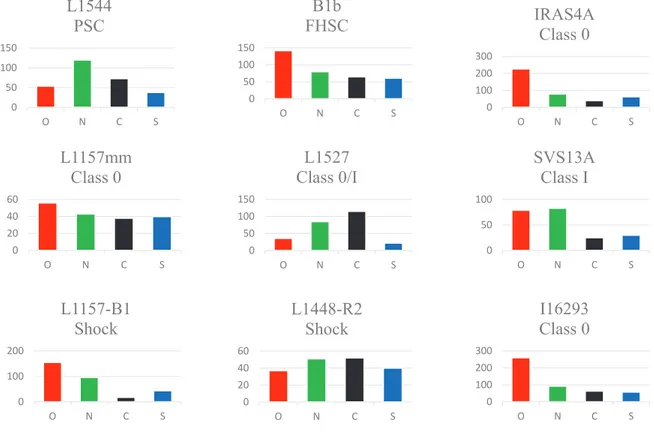
Figure 4.Distribution of the composition of ASAI sources in chemical families, based on the number of molecular lines in the 3 mm band: Oxygen, Nitrogen, Carbon, Sulfur. The early prestellar core TMC1 (observed only at 2mm) was left aside. We show the composition of the Class 0 source IRAS16293-2422 for the sake of comparison (Caux et al. 2011). Comparison of the C-rich and O-rich line number permits identification of the WCCC (O/C 6 1.5) and hot corino (O/C ≫ 1.5) families.
0 100 200 300 O N C S
IRAS4A
Class 0
0 50 100 150 O N C SL1544
PSC
0 50 100 150 O N C SL1527
Class 0/I
0 20 40 60 O N C SL1157mm
Class 0
0 50 100 O N C SSVS13A
Class I
0 100 200 O N C SL1157-B1
Shock
0 50 100 150 O N C SB1b
FHSC
0 100 200 300 O N C SI16293
Class 0
0 20 40 60 O N C SL1448-R2
Shock
to that obtained in Class 0 solar-type protostar IRAS16293-2422, but it is typically a factor of 10 times less than what is found towards Orion KL (Tercero et al. 2010). A similar be-haviour was observed in the submillimeter to far-infrared do-main by Herschel (Ceccarelli et al. 2010), supporting the idea that this result is rather general and frequency independent. Comparing the chemical composition of hot corino sources, only little variations are observed between B1b, IRAS4A, IRAS16293-2422, and SVS13A (Fig. 4). The main difference seems to arise from the content in N-bearing species, rela-tively more important in Class I SVS13A.
Our main conclusion is that chemical richness is already widely present in the initial phases of solar-type star forma-tion, and it is not less than towards high-mass star forming regions. Prestellar cores present a high degree of molecular diversity, comparable to that of protostars. The number of detected molecular lines does not appear to depend much on the evolutionary stage of the source. The large differ-ence in spectral line density appears as a consequdiffer-ence of the excitation conditions and not major differences in the chem-ical richness. Of course, there are strong differences in the molecular abundances even if the species are detected in all sources. In this context, the long studied solar-type
proto-star IRAS16293-2422 does not appear to be a unique object, but rather a typical object of the hot corino Class 0, when compared with the other sources of the ASAI sample.
4.2 Unidentified lines
For each source, a few lines detected at the 5σ level remain unidentified (U) in the 3 mm band. Other U lines are present in the spectral surveys, though at a lower level of detection (3σ and 4σ), which cast some doubts on their statistical significance. In order to provide a list of useful and reliable U lines for future spectroscopic work, we have chosen the 5σ level as detection criterion.
The number of U lines per source is low (Table 4) and represent 1%–2% of the number of detected lines (per source). In Table 5, we report the frequency and observa-tional parameters of these U lines. The reported frequency was chosen so that the emission peak velocity coincides with the vlsr of the source. The uncertainty on the frequency is
typically 0.3 MHz (≈ 1 km s−1) for regions associated with
velocity gradients, such as L1157-B1 or L1448-R2. Some U lines were known from previous works. We have indicated the original reference whenever the case in Table 4. There
c
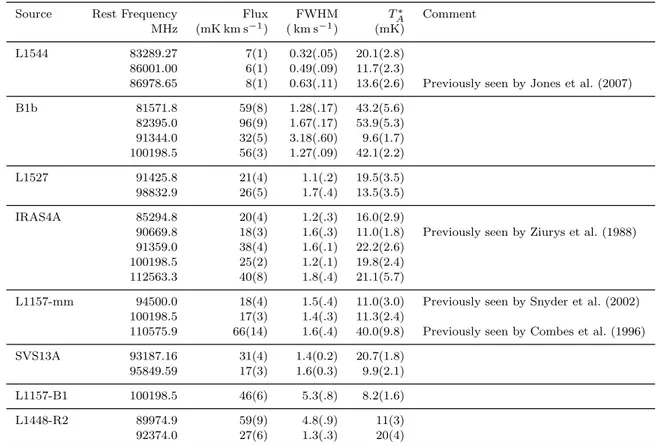
Table 4.Frequency and Observational parameters of U lines in the ASAI source sample. The observational parameters (Flux, linewidth FWHM, peak flux T∗
A) were obtained from a simple gauss fit to the line profile. The uncertainties are given in brackets. Velocity-integrated
fluxes and line intensities are expressed in units of antenna temperature corrected for atmospheric attenuation. Previously detected lines are commented.
Source Rest Frequency Flux FWHM T∗
A Comment
MHz (mK km s−1) ( km s−1) (mK)
L1544 83289.27 7(1) 0.32(.05) 20.1(2.8)
86001.00 6(1) 0.49(.09) 11.7(2.3)
86978.65 8(1) 0.63(.11) 13.6(2.6) Previously seen by Jones et al. (2007)
B1b 81571.8 59(8) 1.28(.17) 43.2(5.6) 82395.0 96(9) 1.67(.17) 53.9(5.3) 91344.0 32(5) 3.18(.60) 9.6(1.7) 100198.5 56(3) 1.27(.09) 42.1(2.2) L1527 91425.8 21(4) 1.1(.2) 19.5(3.5) 98832.9 26(5) 1.7(.4) 13.5(3.5) IRAS4A 85294.8 20(4) 1.2(.3) 16.0(2.9)
90669.8 18(3) 1.6(.3) 11.0(1.8) Previously seen by Ziurys et al. (1988) 91359.0 38(4) 1.6(.1) 22.2(2.6)
100198.5 25(2) 1.2(.1) 19.8(2.4) 112563.3 40(8) 1.8(.4) 21.1(5.7)
L1157-mm 94500.0 18(4) 1.5(.4) 11.0(3.0) Previously seen by Snyder et al. (2002) 100198.5 17(3) 1.4(.3) 11.3(2.4)
110575.9 66(14) 1.6(.4) 40.0(9.8) Previously seen by Combes et al. (1996)
SVS13A 93187.16 31(4) 1.4(0.2) 20.7(1.8)
95849.59 17(3) 1.6(0.3) 9.9(2.1)
L1157-B1 100198.5 46(6) 5.3(.8) 8.2(1.6)
L1448-R2 89974.9 59(9) 4.8(.9) 11(3)
92374.0 27(6) 1.3(.3) 20(4)
is little match between the list of U lines identified in the different sources, but this is mainly a consequence of our selection criterion, as we report here only the lines detected above the 5σ level.
In the case of L1157-B1, we detected only 1 line without any proper identification from the JPL and CDMS public line catalogs. We do not confirm any of the U lines reported by Yamaguchi et al. (2012) in their NRO 45m survey of the shock. The higher sensitivity of the IRAM 30m data, typically a factor of 5, gives us confidence in our conclusion. The low number of U lines present in the 3 mm spec-tral band indicates that they are probably due to ”small” molecules, (molecules with a low number of atoms) as op-posed to COMs. The content of the 2 mm and 1.3 mm bands remains to be analyzed. Making use of the additional infor-mation contained in the higher frequency bands, we hope that collaborations with experts in molecular spectroscopy will allow us to identify the carriers of these U lines.
This is illustrated by our recent identification of the U line at 100198.5 MHz, which is detected in several sources: the shock region L1157-B1, the envelope of the driving pro-tostar L1157-mm, the Class 0 propro-tostar IRAS4A, and the FHSC B1b. This line is detected in other sources, like in L1544, with a lower SNR. Using complementary frequency laboratory measurements, we could assign this line to the ro-tational transition J=2-1 of NS+, and we could identify the additional transitions J=3-2 and J=5-4 in the ASAI spectra (Cernicharo et al. 2018).
5 CHEMICAL EVOLUTION ALONG STAR FORMATION
From our results it emerges a relatively simple picture of the chemical evolution during the star formation process, which will be depicted here.
5.1 Prestellar cores
Observations of the molecular composition of pre-stellar cores, the simplest sites where solar-type stars form, have revealed a very systematic pattern of chemical differen-tiation (Bergin & Tafalla, 2007; Ceccarelli et al. 2007; Caselli & Ceccarelli 2012). During the cold and dense pre-collapse phase, molecules freeze-out onto the grain sur-faces, forming ices. Subsequent hydrogenation of atoms and CO on the grain surface leads to the formation of more complex organic molecules, like formaldehyde (H2CO)
and methanol (CH3OH), in addition to other hydrogenated
species (Watanabe et al. 2003, 2007; Fuchs et al. 2009; Pirim et al. 2010; Taquet et al. 2012; Rimola et al. 2014).
The first results from ASAI reveal that even the dense cores, which are usually assumed to be particularly sim-ple, are much more complex and chemically rich than pre-viously thought. The spectrum of the prestellar cores is particularly rich in the 3 mm band, and it is dominated by carbon-containing molecules. From the L1544 spectral scan we have been able to obtain a full census of the
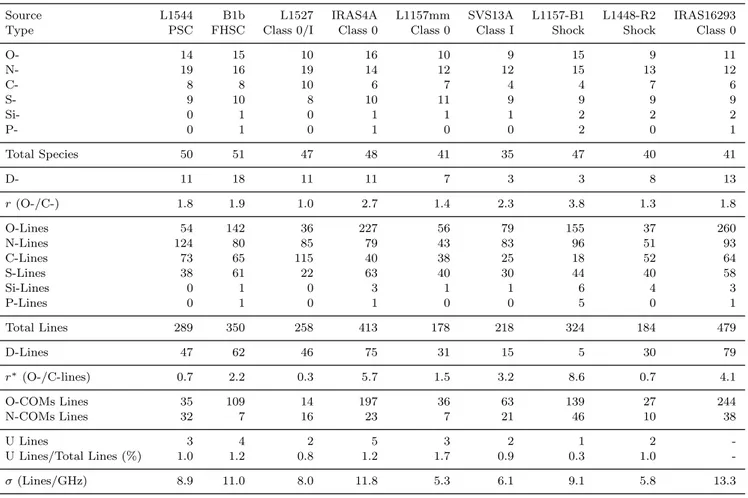
Table 5.3 mm band observations: Number of molecular species (main isotopologue), molecular transitions and spectral line density σ (in lines/GHz) for each source of the ASAI sample. We have included IRAS16293-2422 for comparison. O-COMs: CH3OH, HCCCHO,
HCOOCH3, CH3OCH3, HCOCH2OH; N-COMs: HC5N, CH3CN, C2H3CN, NH2CHO
Source L1544 B1b L1527 IRAS4A L1157mm SVS13A L1157-B1 L1448-R2 IRAS16293
Type PSC FHSC Class 0/I Class 0 Class 0 Class I Shock Shock Class 0
O- 14 15 10 16 10 9 15 9 11 N- 19 16 19 14 12 12 15 13 12 C- 8 8 10 6 7 4 4 7 6 S- 9 10 8 10 11 9 9 9 9 Si- 0 1 0 1 1 1 2 2 2 P- 0 1 0 1 0 0 2 0 1 Total Species 50 51 47 48 41 35 47 40 41 D- 11 18 11 11 7 3 3 8 13 r (O-/C-) 1.8 1.9 1.0 2.7 1.4 2.3 3.8 1.3 1.8 O-Lines 54 142 36 227 56 79 155 37 260 N-Lines 124 80 85 79 43 83 96 51 93 C-Lines 73 65 115 40 38 25 18 52 64 S-Lines 38 61 22 63 40 30 44 40 58 Si-Lines 0 1 0 3 1 1 6 4 3 P-Lines 0 1 0 1 0 0 5 0 1 Total Lines 289 350 258 413 178 218 324 184 479 D-Lines 47 62 46 75 31 15 5 30 79 r∗(O-/C-lines) 0.7 2.2 0.3 5.7 1.5 3.2 8.6 0.7 4.1 O-COMs Lines 35 109 14 197 36 63 139 27 244 N-COMs Lines 32 7 16 23 7 21 46 10 38 U Lines 3 4 2 5 3 2 1 2 -U Lines/Total Lines (%) 1.0 1.2 0.8 1.2 1.7 0.9 0.3 1.0 -σ (Lines/GHz) 8.9 11.0 8.0 11.8 5.3 6.1 9.1 5.8 13.3
oxygen-bearing COMs in this source. We have detected tri-carbon monoxide (C3O), methanol (CH3OH), acetaldehyde
(CH3CHO), formic acid (HCOOH), ketene (H2CCO), and
propyne (CH3CCH) with abundances varying from 5 ×
10−11 to 6 × 10⁻⁹ (Vastel et al. 2014); it was found that
a non-thermal desorption mechanism is possibly responsi-ble for the observed emission of methanol and COMs from the same external layer. Subsequent targeted observations have confirmed the presence of a variety of COMs, including methyl formate (HCOOCH3) and dimethyl ether CH3OCH3
(Jimenez-Serra et al. 2016). Methanol maps of L1544 by Biz-zocchi et al. (2014) confirmed that the emission mainly arises from the outer parts of the core, where CO just started to freeze-out onto dust grains. Similar results on the presence of COMs in dark clouds and prestellar cores were obtained by other groups approximately at the same time ( ¨Oberg et al. 2010, Cernicharo et al. 2012, Bacmann et al. 2012). Based on the WHISPER survey of the Horsehead nebula and a nearby dark core, Guzman et al. (2014) reached the same conclusion about the origin of CH3OH emission: it is present mainly in
the envelope. The authors conclude that a pure gas phase model can account for the observed abundance of H2CO.
The ASAI detection of the cyanomethyl radical (CH2CN) for the first time in a prototypical prestellar core
(L1544) was reported by Vastel et al. (2015b). The authors were able to identify the hyperfine transitions of the ortho
and para forms and computed all transition frequencies and line intensities for all transitions including satellite hyper-fine components at the frequencies observed by ASAI. That paper also reported the first detection of the fine and hyper-fine structure of the ortho and para forms of the cyanomethyl radical at 101 GHz, resolved in this cold dense core.
Several molecular ions have been identified. Lines from the protonated carbon dioxide ion, HOCO+ were analysed
under non-LTE assumptions showing that the HOCO+
emis-sion originates in the same external layer where non-thermal desorption of the other species mentioned above has been observed. Its abundance relative to H2 is found to be (5 ±
2) × 10−11, and pure gas phase models of the chemistry
in-volved in the formation and destruction of HOCO+provide
a gaseous CO2 abundance of 2 × 10⁻⁷(with respect to H2)
with an upper limit of 2 × 10⁻⁶ (Vastel et al. 2016).
Ni-trogen ions such as HCNH+ and HC
3NH+ have also been
detected for the first time in a prestellar core (Qu´enard et al. 2017). The high spectral resolution of the observations allows to resolve the hyperfine structure of HCNH+. A
ra-diative transfer modelling of these ions leads to abundances of 3× 10⁻¹⁰for HCNH+and (1.5 − 3) × 10−12for HC
3NH+,
with respect to H2. The study of some nitrogen species linked
to their production (HCN, HNC, HC3N) coupled with a
gas-grain chemical modelling shows that the emission of these
c
ions originates in the external layer where non-thermal des-orption of other species was previously observed.
5.2 Protostars
The spectrum of Barnard 1, a protostellar object in-termediate between prestellar cores and Class 0 sources, is characterized by many lines of deuterated species, complex molecules and Sulfur-bearing molecules. Fuente et al. (2016) provided a very complete inventory of neutral and ionic C-, N- and S- bearing species with, including the detections of HOCO+ and HCNH+, a tentative detection of HC3NH+,
and up to our knowledge, the first secure detections of the deuterated ions DCS+and DOCO+. The authors also
deter-mined the value of the cosmic ray ionization rate and the de-pletion factors. The observational data were well fitted with ζH2 between 3 × 10⁻¹⁷s−1and 10−16s−1. Elemental
deple-tions were estimated to be ∼10 for C and O, ∼1 for N and ∼25 for S. B1b presents similar depletions of C and O than those measured in pre-stellar cores. The depletion of Sulfur was found to be higher than that of C and O but not as ex-treme as in cold cores. In fact, it is similar to the values found in some bipolar outflows, hot cores and photon-dominated regions, which could be the consequence of the initial con-ditions (important outflows and enhanced UV fields in the surroundings) and a rapid collapse (∼0.1 Myr) that permits to maintain most S- and N-bearing species in gas phase to great optical depths.
The line emission of c-C3H2and its13C isotopic species
were found particularly interesting in the WCCC source L1527, so we conducted a study which confirms the dilu-tion of the13C species in carbon-chain molecules and their
related molecules (Yoshida et al. 2015). The rare isotopo-logues are thought to originate from13C+, which is diluted
in the gas-phase due to the isotope exchange reaction:13C+ +12CO →12C++13CO. This exchange reaction is
exother-mic (∆E= 35 K) so that the 12C+/13C+ ratio tends to be higher in cold clouds and the13C species of various molecules
produced from 13C+ become less abundant. Moreover, the
abundances of the two 13C isotopic species are different
from each other. The ratio of c-13CCCH
2 species relative
to c-CC13CH
2 is determined to be 0.20 ± 0.05. If13C were
randomly substituted for the three carbon atoms, this ra-tio would be 0.5. Hence, the observed rara-tio indicates that c-13CCCH
2 is favoured in dense cores.
The high-sensitivity spectrum obtained towards the Class 0 source L1157-mm looks very similar to that of L1527, and does not display the COM-rich spectrum of objects like IRAS4A (see Figs.1–3). This leads to classify L1157-mm as another member of the WCCC class. The long carbon-chains C5H and C6H were not detected in the protostellar
enve-lope of L1157-mm. It would be useful to carry out comple-mentary observations in the low frequency range, in which their rotational transitions are more easily detected (see e.g. Sakai et al. 2008), in order to confirm their presence or not. The L1157-mm spectrum also reveals blue and red detached components about 45 km s−1 away from the ambient cloud
in the profiles of the SiO(5-4) and SiO(6-5) lines (Tafalla et al. 2015). These extremely high-velocity (EHV) compo-nents are similar to those found in the L1448 and IRAS 04166+2706 outflows and probably arise from a molecular jet driven by L1157-mm that excites L1157-B1 and the other
chemically active spots of the L1157 outflow. This jet was recently mapped with NOEMA by Podio et al. (2016).
A very interesting result from ASAI is that the phase of hot corino can persist until the phase of Class I, as illustrated by the observations of SVS13A (Codella et al. 2016). In the spectrum of SVS13A, we clearly detected 6 broad (FWHM ∼4-5 km/s) emission lines of HDO with upper level energies up to Eu = 837 K (Codella et al. 2016). A non-LTE LVG
analysis implies the presence of very hot (150-260 K) and dense (> 3 107 cm−3
) gas inside a small radius (∼ 25 AU) around the star, which is a clear indication, for the first time, of the occurrence of a hot corino around a Class I protostar. Although the effects of shocks and/or winds at such small scales can not be excluded, this could imply that the ob-served HDO emission is tracing the water abundance jump expected at temperatures ∼ 220-250 K, when the activation barrier of the gas phase reactions leading to the formation of water can be overcome. We derive X(HDO) ∼ 3 10−6, and
a H2O deuteration > 1.5 10−2. The presence of a hot corino
was confirmed by Bianchi et al. (2017), who showed evidence for a methanol enriched small region (radius ≃ 35 AU) of hot (T∼ 80 K) and dense gas (n(H2) > 108cm−3) around the
protostar. More importantly, the analysis of the emission of the deuterated isotopologues of H2CO and CH3OH, showed
that the deuteration richness drops in the Class I phase. Re-cent observations with the Plateau de Bure Interferometer at 0.3′′ showed that the hot corino emission actually arises
from component VLA4B of the binary (Lef`evre et al. 2017).
5.3 Protoplanetary phase
In the subsequent phases (Class I/II), the envelope dis-sipates as the matter accretes onto the central object and is dispersed by the outflow/jet, as the surrounding protoplan-etary disk becomes detectable. Chemistry is expected to be somewhat similar to that of Class 0 sources, with a corino region where ices sublimate, and to the prestellar cores, in the cold and dense regions close to the equatorial plane.
The spectral line density of AB Aur is very low, as ex-pected in a protoplanetary disk. Nevertheless, several lines of CO and its isotopologues, HCO+, H
2CO, HCN, CN, and
CS, were detected (Pacheco-V´asquez et al. 2015). In addi-tion, the detection of the SO 54–33 and 56–45 lines confirms
the previously tentative detection of Fuente et al. (2010), which makes AB Aur the only protoplanetary disk detected in SO. This detection indicates that this disk is warmer and younger than those associated with T Tauri stars. These ASAI results prompted follow-up studies at very high reso-lution which revealed the detailed structure of the AB Aur disk (Pacheco-V´asquez et al. 2016).
5.4 Outflow shocks
Simultaneously with matter accretion onto the proto-star, fast jets, possibly surrounded by a wider angle wind, are powered by the nascent star and seen to interact with the parental medium through molecular bowshocks, produc-ing a slower movproduc-ing molecular ”outflow cavity” (Bachiller 1996). Outflow shocks compress and heat the interstellar material and grain ice mantles are sputtered, resulting in an especially rich chemistry (Bachiller et al. 2001; Codella et
al. 2010). The extremely-high-velocity (EHV) gas forming ”molecular bullets” is well differentiated from the gas traced by the standard outflow cavity wings and could represent material directly ejected from the prostostar or its immedi-ate vicinity (Tafalla & Bachiller 2011). Outflows contribute to dissipate the circumstellar envelope, permitting the radi-ation of the central object to escape at increasing distances, until the central star and its surrounding protoplanetary disk become optically visible as a (Class II) T Tauri star.
The L1157-B1 hot spot exhibits a particularly rich spec-trum with hundreds of lines of many different molecular species (see Table 2), which makes it an ideal laboratory not only for shock but also for astrochemical studies. Most of the lines tentatively detected by the NRO 45m telescope could be confirmed by ASAI (see Table 3 in Yamaguchi et al. 2012), in particular the tentative detections of Si18O
and SiS. There are two exceptions however: first, Lefloch et al. (2017) assigned the transition CH3OCHO
7(4,4,1)-6(4,3,1) to the line at 86224.16 MHz, instead of (CH3)2O at
86223.78 MHz; second, Mendoza et al.(2014) assigned the transitions HCNO 4-3 to the line at 91751.32 MHz, instead of HSCN 8(0,8)-7(0,7), in agreement with the detection of HCNO 5-4 at 114688.38 MHz (Mendoza et al. 2014). Sev-eral species are now detected, including complex N-bearing species (C2H3CN, CH2CN), long carbon-chain molecules
(C4H, HC5N), and deuterated molecules like HDCS, NH2D
or HDO (see also Codella et al. 2012).
Podio et al. (2014) presented a complete census of molecular ions with an abundance greater than ∼10−10,
re-porting the detection of HCO+, H13CO+, N
2H+, HCS+, and
for the first time in a shock, from HOCO+and SO+. It was
concluded that HCO+ and N
2H+ are a fossil record of
pre-shock gas in the outflow cavity, whilst HOCO+, SO+, and
HCS+ are effective shock tracers that can be used to
in-fer the amount of CO2and sulphur-bearing species released
from dust mantles in the shock. The work on sulphur bear-ing ions predicted OCS to be a major carrier of sulphur on dust mantles and modelling of H2S observations suggest
H2S should not be a major carrier of sulphur on the grains
(Holdship et al. 2016).
A multiline analysis of CS and its isotopic variations al-lowed to study the density structure of the molecular outflow (G´omez-Ruiz et al. 2015). The line profiles can be well fitted by a combination of two exponential laws that are remark-ably similar to what previously found using CO by Lefloch et al. (2012). The CS observations show that this molecule is highlighting the dense, nH2 = 1-5 × 105 cm−3, cavity walls
produced by the episodic outflow in L1157. In addition, the highest excitation (Eu > 130 K) CS lines provide us with
the signature of denser (1-5 × 106 cm−3) gas, associated
with a molecular reformation zone of a dissociative J-type shock, which is expected to arise where the precessing jet im-pacting the molecular cavities. The CS fractional abundance increases up to 10−7in all the kinematical components. This
value is consistent with what previously found for prototyp-ical protostars and it is in agreement with the prediction of the abundances obtained via chemical modelling.
Podio et al (2017) reported the detection of SiS for the first time in a low-mass forming region, in particular the protostellar shock L1157-B1. Complementary observations of the shock obtained with the Plateau de Bure Interferom-eter show for the first time that SiO and SiS have a
differ-ent spatial distribution. Whereas SiO is a well established probe of silicates released from dust grain in shocks (see e.g. Gusdorf et al. 2008), SiS appears as a product of gas phase reactions between species released from dust grains in the shock. There is currently no satisfying formation scenario and more work is needed to understand the chemistry of Si-bearing molecules.
Thanks to the high sensitivity of the ASAI observations and full coverage of the 1.3 mm, 2 mm and 3 mm wavelength bands, a systematic search by Lefloch et al. (2017) led to the unambiguous detection of several COMs, such as ketene (H2CCO), dimethyl ether (CH3OCH3) and glycolaldehyde
(HCOCH2OH) for the first time, and other tentative
detec-tions (Arce et al. 2008) were firmly confirmed, such as formic acid (HCOOH) and ethanol (C2H5OH). The large number of
detected lines from each species (∼10–125) permitted accu-rate determination of their excitation conditions and molec-ular abundances. Combining these results with those pre-viously obtained towards other protostellar objects, a good correlation is observed between ethanol, methanol and gly-colaldehyde. The COM richness of the shock region L1157-B1 is fully comparable to that observed in hot corinos, both in terms of molecular abundances and chemical diversity. The potential of shocks to study prebiotic chemistry is illus-trated by the detection of formamide (NH2CHO) in
L1157-B1 by Mendoza et al. (2014). This species is detected in a wide range of Galactic and Extragalactic environments. It turns out that the abundance in the L1157-B1 shock region, ≈5 × 10⁻⁹, is among the highest values reported.
5.5 Pre-biotic molecules along protostellar evolution
L´opez-Sepulcre et al. (2015) have conducted some first comparative studies for molecular species of particular inter-est, such as isocyanic acid (HNCO) and formamide. HNCO was detected in all the ASAI targets, except AB Aur, and NH2CHO in five of them. Their abundances was derived
and analysed them together with those reported in the lit-erature for high-mass sources. For those sources with for-mamide detection, a tight and almost linear correlation was found between HNCO and NH2CHO abundances, with their
ratio being roughly constant, suggesting that the two species are chemically related. The sources without formamide de-tection, which are also the coldest and devoid of hot cori-nos, fall well off the correlation, displaying a much larger amount of HNCO relative to NH2CHO. These results
sug-gest that HNCO can be formed in the gas-phase during the cold stages of star formation. On the contrary NH2CHO
forms preferentially in warm environments. Recent theoret-ical and observational studies (Barone et al. 2015, Skouteris et al. 2017) suggest that formamide could form efficiently in the gas phase from the reaction between NH2 and H2CO.
The tight correlation observed between formamide and iso-cyanic acid remains to be understood.
Formamide is one example of molecules of pre-biotic interest, which ASAI has allowed us to search for in solar-type star forming regions. Another example is provided by the search for Phosphorus-bearing species. Despite a low el-emental abundance (3 × 10⁻⁷
, Asplund et al. 2009), phos-phorus plays an important role in biochemical and metabolic processes in living beings. The signature of PN was detected
c