Meeting Environment and Health Challenges
Peter Rudnai, Luciana Sinisi, Peter Szuppinger, Mihaly Varro, Eva Vaskovi
Copyediting and proofreading:Rachel Hideg
Design:Sylvia Magyar
Photos:CAREC, iStock, Anita Kocic
Printing:Typonova
All REC publications are printed on recycled paper or paper produced without the use of chlorine or chlorine-based chemicals.
The text of this publication is available online atsearch.rec.org/outcomes. The online version also makes available supplementary information and figures in a fully searchable format. The questionnaires used in the SEARCH field studies can also be found on the website. References to the website have been included throughout the present publication wherever additional information exists on a particular topic.
2
Executive summary
4
Introduction
7
Chapter 1: Environment and health
assessments
8 School building characteristics 8 Classroom characteristics
9 The monitoring of indoor air pollution in classrooms
14 Health status of children
18 Associations between measured air pollutants and children’s health 21 Associations between school
characteristics and children’s health 25 Evaluation of children’s health and the
home and school environment
29
Chapter 2: In-depth analysis of the
environmental and health data
30 Design of the study 30 Methodology 30 Conclusions
33
Chapter 3: Comfort assessments
34 Evaluating children’s perceptions 38 Conclusions
41
Chapter 4: Assessment of energy use
42 Analysis of school building structure 44 Analysis of school HVAC systems 45 Energy calculations
49 Recommendations for energy saving 52 Conclusions
55
Chapter 5: The SEARCH II index —
A combined comfort index
56 Methods
57 Results
59 Linking energy and comfort 59 Linking energy, comfort and health
60 Summary
61
References
Final publication of the SEARCH II project
December 2013Background
The SEARCH initiative, an environment and health re-search project, was financially and technically sup-ported by the Italian Ministry for the Environment, Land and Sea (IMELS) through the Italian Trust Fund (ITF). It was implemented within the international frameworks of the EU Action Plan on Environment and Health; and the World Health Organization’s Children’s Environment and Health Action Plan for Europe (WHO CEHAPE), Pri-ority Goal 3 on air quality and children’s health. The pan-European SEARCH II project, the second phase of the SEARCH initiative, was developed in order to ex-pand the monitoring of children’s health and air quality, and to assess energy use in selected schools in 10 countries. Four new countries (Belarus, Kazakhstan, Tajikistan and Ukraine) joined the six countries that participated in SEARCH I (Albania, Bosnia and Herze-govina, Hungary, Italy, Serbia and Slovakia).
The outcome of the second phase was a list of recommen-dations for improving the school environment, buildings and energy consumption based on an analysis of environ-mental, energy and health data from the 10 countries. The SEARCH initiative is implemented by the Regional En-vironmental Center for Central and Eastern Europe (REC) in the framework of the REC’s Health and Environment Topic Area, which is involved in several environmental health projects and works with WHO Europe, the European Envi-ronment Agency (EEA), the European Commission’s Joint Research Centre (JRC), and many national environmental health institutes in Europe. The SEARCH II partnership comprised over 50 individual national experts from 10 countries in Europe and Eastern Europe, Caucasus and Central Asia (EECCA). From diverse professional back-grounds, these experts work in a range of fields including environment and health and energy efficiency.
Main findings
The extensive database containing information on 7,860 children from 388 classrooms in 100 schools in 10 countries created a unique opportunity to study a wide variety of school indoor and outdoor environ-ments, to measure outdoor and indoor concentrations of several air pollutants, and to study the associations between the school environment and children’s health. Sources of indoor concentrations of NO2and, to a lesser extent, PM10, were outdoor pollution (mainly traffic), while volatile organic compounds (VOCs) and formalde-hyde were mainly emitted from indoor sources.
The health status of children from the various countries was assessed and compared. Asthmatic symptoms and doctor-diagnosed allergies were found to be signifi-cantly less frequent in the four new SEARCH II coun-tries than in the six SEARCH I councoun-tries.
The results of the spirometry tests confirmed that the great majority of children have normal respiratory func-tion, and this situation must be maintained in the com-ing years alongside further improvements to the environment in which they live.
The large database allowed statistically significant as-sociations to be found between the school environment and children’s health. Some of these associations may be accidental and difficult to interpret, but most pro-vide information and well-documented facts that can be used to determine new interventions in order to en-sure a healthier school environment and improve children’s respiratory health.
On the basis of the results, some obvious examples of ef-fective interventions can be highlighted: overcrowding in the classrooms should be avoided; windows should be
The comfort assessment was a useful tool for collecting information from children about their perceptions of the school environment. The children’s objective per-ceptions were well supported by objective measure-ments of temperature, relative humidity and CO2 concentrations. According to the assessments, 48 per-cent of children thought the classroom was warmer than optimal (children considered the air temperature to be too high above 22oC). This finding may be signifi-cant from an energy-saving perspective. Further evi-dence was found that good air quality during lessons significantly depends on the ventilation regime during breaks. After adjustment for gender and age, logistic re-gression analysis revealed that when the air in the classroom was of poor quality, the risk of headaches in-creased by 96 percent, and even with neutral air quality by 31 percent, compared to good air quality.
Average primary energy consumption in the 95 analysed schools was 220.9 kWh/m2a. The calculated primary en-ergy consumption was generally 1.7 times higher than the reference value, thus it can be concluded that the modernisation of the building structures and HVAC sys-tems offers a very large energy-saving potential, and recommendations were made for such modernisation. Modernisation could potentially reduce average total primary energy consumption from 220.9 kWh/m2a to 108.0 kWh/m2a, a saving of more than half the primary energy consumption. Improving the thermal characteris-tics of the building envelope would result in lower heat-ing energy consumption, and would also improve children’s perceptions of comfort.
order to create a simple and readily understandable syn-thesis of several physical parameters as perceived by the children who completed the comfort questionnaires. This index can help schools to optimise children’s comfort and school energy consumption. The SEARCH II Index was based on ratings attributed to children’s per-ceptions of thermal comfort, indoor air quality, noise and lighting in the classroom, using questions from the com-fort questionnaire. The index was pilot tested during the SEARCH II project and should be validated in practice through well-designed studies assessing the effective-ness of interventions before and after modernisation that have an impact on children’s comfort.
The SEARCH initiative
The SEARCH initiative is an environment and health re-search project implemented within the international frameworks of the EU Action Plan on Environment and Health; and the World Health Organization’s Children’s Environment and Health Action Plan for Europe (WHO CEHAPE), Priority Goal 3 on air quality and children’s health. The initiative contributes to the European legal and policy framework for sustainability in schools, since children’s health and educational potential depend on the quality of the school environment. The initiative was generously supported by the Italian Ministry for the Environment, Land and Sea (IMELS).
The SEARCH initiative was implemented in three phases: a pilot phase (involving Italy and Hungary) from 2003 to 2004; the first phase from 2006 to 2010; and a second phase from 2010 to 2013. The first phase (SEARCH I) led to the creation of a comprehensive environment and health database through assessments carried out in six countries (Albania, Bosnia and Herzegovina, Hungary, Italy, Serbia and Slovakia). Based on the SEARCH I con-clusions and recommendations, the initiative was reaf-firmed and expanded at the Fifth Ministerial Conference on Environment and Health, held in Parma, Italy, in 2010. The second phase, SEARCH II, with its pan-European per-spective, expanded the monitoring of children’s health and air quality and assessed energy use in selected schools in 10 countries. It included the design of environment and health capacity-building programmes for school staff and training for local implementation, and four new countries (Belarus, Kazakhstan, Tajikistan and Ukraine) joined the six SEARCH I countries. Recommendations were compiled for improving the school environment, school buildings and energy consumption, based on analyses of countries’ envi-ronmental, energy and health data.
The project was supported by the Italian Trust Fund (ITF), a targeted contribution of IMELS to the Regional Environmental Center for Central and Eastern Europe (REC). The institutional mandate of IMELS includes the protection and restoration of the environment, with the aim of ensuring high quality of life, enhancing the sus-tainable use of natural resources and preventing and controlling environmental pollution through legislation and cooperation with strategic sectors. The SEARCH II project was also supported by the Institute for Environ-mental Protection and Research (ISPRA), Italy, a public body under the aegis of IMELS. The REC is the imple-menting agency for the whole of the SEARCH initiative and a vast number of other major environment-related projects. The SEARCH projects were implemented in the framework of the REC’s Health and Environment Topic Area, which participates in several environment and health projects and works with WHO Europe, the Euro-pean Environment Agency (EEA), the Joint Research Centre (JRC) of the European Commission, and many national environment and health institutes.
The SEARCH initiative builds on the strong research partnership between Italy and Hungary. The Italian research team, in cooperation with Hungary’s National Institute of Environmental Health (NIEH), designed the research and assessed the environmental health data. The SEARCH II partnership comprises over 50 individual national experts from 10 countries in Europe and Eastern Europe, Caucasus and Central Asia (EECCA). With diverse professional backgrounds, these experts work in a range of fields including environment, health and energy efficiency. The project is also supported and recognised by ministries of the environment, health and education, non-govern-mental organisations, state agencies for the environment and public health, national institutes, technical universities, foundations, companies and individual consultants.
the school environment and children’s health in a broader context. The project also introduced a new com-ponent: the assessment of energy use in school buildings and the impact of building materials on children’s health in order to compile recommendations for improving the quality of school environments and school buildings and improving energy efficiency based on an analysis of data from the 10 participating countries. The second phase of the initiative built on the successful awareness-raising initiatives carried out under SEARCH I for the prevention of respiratory diseases, particularly among children. The SEARCH II project included three components: en-vironmental monitoring in schools; health and comfort assessments of children; and the monitoring of energy use in schools. According to the project methodology, 10 schools per country were selected, with approxi-mately 100 children per school. The children were aged between 8 and 11, and the selection was based on building characteristics (new/old and light/traditional construction) and on the extent of pollution in the envi-ronment. The monitoring and assessments were carried out via measurements of exposure levels, question-naires and lung function measurements.
Concentrations of selected pollutants (CO, CO2, PM10, benzene, toluene, ethylbenzene and xylenes [BTEX] and formaldehyde), as well as relative humidity and tempera-ture, were monitored during the heating season (Novem-ber 2011–April 2012) both inside and outside the selected schools in order to establish children’s exposure levels. Environmental health data were collected via ques-tionnaires on the school environment (building type,
in the monitoring. Parents of children at the selected schools were invited to complete health questionnaires anonymously, and decisions to decline were respected. The health questionnaires made it possible to gather informa-tion on each child’s past and present health status and home environment (heating, building type, smoking and other lifestyle factors, living density, floor and wall cover-ings, and the family’s socioeconomic status).
The comfort questionnaires were completed by the children and gathered information on the children’s perception of comfort in the classroom. The energy questionnaire gathered information on the school building and energy consumption. The collection of in-formation via the energy questionnaire was combined with the monitoring of temperature and relative humid-ity using data loggers over 10 days (three data loggers inside the school and one outside). The energy ques-tionnaire and other quesques-tionnaires can be found atsearch.rec.org/outcomes.
Active health testing took the form of lung function measurements (spirometry), which were carried out only with parental consent.
In the framework of the SEARCH I project, Hungary, Italy and Slovakia published environmental health training materials for school staff, and Albania, Bosnia and Herzegovina and Serbia drafted similar training materi-als. Under SEARCH II, the four new countries required materials adapted to their local needs.
and health assessments
Environment and health assessments were undertaken in order
to evaluate associations between the school environment
and children’s health in 10 countries. Assessments were carried
out in Albania, Bosnia and Herzegovina, Hungary, Italy, Serbia and
Slovakia under SEARCH I between October 2007 and March 2008;
and in Belarus, Kazakhstan, Tajikistan and Ukraine under SEARCH II
between October 2011 and April 2012.
School building characteristics
Environment and health data were collected during two phases of the SEARCH initiative: in Albania, Bosnia and Herzegovina, Hungary, Italy, Serbia and Slovakia under SEARCH I (October 2007 to March 2008); and in Belarus, Kazakhstan, Tajikistan and Ukraine under SEARCH II (October 2011 to April 2012). Data were collected from 10 schools per country, thus a total of 100 schools were involved in the study. Most of the participating schools were built originally for use as schools and were con-structed mainly from brick and concrete. Some of the schools were built partly from adobe and wood in Bosnia and Herzegovina; and from wood in Ukraine. Sources of pollution (especially industrial facilities) were found in the vicinity of 17 percent of the schools. The distribution of the schools in each country in relation to traffic density is presented in Table 1. Of the total schools, 40 percent were lo-cated in areas with high or very high traffic density. The figure was even higher in Albania and Bosnia and Herzegovina (70 percent in each country) andHungary (60 percent). It should be borne in mind that air pollution caused by traffic has been shown to have a negative impact on children’s health.
Classroom characteristics
Most of the investigated classrooms were situated on the first or second floor of the school building. Only two classrooms in one country were situated below ground level, and a total of eight classrooms in two countries were located on the fourth floor. Almost one-third of investigated classrooms were oriented towards the street. Additional information about the distribution of classrooms by floor level and orientation in each country can be found at search.rec.org/outcomes.
There were big differences among the countries with respect to the number of children per classroom. The average floor space in this study was 2.02 m2/child. All the classrooms in Albania and 60 percent of the classrooms in Bosnia and Herzegovina had less than
TABLE 1 Distribution of schools in relation to traffic density (%)
Country Low Moderate High Very high
Albania 0 30 70 0 Belarus 60 20 0 20 Bosnia and 0 30 20 50 Herzegovina Hungary 10 30 50 10 Italy 10 80 10 0 Kazakhstan 33 11 56 0 Serbia 11 45 22 22 Slovakia 30 50 10 10 Tajikistan 30 30 30 10 Ukraine 40 40 10 10 Average 22.4 36.7 27.6 13.3
2 m2of floor space per child (for details see
search.rec.org/outcomes).
The type of floor covering used varied between and within countries. The most commonly found was plas-tic flooring, which was used in over 40 percent of the monitored classrooms and which can be associated with health risks among children. The second most frequently used type of floor covering was wood, which was found in 31 percent of the investigated classrooms. Concrete flooring, or concrete covered by carpet, were less frequently used in classrooms (15 percent).
Various types of wall covering were used in classrooms: the most frequently used type was water-soluble paint (58 percent), while water-resistant paint was used in a quarter of the classrooms. Wallpaper and whitewash were far less frequently used (18.6 and 16 percent re-spectively). Wood panelling was used in only 6.5 per-cent of the classrooms. From a health perspective, water-resistant paints can contribute to a higher risk of respiratory disease.
The size of the openable windows in the classrooms is an important factor in terms of natural ventilation. In the monitored classrooms, the size of the openable windows also varied considerably. A quarter of the in-vestigated classrooms (an average of 25.7 percent) had openable windows smaller than 2 m2, which can be re-garded as the minimum size of window that allows ap-propriate natural ventilation.
Cleaning practices can be seen as another important potential risk factor in terms of children’s health. After cleaning, appropriate ventilation is essential in order to reduce possible emissions from the cleaning mater-ials used.
Most of the classrooms (an average of 87.7 percent) were cleaned in the evening, and many of them (an av-erage of 39.1 percent) were also cleaned at noon. The most frequently used means of cleaning was a mop (an average of 72.6 percent). Vacuum cleaners were used in an average of only 7.7 percent of the classrooms (see search.rec.org/outcomes).
The monitoring of indoor air
pollution in classrooms
The levels of indoor air pollutants measured in the in-vestigated classrooms in the 100 selected schools from the 10 participating SEARCH countries are presented in Table 2. The same environmental monitoring method-ology was used in all the classrooms. According to the project protocol, the same equipment was used during the SEARCH I and SEARCH II environmental monitoring. Further information can be found on the project web-site (search.rec.org).
The selected pollutants were measured inside and out-side schools in the participating countries during the heating season. The concentrations of BTEX (benzene, toluene, ethylbenzene and xylenes), NO and
formalde-Cleaning practices can be seen as another important
potential risk factor in terms of children’s health. After
cleaning, appropriate ventilation is essential in order to
TABLE 3 Guidelines and recommendations for concentrations of pollutants in the indoor air
SUBSTANCE UNIT VALUE AVERAGING TIME REFERENCES
Formaldehyde µg/m3 100 30 minutes WHO Guidelines for Indoor Air Quality:
Selected Pollutants, 2010
Benzene µg/m3
No safe level of exposure can be recommended
5 annual
WHO Guidelines for Indoor Air Quality: Selected Pollutants, 2010
Directive 2008/50/EC
Toluene µg/m3 260 1 week WHO Air Quality Guidelines for Europe,
2nd edition (2000) – Outdoor
NO2 µg/m3 WHO Guidelines for Indoor Air Quality:Selected Pollutants, 2010
PM10 µg/m3 50 24 hours Particulate Matter, Ozone, Nitrogen DioxideWHO Air Quality Guidelines for
and Sulphur Dioxide (2005) – Outdoor
CO2 ppm 700 ppm difference between indoorand outdoor concentrations ASHRAE 62.1-2004 TABLE 2 Summary of indoor air measurements in schools under SEARCH I and II
Pollutant ALB BIH BLR HUN ITA KAZ SRB SVK TJK UKR
PM10 69 102 28 56 82 65 81 80 91 33 (µg/m3) Formaldehyde 5.61 7.13 7.50 2.41 33.07 10.40 1.73 8.71 12.90 11.50 (µg/m3) Benzene 4.06 6.29 2 2.16 1.95 6.30 5.94 4.84 7.40 2.50 (µg/m3) Toluene 15.45 27.58 6.20 4.56 5.01 18.10 21.94 29.47 17.40 4.90 (µg/m3) Ethylbenzene 1.24 1.60 0.90 1.64 1.82 1.60 1.60 1.38 1.50 0.80 (µg/m3) Xylenes 5.03 7.65 5.90 7.04 7.10 9.10 7.65 5.07 7 4.30 (µg/m3) NO2 12 21 9.90 16 19 17.30 21 14 13 12 (µg/m3) 200 1 hour 40 annual
hyde were examined using a passive sampling method (Radiello-type samplers). One sampling point per class-room was designated for indoor measurements and one for outdoor measurements. Samples were collected in classrooms where the children spent most of their time. The passive samplers were placed at a height of 1.5 to 2 m in the classrooms. Outdoors, the passive samplers were placed on the wall of the building closest to the classroom window. Exposed BTEX samples were analysed using the GC-FID method; NO2samples by spectrophotometer, and formaldehyde samples using HPLC apparatus in Hungary.
The determination of physical parameters, CO2, CO and PM10was performed via real-time monitoring using the TSI IAQ-Calc Indoor Air Quality Meter (Model 7545-CO/CO2/RH/T) and a Haz-Dust particulate matter (PM10)
air monitor. Continuous monitoring over one day during the teaching period was carried out in each classroom and measurements were made of five-minute averages without interval. In parallel, outdoor air pollution was also measured. The monitor was used for 10 minutes outdoors in the morning and again in the afternoon.
Results of air quality measurements
In practice, indoor exposure levels are assessed on the basis of existing guidelines and recommendations. Un-fortunately, it was not possible to evaluate indoor air pollution measured during SEARCH I and II in this way due to the differences between the sampling times used in the SEARCH initiative and those specified in the guidelines and recommendations.Each EU member state sets limit values for workplace environments, but only some member states have guideline values for public places, and limit values for private spaces are very rare. The WHO and other recom-mendations are presented in Table 3.
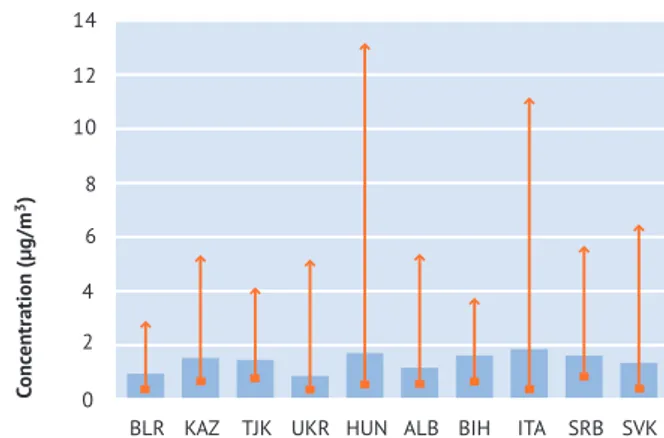
Indoor concentrations of PM10measured in the class-rooms during teaching hours are shown in Figure 1. (In Tajikistan, the measurements were made every 5 min-utes, and in Italy during 24 hours.)
FIGURE 1:Average one-day indoor PM10concentrations measured in classrooms in the 10 SEARCH countries during teaching hours
*5-minute sampling **24-hour sampling
average max min
BLR KAZ TJK* UKR HUN ALB BIH ITA** SRB SVK
Conc entration (µg/m 3) 50 100 150 200 250 300 350 0
FIGURE 2:Indoor levels of benzene measured over four days in classrooms in the 10 SEARCH countries
average max min
Conc entration (µg/m 3) 5 10 15 20 25 30 35 0
Average concentrations varied between 28 and 102 µg/m3, although the maximum values were three to four times higher. The lowest concentrations were measured in Belarus and Ukraine. In the other countries, PM10 pollu-tion was very high: in 51 to 98 percent of the examined classrooms PM10concentrations exceeded 50 µg/m3. Concentrations of BTEX (benzene, toluene, ethylben-zene and xylenes) in the classrooms, measured over four days, are presented in Figures 2 to 5.
Average benzene concentrations varied between 1.95 and 7.4 µg/m3. The lowest concentrations were found in Belarus, Ukraine, Hungary, Albania and Italy, where the average level was no higher than 5 µg/m3. In 33 to 61 percent of classrooms in Kazakhstan, Tajikistan, Bosnia and Herzegovina, Serbia and Slovakia, the measured benzene concentrations exceeded 5 µg/m3. Average concentrations of toluene showed a wide range (4.6 to 29.5 µg/m3). The highest maximum val-ues were measured in Serbia and Slovakia, where the values were higher than 260 µg/m3.
Concentrations of ethylbenzene were in the range of 0.8 and 1.82 µg/m3and maximum values were not high in most of the countries. The highest levels of ethylbenzene pollution were measured in some class-rooms in Italy and Hungary (10.88 and 12.9 µg/m3). Average concentrations of xylenes varied between 4.3 and 9.1 µg/m3, and maximum values were in the range of 15.9 to 69.3 µg/m3. The highest value was measured in a Hungarian classroom.
Concentrations of NO2and formaldehyde measured over four days in the classrooms are shown in Figures 6 and 7. Average concentrations of NO2varied between 9.9 and 22.1 µg/m3, and the maximum value exceeded 40 µg/m3in Kazakhstan, Bosnia and Herzegovina and Italy. Average concentrations of formaldehyde varied be-tween 1.7 and 33.07 µg/m3, although maximum val-ues between five and six times higher were also recorded. The highest level of formaldehyde pollution was found in classrooms in Italy.
FIGURE 3:Indoor levels of toluene measured over four days in classrooms in the 10 SEARCH countries
average max min
Conc entration (µg/m 3) 10 20 30 40 50 60 70 80 90 100 0
BLR KAZ TJK UKR HUN ALB BIH ITA SRB SVK
401 667
FIGURE 4:Indoor levels of ethylbenzene measured over four days in classrooms in the 10 SEARCH countries
average max min
Conc entration (µg/m 3) 2 4 6 8 10 12 14 0
FIGURE 5:Indoor levels of xylenes measured over four days in classrooms in the 10 SEARCH countries
average max min
Conc entration (µg/m 3) 10 20 30 40 50 60 70 80 90 0
BLR KAZ TJK UKR HUN ALB BIH ITA SRB SVK
FIGURE 6:Indoor levels of NO2measured over four days in classrooms in the 10 SEARCH countries
average max min
Conc entration (µg/m 3) 10 20 30 40 50 60 0
BLR KAZ TJK UKR HUN ALB BIH ITA SRB SVK
FIGURE 7:Indoor levels of formaldehyde measured over four days in classrooms in the 10 SEARCH countries
average max min
Conc entration (µg/m 3) 20 40 60 80 100 120 0
BLR KAZ TJK UKR HUN ALB BIH ITA SRB SVK
FIGURE 8:Relationship between concentrations measured inside the classrooms and outside the schools in the 10 SEARCH countries
4 5 6 3 2 0 1 Formaldehyde Toluene Xylenes Ethylbenz ene Benz ene PM 10 NO 2 Indoor/outdoor ratio 0.91 1.11 1.98 1.53 1.85 0.70 4.31
The relationship between indoor and outdoor concen-trations is illustrated in Figure 8. The results shown in the figure suggest that the main source of NO2 pollu-tion was the ambient air, and that formaldehyde was primarily emitted from indoor sources.
Health status of children
Children’s health status was evaluated via health question-naires completed by their parents. These questionquestion-naires gathered information on the children’s past and present health status, perinatal conditions, parents’ respiratory health, smoking habits in the family, home environment
and families’ socioeconomic status. The children’s health questionnaire, along with the school, classroom, comfort and energy questionnaires used in the SEARCH initiative, are available atsearch.rec.org/outcomes.
In addition, spirometry tests were used to monitor chil-dren’s lung function. Nearly half the parents of the par-ticipating children agreed to the spirometry test. Carrying out so many spirometry tests in different coun-tries was extremely challenging, and many councoun-tries lacked skilled technicians at the start of the project. Be-fore the field activities in the schools, local technical experts participated in an environment and health training, held at the REC in Hungary in May 2011,
TABLE 4 Prevalence (%) of children with a chronic cough, by country
Country Regular Regular Chronic cough Regular cough Any regular/ morning cough day/night cough >3 months with phlegm chronic cough
Albania 18.7 20.8 7.7 41.6 53.6 (n=1,019) Belarus 9.1 5.8 1.0 2.2 12.6 (n=625) Bosnia and 10.9 10.6 3.2 10.8 24.3 Herzegovina (n=865) Hungary 8.4 6.5 3.3 3.6 13.4 (n=704) Italy 13.2 11.8 3.5 8.5 22.8 (n=915) Kazakhstan 17.3 10.6 1.3 5.5 25.4 (n=602) Serbia 10.5 9.9 3.1 9.4 21.5 (n=735) Slovakia 14.7 10.7 2.6 4.9 24.1 (n=825) Tajikistan 22.1 15.5 1.6 4.4 29.6 (n=888) Ukraine 16.3 16.6 18.6 16.7 41.1 (n=682) Total 14.4 12.3 4.6 11.8 27.9 (n=7,860) average
where they were introduced to the spirometry equip-ment. The majority of the tests were not done "profes-sionally", although we consider that it was still worthwhile performing them. The majority of the ac-ceptable tests, and almost all of the less acac-ceptable tests (from a scientific point of view) were normal, or can be considered as normal, implying that the chil-dren’s respiratory health was globally good, mainly be-cause they were young, non-smokers, and had been well cared for by their families.
The questionnaires completed by the parents provided information on respiratory and other symptoms (i.e. indications of health problems but not actual
dis-eases) that could be related to the school (or home) environment. This information included, for example, whether a child usually had a cough in autumn/winter, had had asthmatic symptoms (wheezing) in the last 12 months, had any allergy, and had an allergy con-firmed by a doctor.
Table 4 shows that more than a quarter of the partici-pating children often had a cough, although only 5 percent of children had a chronic cough that lasted for more than three months (considered as a symp-tom of chronic bronchitis in adults). The table also shows a significant heterogeneity in prevalence among the countries.
TABLE 5 Prevalence (%) of children with asthmatic symptoms in the last 12 months, by country
Country Wheezing after exercise Dry cough at night Woken up by wheezing Any wheezing <12 months <12 months <12 months <12 months
Albania 6.5 14.2 7.4 22.8 (n=1,019) Belarus 9.0 14.9 2.2 21.4 (n=625) Bosnia and 8.9 15.3 5.1 23.1 Herzegovina (n=865) Hungary 8.2 10.9 2.0 16.9 (n=704) Italy 11.5 13.9 3.6 23.4 (n=915) Kazakhstan 6.3 5.8 1.5 14.0 (n=602) Serbia 9.4 13.9 6.0 22.9 (n=735) Slovakia 8.0 14.9 5.5 23.2 (n=825) Tajikistan 6.8 9.4 2.8 20.5 (n=888) Ukraine 8.2 8.2 0.2 16.6 (n=682) Total 8.3 12.4 3.9 20.8 (n=7,860) average
Wheezing was reported by the parents of one in five children (Table 5). The prevalence of the most severe symptom — that of being woken up by wheezing — was only 3.9 percent, and was significantly lower in the four EECCA countries than in the six SEARCH I countries.
In general, a similar difference can be observed in the prevalence of doctor-diagnosed asthma (Table 6), although there is a relatively high proportion
(4.06 percent, and 8.6 percent in Tajikistan) of miss-ing answers.
The prevalence of the various types of doctor-diag-nosed allergy (Table 7) was also significantly lower in the four EECCA countries than in the other six coun-tries, a finding that is in line with earlier studies car-ried out in Eastern and Western European countries (e.g. the significant difference found by von Mutius et al. in the 1990s between East and West Germany, which was confirmed in various subsequently pub-lished papers).
Other questions related to the children’s health con-cerned allergic symptoms other than those of the res-TABLE 6 Prevalence (%) of children with asthma diagnosed by a doctor ever
and treated for asthma in the last 12 months, by country
Country Asthma diagnosed ever Asthma treatment <12 months
Albania 11.8 5.7 (n=990) Belarus 4.0 2.2 (n=622) Bosnia and 11.0 6.8 Herzegovina (n=796) Hungary 7.1 3.7 (n=695) Italy 12.2 7.9 (n=856) Kazakhstan 5.8 5.2 (n=582) Serbia 12.8 9.3 (n=719) Slovakia 7.3 6.4 (n=797) Tajikistan 10.9 9.7 (n=812) Ukraine 4.0 3.1 (n=672) Total 9.1 6.2 (n=7,541) average
TABLE 7 Prevalence (%) of children with doctor-diagnosed allergies, by country
Country House Animal fur, Pollen Mould Food Drug Any dust mite feathers
Albania 13.2 4.9 5.9 5.1 5.3 5.0 19.4 (n=1,019) Belarus 4.0 2.6 5.8 1.6 12.5 7.7 21.8 (n=625) Bosnia and 10.1 5.3 10.3 3.7 2.5 4.3 18.0 Herzegovina (n=865) Hungary 9.5 9.7 12.2 7.2 8.8 10.8 23.70 (n=704) Italy 8.9 4.4 8.9 3.2 4.9 3.4 17.5 (n=915) Kazakhstan 1.0 1.2 3.2 0.2 6.2 6.2 15.5 (n=602) Serbia 10.1 5.6 11.8 4.1 2.6 4.5 17.4 (n=735) Slovakia 9.7 6.8 14.9 5.1 5.9 4.6 28.9 (n=825) Tajikistan 2.6 2.3 2.1 1.8 4.3 3.0 6.60 (n=888) Ukraine 3.2 3.1 4.7 1.5 7.5 10.3 15.4 (n=682) Total 7.6 4.6 8.0 3.5 5.8 5.7 18.3 (n=7,860) average
The health questionnaires gathered information on
children’s past and present health status, perinatal
conditions, parents’ respiratory health, smoking habits
in the family, home environment and families’
piratory tract (skin rashes, eczema, allergic oedema, conjunctivitis) and some respiratory tract–related symptoms (runny or blocked nose, hay fever, earache, sinusitis and complications of these) experienced for at least two weeks in the last 12 months (Table 8). There was also a significant heterogeneity in the prevalence of these physical symptoms, although the difference between the SEARCH I and SEARCH II coun-tries mentioned above was evident only in the case of some symptoms (e.g. allergic oedema, conjunctivitis or hay fever).
Mental health is an important aspect of human health, as influenced by various endogenous and environmen-tal factors. The prevalence of certain psychological symptoms was therefore also evaluated in order to see if such symptoms might also reflect the impact of the school environment on health (Table 9). The high prevalence of symptoms of depression (the presence of a sleep disorder, fatigue or social withdrawal/reserve) deserves specific attention: one in every four children showed signs of such symptoms for at least two weeks during the last 12 months.
TABLE 8 Prevalence (%) of children with physical symptoms, by country
Country Skin rash, Allergic Conjunc- Blocked/ Hay fever Earache Sinusitis Complications eczema oedema tivitis runny nose (earache/
sinusitis) Albania 6.6 6.0 10.5 45.9 7.8 22.6 3.4 24.5 (n=1,019) Belarus 14.7 1.8 5.6 47.2 3.8 8.5 4.3 11.5 (n=625) Bosnia and 10.1 3.7 5.1 48.1 3.9 8.1 3.8 10.6 Herzegovina (n=865) Hungary 15.6 2.3 8.2 34.8 6.1 6.7 4.0 9.9 (n=704) Italy 9.7 3.7 6.9 27.8 3.2 10.7 7.0 15.5 (n=915) Kazakhstan 6.0 1.3 2.7 35.7 2.2 6.6 2.3 8.6 (n=602) Serbia 12.1 3.5 4.9 49.7 3.1 9.0 4.2 11.7 (n=735) Slovakia 19.2 2.9 5.1 46.3 3.8 10.6 21.1 27.2 (n=825) Tajikistan 2.1 1.9 1.5 23.1 0.8 9.8 3.2 11.8 (n=888) Ukraine 11.4 2.6 3.7 63.1 2.8 5.6 13.3 15.7 (n=682) Total 10.5 3.1 5.6 41.7 3.8 10.4 6.7 15.3 (n=7,860) average
Associations between measured air
pollutants and children’s health
Associations between the measured air pollutants or other characteristics of the school environment and children’s health were analysed using linear or logistic regression, Student’s t-test, or the non-parametric Mann-Whitney test. For the logistic regression analysis, we calculated the adjusted (corrected) associations (odds ratios) using age, gender, parental smoking at home, living density at home, and country as correctionfactors. Statistical significance was established at a probability level of 0.05 (p<0.05), although borderline significance (p<0.1) was also mentioned (p: ~). One of the asthma-related symptoms (wheezing after exercise) was significantly associated with indoor CO2 concentrations measured in the classrooms: children in classrooms with CO2concentrations above 2,000 ppm experienced a 99 percent increased risk of wheezing after exercise, compared to those in classrooms with lower indoor levels of CO2(Figure 9). In the figure, cOR
TABLE 9 Prevalence (%) of children with psychological symptoms, by country
Country Sleep Fatigue Attention Irritability Anxiety Social Any of the 3 disorder deficit withdrawal depression
disorder (reserve) symptoms*
Albania 9.0 21.8 2.1 19.0 6.3 9.1 29.7 (n=1,019) Belarus 5.3 25.8 9.4 21.3 7.8 3.5 28.5 (n=625) Bosnia and 3.9 12.4 9.3 11.3 8.6 4.9 15.7 Herzegovina (n=865) Hungary 4.1 13.2 9.8 15.8 6.8 6.4 18.6 (n=704) Italy 6.7 26.9 14.9 18.1 18.0 7.7 30.7 (n=915) Kazakhstan 4.8 24.6 15.3 17.4 8.5 2.7 26.1 (n=602) Serbia 5.7 14.0 10.2 12.4 7.9 5.2 18.6 (n=735) Slovakia 3.3 16.6 13.0 12.9 6.7 4.9 19.6 (n=825) Tajikistan 5.9 11.0 8.7 10.8 9.4 4.3 15.7 (n=888) Ukraine 8.2 32.7 21.7 30.5 23.9 23.5 46.5 (n=682) Total 5.8 19.6 11.0 16.6 10.3 7.2 24.7 (n=7,860) average
FIGURE 9:Prevalence (%) of children wheezing after exercise in classrooms with indoor concentrations of CO2below or above 2,000 ppm 4.7 ~6 0–2,000 ppm >2,000 ppm 6 4 5 0 3 2 1 % +cOR=1.99** (95% CI: 1.19–3.34) +corrected for age, gender, parental smoking, living density at home, and country ~p<0.1 **p<0.01
FIGURE 10:Prevalence of children woken by wheezing or with any doctor-diagnosed allergy in classrooms with indoor concentrations of benzene below or above 5 µg/m3
6.3*** 3.7
20.7 19
Woken by wheezing Any diagnosed allergy 20 25 0 15 10 5 +cOR=1.52* (95% CI: 1.07–2.16) +cOR=1.20~ (95% CI: 0.97–1.48) +corrected for age, gender, parental smoking, living density at home, and country
%
0-5 µg/m3 >5 µg/m3
FIGURE 11:Prevalence (%) of children with regular day/night cough in classrooms with indoor
concentrations of xylenes below or above 10 µg/m3
0-10 µg/m3 >10 µg/m3 16 8 10 12 14 0 6 4 2 12.9 15.8* +cOR=1.37* (95% CI: 1.05-1.78)
+corrected for age, gender, parental smoking, living density at home, and country *p<0.05
%
FIGURE 12:Mean concentrations of NO2measured in classrooms on different floors of the school building
Conc entration (ug/m 3) 5 10 20 15 25 30 35 0 -1 0 1 2 3 4 Floor level 12.3 19.3 17.7 15.3 13.0 13.8
is the corrected odds ratio. Odds refers to the ratio of probability of occurrence of an event to that of non-occurrence: OR=1.0 means there is no difference. OR=1.88 means an 88 percent increase in risk. CI=95% (confidence intervals) means a 95 percent probability that the given value is within the given range. Significant differences can be observed in the preva-lence of children woken up by wheezing and of children with any doctor-diagnosed allergy between classrooms with indoor benzene concentrations above or below 5 µg/m3(Figure 10).
Similar differences were found with respect to the prevalence of children with a regular day/night cough between classrooms with indoor concentrations of xylenes above or below 10 µg/m3(Figure 11).
Associations between school
characteristics and children’s health
Determinants of the health status of the children varied significantly among the participating countries, thus all the analysed associations between the school environ-ment and children’s health status were corrected for country, as well as for age, gender, parental smoking and living density at home. A summary of the statisti-cally significant (p<0.05, i.e. where the probability of chance is less than 5 percent) or borderline significant (p<0.1, where the probability of chance is less than 10 percent) associations between school and classroom characteristics and the health status of children can be found atsearch.rec.org/outcomes.Statistically significant associations are not necessarily the most important. Below we discuss those associa-tions that can be considered important from a public health point of view.
School location
An industrial facility in the close vicinity of the school was found to have an adverse effect on children’s respi-ratory health (shown by the increased prevalence of children with a chronic cough, earache, upper respira-tory tract complications and decreased lung function results). The distribution of the participating schools in relation to traffic density by country is shown in Table 1 (page 8). Figure 8 (page 13) shows that the primary source of NO2, and to some extent also of PM10, is out-door air pollution. In the case of both NO2and PM10, there is a significant decreasing trend in the measured indoor concentrations the higher the floor level (Fig-ures 12 and 13). In the case of NO2, the decrease is from ground floor to fourth floor, while in the case of PM10, the decrease is from below the ground floor to the fourth floor.
Figure 14 shows that the mean concentrations of NO2 measured in the classrooms depend on traffic density in the close vicinity of the school, the floor level of the classroom, and whether the classroom faces the street or the schoolyard.
FIGURE 13:Mean concentrations of PM10measured in classrooms on different floors of the school building
Conc entration (ug/m 3) 20 40 80 60 100 120 140 0 -1 0 1 2 3 4 118.9 62.5 66.0 65.3 50.3 91.6 Floor level
Indoor PM10concentrations were also higher on the lower floors than the higher floors, especially in areas with high traffic density (seesearch.rec.org/outcomes). There is a significant decreasing trend in the preva-lence of doctor-diagnosed pollen and house dust mite allergies the higher the floor level. Figures showing the prevalence of children with such allergies in class-rooms on various floor levels can be found at
search.rec.org/outcomes.
Classroom crowdedness
As mentioned above, the mean floor space in this study was 2.02 m2/child. A table showing the distribution of classrooms with floor space of less than 2 m2/child by country can be found at
search.rec.org/outcomes.
Overcrowding in the classrooms (i.e. floor space of less
than 2 m2/child) resulted in a significant increase in the measured indoor concentrations of several pollutants, including CO2, benzene, toluene and PM10(Figures 15, 16 and 17).
Classroom occupancy is an important parameter in all countries. The prevalence of children with chronic cough symptoms is significantly higher in over-crowded classrooms. Further discussion of the poten-tial health risks of overcrowding can be found at search.rec.org/outcomes.
Floor covering
The use of plastic flooring was found to be associated with a significantly increased risk of doctor-diagnosed allergies (Figure 18) and decreased lung function in some countries.
On the other hand, a higher prevalence of children
FIGURE 14:Mean indoor concentrations of NO2 in classrooms by traffic density, street orientation and floor level
Yard Street Yard Street
20 25 0 15 10 5 11.7 14.6* 14.1 18.5* 16.8 19.9** 14.4 24.6* *p<0.05 **p<0.01 Floor levels 2-4 Conc entration (µg/m 3)
Low traffic density High traffic density
Floor levels <2
FIGURE 15:Association between CO2concentration and overcrowding in classrooms
2,110***
1,462 1,552*** 1,036
Actual indoor
concentration Indoor-outdoordifference 2,000 2,500 0 1,500 1,000 500 Conc entration (ppm) ≥2m2/child <2m2/child ***p<0.001
FIGURE 16:Association between indoor concentrations of benzene and toluene (µg/m3) and overcrowding
in classrooms 4.7*** 3.4 14.2** 10.1 Benzene Toluene 8 10 0 6 4 16 14 12 2 Conc entration (µg/m 3) ≥2m2/child <2m2/child **p<0.01 ***p<0.001
FIGURE 17:Association between PM10concentration (µg/m3) and overcrowding in classrooms
≥2m2/child <2m2/child 80 40 50 60 70 0 30 20 10 56.5 77.2*** ***p<0.001 Conc entration (µg/m 3)
with symptoms of depression was found in classrooms with a simple stone or concrete floor, although after adjustments these associations were no longer statisti-cally significant.
Wall covering
The use of water-resistant paint is associated with a significantly increased risk of doctor-diagnosed asthma and allergies in the participating countries (Figure 19). (See alsosearch.rec.org/outcomes.)
Concentrations of the measured volatile organic com-pounds (benzene, ethylbenzene, xylenes and toluene) were all significantly higher in classrooms with walls that had been renovated in the last two years. Concen-trations were similar in classrooms that were
renovated either one or two years ago (see search.rec.org/outcomes).
Children in classrooms with recently painted walls were at significantly higher risk of regular morning coughing than children in classrooms with walls painted more than two years ago (for more informa-tion, seesearch.rec.org/outcomes).
Ventilation
Openable windows do not in themselves protect chil-dren from chronic coughing. In classrooms where win-dows were not opened every break, significantly more children suffered from a chronic cough than in those classrooms that were ventilated more frequently (see search.rec.org/outcomes). The prevalence of chronic coughing was 50 percent higher in classrooms where the windows were not opened every break compared to classrooms where the windows were opened every break, and the prevalence of regular coughing was even higher.
Children in classrooms with windows that were reg-ularly opened even during teaching time were sig-nificantly more protected from chronic coughing than children in classrooms where the windows could not be kept open during classes due to out-door noise.
Time and means of cleaning
Most of the investigated asthmatic and allergic symp-toms occurred more frequently in classrooms that were cleaned in the evening (87.7 percent of class-rooms). Technical staff therefore need to be advised to open the windows after cleaning the classrooms in order to reduce the level of emissions from cleaning products in the indoor air.
Conclusions
• The large database containing information on 7,860 children from 388 classrooms in 100 schools in 10 countries provided a unique op-portunity to study a wide variety of school in-door and outin-door environments; to measure outdoor and indoor concentrations of several air pollutants; and to investigate the associations between the school environment and children’s health.
• Indoor concentrations of NO2and — to a lesser extent — PM10originated from outdoor pollution sources (mainly traffic), while volatile organic compounds and formaldehyde were mainly emit-ted by indoor sources.
• The health status of children from the various countries was assessed and compared. It was observed that asthmatic symptoms and doctor-diagnosed allergies were significantly less fre-quent in the four new SEARCH II countries than in the six SEARCH I countries. This observation is in line with earlier findings on the difference be-tween East and West Germany in the 1990s and can be explained by the “Western lifestyle”.
FIGURE 18:Prevalence (%) of children with various types of diagnosed allergy in classrooms with and without plastic flooring
+corrected for age, gender, parental smoking, living density at home, and country ~p<0.1 *p<0.05 ***p<0.001 20.8*** 17.3 10.7*** 7.7 6.0* 4.6 Any diagnosed
allergy Pollen allergydiagnosed Animal fur andfeather allergy diagnosed 20 25 0 15 10 5 +cOR=1.18~ (95% CI: 0.99–1.41) +cOR=1.35* (95% CI: 1.07–1.69) +cOR=1.37* (95% CI: 1.06–1.69) %
No plastic floor Plastic floor
FIGURE 19:Prevalence (%) of children with asthma or asthmatic symptoms in classrooms with walls painted with water-resistant paints
10.9* 9.0
7.5* 6.0
Diagnosed asthma Asthma treatment in last 12 months 8 10 0 6 4 12 2 %
No water-resistant paints Water-resistant paints
*p<0.05
+cOR=1.32* (95% CI: 1.05–1.65) +cOR=1.39* (95% CI: 1.05–1.82) +corrected for age, gender, parental smoking, living density at home, and country
• The results of the spirometry tests confirmed that the great majority of children still have normal respiratory function. The challenge is to maintain this situation in the future and to further improve the environment in which they live.
• The extensive database made it possible to identify several statistically significant associations between the school environment and children’s health. Some associations may be accidental and difficult to inter-pret, but most provide useful information and well-documented facts that can be used to determine new interventions in order to ensure a healthier school environment and better respiratory health for children.
• The results allow us to identify some obvious ex-amples of effective interventions: overcrowding in classrooms should be avoided; windows should be opened every break, and some should even be kept open during classes as well; plastic (PVC) flooring and water-resistant paints should be avoided; and schools should not be built along-side busy roads or in areas that are heavily pol-luted from other sources.
Evaluation of children’s health and
the home and school environment
The SEARCH II project used the same protocol, ques-tionnaires, measuring equipment and methods that were used for the first phase, with the ultimate goal of analysing the associations between the school environ-ment and children’s health using a large, pooled data-base covering 10 countries and a variety ofenvironmental factors. As the SEARCH I results per country have already been published in a small leaflet prepared for the Parma Ministerial Conference in March 2010, below we present the descriptive results related to health status and the home and school environment of children participating in the four new countries that joined the SEARCH II project.
Health status
A total of 2,797 children from the four EECCA countries participated in the SEARCH II project. Respiratory symp-toms were the most common complaints: 32.5 percent of children reported suffering from this type of symp-tom, which is slightly more than the respective pro-portion in the six SEARCH I countries (28.0 percent).
The extensive database made it possible to identify several
statistically significant associations between the school
environment and children’s health. While some associations
may be difficult to interpret, most provide useful
information that can help to determine new interventions
in order to ensure a healthier school environment and
better respiratory health for children.
The two more serious respiratory symptoms (a cough for more than three months and cough with phlegm) were several times more frequent in Ukraine than in the other three EECCA countries (for more, see search.rec.org/outcomes).
The data concerning the prevalence of asthmatic symp-toms are very similar to those obtained during the SEARCH I study (seesearch.rec.org/outcomes), although there is a big difference in the prevalence of doctor-diagnosed asthma (10.5 percent in SEARCH I, and only 2.35 percent in SEARCH II). However, this finding is in line with earlier studies carried out by von Mutius et al. in the 1990s. The difference might also be explained by the different medical and technical resources available. Doctor-diagnosed allergies were less frequent in the four new SEARCH II countries (15.1 percent) than in the other six countries (20.6 percent). However, there was significant heterogeneity among the four EECCA coun-tries: in Tajikistan, the prevalence was as low as 8.0 per-cent, compared to 21.8 percent in Belarus. Food and drug allergies were the two leading types of allergy in all four countries, while in the SEARCH I countries aller-gies to house dust mites and pollen were the most fre-quent (about three times more frefre-quent than in the SEARCH II countries). Additional information can be found atsearch.rec.org/outcomes.
Risk factors in the home environment
In terms of home location, 32.2 percent of children lived near a busy road, although there was a high level of variability between Belarus (51.4 percent) and Ukraine (9.4 percent). Living near to an industrial fa-cility was most frequent in Belarus (26.7 percent), and living near to a waste disposal site was most frequent in Ukraine (24.1 percent). There was also a high level of variability in the type of dwelling: around 62 per-cent of children lived in multi-storey apartment build-ings, with extremes in Ukraine (96.4 percent) and Tajikistan (32.6 percent). The frequency of plastic flooring in the child’s room was highest in Kazakhstan (27.6 percent), while in the other three countries it was between 1.8 and 4.2 percent. In most children’srooms the walls were papered. Walls painted with syn-thetic paints were less frequent (the highest propor-tion was 6.4 percent in Kazakhstan). Visible signs of dampness or mould in homes were reported with rela-tively low frequency (9.8 percent for the home as a whole, and 4.1 percent for the child’s room). Further discussion of this topic can be found at search.rec.org/outcomes.
Classroom environment
Around a third of classrooms were facing the street (more than half in Tajikistan). There was no plastic flooring in Kazakhstan, while in the other three coun-tries plastic flooring was used in more than half the classrooms. Water-resistant paints were used most fre-quently in Belarus (37.7 percent). More than half the classrooms had been painted within one year, with ex-tremes of 6.4 percent (Ukraine) and 83 percent (Tajik-istan). Overcrowding (floor space of less than
2 m2/child) was least frequent in Belarus (8 percent), while in the other three countries about half the children were in crowded classrooms (for details, see search.rec.org/outcomes).
In most countries, classrooms were cleaned after school hours, and sometimes between classes. With the excep-tion of Ukraine, more than half the classrooms were cleaned twice a day (seesearch.rec.org/outcomes). Mops were used most frequently for cleaning in every country. Bleach was used only in Kazakhstan with a high frequency (89.9 percent). The frequency of windows being opened during cleaning varied between 11.3 per-cent in Belarus and 100 perper-cent in Ukraine. In most cases, classroom furniture was made of medium-density fibreboard (MDF). With some exceptions in Kazakhstan, most classrooms were equipped with a blackboard.
School environment
Most of the schools were originally built as schools, and most were constructed from brick and concrete. In Kazakhstan and Tajikistan, 7 to 8 percent of children at-tended schools made from adobe. Renovations carried
out over the past five years concerned classrooms (65.7 percent), windows (44 percent) and lighting (46.2 per-cent). Heavy traffic in the vicinity of the school was re-ported in almost 60 percent of schools in Kazakhstan and 0 percent in Belarus. Almost all schools had a schoolyard, and most children made use of it during the breaks or after school hours. The presence of green spaces around the school was not so uniform: only 28.7 percent of schools in Ukraine compared to 100 percent in Tajikistan. In some schools, teachers were permitted to smoke in designated places, although in most schools the teachers were not allowed to smoke. There was not much variability in terms of the type of heating used in the investigated schools. In Kazakhstan, 64 per-cent of the children attended schools with artificial ventilation, while in the other three countries the figure was around 10 percent. In Tajikistan, 36 percent of the children attended schools in the vicinity of an industrial facility or waste disposal site, while these environ-mental risk factors were only minimal in the other three countries. Further discussion of this topic can be found atsearch.rec.org/outcomes.
Final remarks
It should be stressed that the investigated schools should not be regarded as representative of the coun-tries and that the results therefore by no means re-flect the situation in the individual countries. The results merely illustrate the variability of our sample survey, which helps us to study the impact of various risk factors found in the school environment on children’s health.
environmental and health data
The database created under SEARCH I and II, containing data for
7,860 children from 388 classrooms in 100 schools in 10 countries,
represents a unique opportunity to study a wide variety
of school indoor and outdoor environments; outdoor and indoor
concentrations of several air pollutants; and associations between
the school environment and children’s health.
In-depth analysis allows us to expose general prob-lems, issues or phenomena and to explain them in detail. The extremely high levels of air pollution measured in classrooms in the SEARCH I and II countries can be considered, in our case, as the prob-lem requiring clarification. The inclusion of extreme data in the analysis is relevant, as they might have an effect on the mean values, while at the same time the extreme values can be hidden by the mean values used in the overall analysis. The aim of the in-depth analysis was therefore to identify the potential sources of the extremely high levels of air pollution found in the classrooms; and to assess the relation-ship between the extremely high pollution burden in the air in the classrooms and health symptoms among the schoolchildren.
Design of the study
Definition of extreme
indoor air concentrations
The first step in the study design was to define the range of extremely high indoor air pollution data within the SEARCH database. It is not possible to speak in ab-solute terms about extremely high concentrations com-pared to data published in the literature concerning schools in the participating countries.
Methodology
Overview of potential sources of
emissions of indoor air pollutants
Pollutants measured in the indoor air originate from both indoor and outdoor sources. It is widely recognised that the most important indoor sources of pollution in schools are building materials, furnishings, cleaning products, toiletries, stationery and humanactivities. The indoor air can also be polluted by unfiltered outdoor air containing pollutants emitted primarily by traffic and industrial facilities.
Sources of information
Valuable information was provided via two question-naires. The classroom questionnaire was used to obtain information on furnishings, consumer products, clean-ing products, stationery etc., as well as occupants’ be-haviour and indoor activities. The school questionnaire was used to gather information on building characteris-tics (building materials, floor covering, classroom size and air volume, size of openable windows etc.).
Preparation of the in-depth analysis
The indoor air pollution data collected in the course of the two SEARCH projects were available for the in-depth analysis. The starting point was to identify the extremely high levels of indoor air pollution in the classrooms. These extremely high values clearly had to be in the range of outliers, thus the first step was to define those outliers.Several approaches to identifying outliers can be found in the literature, with the recommendation to select the most appropriate method according to the subject. For the in-depth analysis of the SEARCH database, the Tukey method was considered the most appropriate. A summary of the relevant findings in the literature, the regulatory framework for IAQ, figures, the statistical evaluation process, and the associations between envir-onmental parameters and children’s health status can be found atsearch.rec.org/outcomes.
Conclusions
Potential sources of the extremely
high levels of air pollution found
in the classrooms
The in-depth analysis resulted in the identification of the following possible sources of indoor air pollutants:
•
overcrowding in the classrooms and carpets on the floor (benzene);•
water-resistant paints used on the walls (ethylbenzene);•
cleaning chemicals (toluene and formaldehyde); and•
ineffective air conditioning (CO2). The results highlight that:•
air conditioning can only be effective in combina-tion with a continuous supply of fresh air;•
fewer cleaning chemicals should be used to clean the classrooms;•
increasing the frequency and effectiveness of ventilation in school buildings could significantly contribute to improving IAQ; and•
NO2is a typical ambient pollutant, whileformaldehyde and CO2can be considered potential indoor air pollutants.
Associations between extremely
high levels of indoor air pollution
and health impacts on schoolchildren
The in-depth analysis suggests that:•
there is a high chance that polluted classroom air plays a role in causing symptoms among children;•
xylenes and NO2are among the factors causing al-lergies, and NO2may also contribute to fatigue, at-tention deficit disorder, irritability, anxiety and symptoms of depression;•
there is a significant association between PM10 and coughing every morning, and between formaldehyde and chronic cough symptoms in the last 12 months and anxiety;•
xylenes significantly increase the incidence of sleep disorders; and•
toluene and ethylbenzene contribute to the devel-opment of conjunctivitis, sinusitis and earache complications.Children’s comfort is an important personal indicator of the quality
of the indoor environment. This is particularly true of thermal
comfort, which depends on temperature, humidity and ventilation
in the classroom. Air quality has a significant impact on the
performance of children in the classroom, and is implicated
in health risks.
Evaluating children’s perceptions
In the 10 participating countries, questionnaire data were gathered by the country teams and a pooled database was created by the NEIH using STATA/SE 10.0 software for the statistical analysis. A total of 6,758 children participated in the study (49.1 percent girls and 50.9 percent boys). The gender distribution of the children was fairly similar in the 10 countries. The questionnaire can be found at search.rec.org/outcomes. Temperature, humidity and CO2 concentrations were monitored in classrooms in seven countries using the comfort questionnaire.The average age of the children who participated in the comfort assessment was around 10 years. The overall mean age was 9.82 and +/- 1.31 years. The variance in age among the countries was statistically significant. The overall time that the children who participated in the comfort assessment spent in the classroom was 24.4 hours per week, with a minimum of 21.1 hours per week and a maximum of 27.7 hours per week.
The seating distribution in the classroom in relation to door, windows, heaters or fans was similar in each country (seesearch.rec.org/outcomes).
One of the most important questions regarding the children’s perception of comfort was: “Do you like your classroom?” The distribution of answers is shown in Figure 20. More than 80 percent of the children said that they liked their classroom more or less, while 11 percent considered their classroom to be adequate. The distribution of answers related to perceived air temperature is shown in Figure 21. Around 7 percent of children felt that the classroom was not warm enough; 48 percent of the children thought that the classroom was warmer than optimal; and 44.7 percent of the chil-dren considered the temperature to be adequate. Perceived air temperatures showed an increasing trend with increasing measured air temperatures, as expected (Figure 22), although the standard deviation was very wide, demonstrating large individual variability in per-ceptions of temperature. However, the results indicate that the children perceived an optimal temperature to be between 21 and 22oC.
The questionnaire also evaluated children’s perception of air temperature in the classroom according to seat-ing in relation to windows and doors. More children sitting near a window thought the temperature to be very warm than those sitting in the middle of the room. In most of the investigated classrooms the heating sys-tem was under or close to the windows, contributing to this perception among the children.
In classrooms with open windows, significantly more children perceived the temperature as good. The per-centage of children who responded that they were dis-turbed by an open window was no different among those sitting near to (8.5 percent) or far from (8.3 cent) the window or in the middle of the room (8.4 per-cent). In classrooms with an open door, more children felt the temperature to be higher, although the differ-ence was not statistically significant. The percentage of children who responded that they were disturbed by an open door was no different among those sitting near to the window (5.3 percent), near to the door (5.3 percent) or in the middle of the room (5.4 percent).
Although there were significant differences among the countries, overall children’s attitudes to ventilation lev-els were balanced between stuffiness and draughtiness (Figure 23).
The tendency in the results of measured relative hu-midity corresponded to the perceived level of ventila-tion (Figure 24), although the relaventila-tionship was not clearly linear.
In terms of air quality, Figure 25 shows that about 11 percent of the children found the air in the classroom to be bad/not fresh, even at the beginning of the teach-ing period, and Figure 26 shows that about 28 percent of the children found it to be bad/not fresh at the end of the teaching period.
At the time the questionnaires were completed, air quality in the classroom was perceived as quite good in most of the countries. This subjective perception was well supported by the measured CO2concentrations in seven countries (Figure 27).
FIGURE 20:Distribution of responses to the question “Do you like your classroom?”
39.6 24.6 16.6 11.6 10 20 30 40 50 60 70 80 90 100 0
ALB BIH HUN ITA SRB SVK BLR KAZ UKR TJKTOTAL
Not at all No A little OK Quite like Really like Absolutely %
FIGURE 21:Distribution of responses to the question “How do you perceive air temperature in the classroom?”
13.8 5.7 28.9 44.7 % 20 40 60 80 100 0
ALB BIH HUN ITA SRB SVK BLR KAZ UKR TJKTOTAL
Cold Cool Rather cool Good Quite warm Warm Very warm
FIGURE 22:Measured mean temperature (oC) in relation
to the perceived air temperature in the classroom
Cold Cool Rather cool Good Quit e warm Warm Very warm oC 24 20 22 14 18 16 17.8 18.8 21.3 21.6 21.3 22.2 22.7
FIGURE 23:Distribution of responses to the question “How do you perceive ventilation in the classroom?”
20 40 60 80 100 0
ALB BIH HUN ITA SRB SVK BLR KAZ UKR TJKTOTAL
Very stuffy Stuffy Slightly stuffy Adequate Slightly draughty Draughty Very draughty %