Università degli Studi di Roma “Tor Vergata”
Facoltà di Scienze Matematiche, Fisiche e Naturali.
Dottorato di ricerca in Astronomia – XVII ciclo
The RR Lyrae distance scale from
Near-Infrared photometry
Massimo Dall’Ora
Coordinatore
Relatore
Prof. Roberto Buonanno
Prof. Roberto Buonanno
Tutore
Prof. Giuseppe Bono
Contents
Abstract
1
1
The Scientific Problem
7
1.1 RR Lyrae stars as distance indicators 7
1.2 The PhD project 8
2
RR Lyrae stars
12
2.1 Observational properties 12 2.2 Evolutionary properties 15 2.3 Pulsation Physics 16 2.3.1 Generalities 162.3.2 Kappa and Gamma mechanisms 19
2.4 Pulsation Periods 21
2.5 Oosterhoff dichotomy 22
2.6 The Blazhko effect 24
2.7 Mean magnitudes 25
2.8 RR Lyrae stars as distance indicators:
the MV −[Fe H/ ] relation 25
2.8.1 Pros and Cons 25
2.8.2 Outline of the current calibrations 28
2.9 RR Lyrae stars as distance indicators:
the FOBE method 30
2.10 RR Lyrae stars as distance indicators:
the PLK relation 31
2.10.1 Empirical evidence and theory 31
2.10.2 PLK relation: fine tuning 37
3
Data reduction
423.1 Near-infrared arrays 42
3.2 Array operation 43
3.3 The sky in the infrared 44
3.4 SOFI – Son OF ISAAC 46
3.4.1 Optical arrangement 46
3.4.2 The Detector 49
3.5 Observational techniques in the IR 49
3.6 Data pre-reduction 50
3.7 Photometric reduction 52
3.7.1 Overview 52
3.7.2 Calculus of the PSF – DAOPHOT 53
3.7.3 Photometry – ALLFRAME 54
3.7.4 The photometric calibration 56
4
Observations and Color Magnitude Diagrams
614.1 The LMC Cluster Reticulum 61
4.1.1 Introduction 61
4.1.2 Observations and data reduction 61
4.1.3 Color-Magnitude Diagram 65
4.2 The Galactic Globular Cluster M68 66
4.2.1 Introduction 66
4.2.2 Observations and data reduction 67
4.2.3 Color-Magnitude Diagram 70
4.3 The Galactic Globular Cluster NGC 3201 71
4.3.1 Introduction 71
4.3.2 Observations and data reductions 73
5
Discussion of the results: distance estimates
775.1 The distance to Reticulum 77
5.2 The distance to LMC 84 5.3 The distance to M68 86 5.4 The distance to NGC 3201 91 5.5 The RGB Bump 95
Conclusions
97
Bibliography
101
Acknowledgments
107
Abstract
The work carried out in this thesis is part of a long-term project aimed at measuring accurate near-infrared magnitudes of RR Lyrae stars in a sample of Galactic globular clusters that cover a wide metallicity range (−2.3 [≤ Fe H/ ]≤ −1.3) and host a sizable population of RR Lyrae stars (NRR≥10).
In this thesis we will present the result obtained for the Galactic globular clusters M68 and NGC3201, and for the Large Magellanic Cloud cluster Reticulum. The results for these clusters are all based on the observations carried out with SOFI/NTT.
The data collected allowed us to provide accurate estimates of J, K mean magnitudes for a large portion of the cluster RR Lyrae variables, and in turn to derive in a homogeneous context the slope of the K-band Period-Luminosity relation (PLK). The slope of the observed PLK relation agrees quite well with theoretical pulsational predictions. On the basis of this agreement between our empirical PLK relations and the theoretical ones, we adopted the latter for estimating the absolute distances to the target clusters. The distances obtained for M68, NGC 3201, and Reticulum disclose a fairly good agreement with the most recent and accurate independent estimates (Baade-Wesselink calibration, FOBE method, δ Scuti Period-Luminosity relation).
Current data, together with near-infrared data already collected, will allow us to accomplish the following goals:
• to derive, on the basis of the new empirical calibration of the PLK , absolute distances for field RR Lyrae stars for which are available mean K magnitudes and to compare them with distances based on Baade-Wesselink method;
• to provide, on the basis of predicted and observed PL(J-K)relations, independent estimates of the reddening toward the target clusters;
• to supply an independent test on a wide metallicity range of the accuracy of both evolutionary and pulsational predictions adopted to construct the PLK and the PL(J-K) relations;
• to obtain accurate optical/near-infrared Color-Magnitude diagrams (CMDs) for the target clusters by adopting the new data and the optical data available in the literature.
These CMDs will allow us to compare theory and observations by using color indexes (V-J), (V-K), which are only marginally affected by systematic uncertainties;
• to use (V-K) colors to derive accurate estimates of the effective temperatures of the globular clusters RR Lyrae stars, which in turn can be used to provide an estimate of the helium abundance. This result is particularly interesting, because globular clusters are among the oldest objects that can be found in the Galaxy, and therefore the estimated helium estimates can give a hint on the primordial helium abundance.
Chapter 1
The Scientific Problem
1.1 RR Lyrae stars as distance candles
Since the first trigonometric distance measurement performed by Bessel on the star P Cygni in 1838, one of the major problems in the Galactic and in the extragalactic astronomy is the development of robust methods to provide accurate estimates of the cosmic distances. Together with the development of the spectroscopic observations, Astronomy became Astrophysics with the advent of distance measurements, the third dimension in our vision of the sky. Indeed, the knowledge of the physics of the celestial objects, and of the Universe as a whole, is tied to the knowledge of the absolute distances.
Connected to the distance scale problem is the building of a comprehensive framework of the formation and evolution of the galaxies, and first of all of the Milky Way. Indeed, the calibration of robust standard candles allows us to trace the 3-D structure of our system and of the group of galaxies to which the Galaxy belongs, the Local Group. Moreover, correct estimates of the stellar distances allow us, via a comparison with the theoretical models of stellar evolution, to give an idea of the ages of the stellar populations and, together with chemical abundances, to trace back the history of their formation and evolution.
In this context, RR Lyrae stars are particularly important, since they are standard candles that can be observed in all the old components of the stellar systems: Galactic and extragalactic globular clusters, Galactic halo, Galactic Bulge, ancient populations of the nearby galaxies, such as the Magellanic Clouds and the dwarf spheroidal galaxies of the Local Group. These systems were among the first formed in the Universe, and therefore it is crucial to have accurate estimates
of their distances and ages, in order have strong constraints on the formation and evolution of the structures in the Universe.
Without entering into a detailed discussion on the calibration of the standard candles, here we mention only the fact that the use of the RR Lyrae stars as distance indicators is still hampered by several uncertainties, both on the empirical and on the theoretical side, mainly connected to the dependence of their absolute V-band magnitude on the chemical composition and on the uncertainty on the evolutionary status. Current uncertainties on the absolute visual magnitude of the RR Lyrae stars are of the order of 0.2-0.3 mag. Details will be given in chapter 2.
At the same time, RR Lyrae stars in the photometric K-band (centered on the effective wavelengthλeff =2.2µm) do obey to a tight linear period-luminosity relation (PLK). This relation offers several advantages, both theoretical and observational, when compared to other techniques. Once calibrated, this relation could be a powerful and sound tool to gain accurate and homogeneous distances for old stellar components.
1.2 The PhD Project
The main goal of this thesis project is to substantially improve the distance estimates to the globular clusters with the PLK relation. Results have been produced for two Galactic globular clusters, namely M68 and NGC 3201, and for the Large Magellanic Cloud cluster Reticulum.
Data presented in this thesis work are part of a more general project, which has a threefold objective:
• we still lack an extensive K-band observational database for RR Lyrae stars. Indeed, empirical estimates of the PLK relation have been published only for nine Galactic globular clusters: M3, M4, M5, M15, M107, NGC 3201, NGC 5466, Ω Cen (Longmore et al. 1990), and IC 4499 (Storm 2004); M3 was observed also by Butler (2003). Unfortunately, the Longmore et al. (1990) measurements are heavily affected by observational uncertainties such as crowding, since their photometry was carried out with a fixed-aperture photometer and the derived PLK for the single clusters have uncertainty of the order of 10-15% on the slope. Butler (2003) observed only seven RR Lyrae stars in the innermost regions of the Galactic globular cluster M3. Storm used single-epoch
average, by an error of the order of 10%. The fist objective of our project is therefore to supply a homogeneous photometric database to derive an accurate estimate of the empirical PLK;
• theory predicts a non-negligible dependence of the PLK on the chemical composition, which translates in a different zero-point of the relation. Therefore, to proper compare results for RR Lyrae stars of different chemical composition, it is of paramount importance to test theoretical predictions with observations. The test can be performed by comparing the observed PLK relations for sizable samples of chemically homogeneous RR Lyrae stars with the PLK relations predicted by theory. The ideal targets for such a comparison are the globular clusters, both Galactic and extragalactic, since they are coeval and chemically homogeneous stellar populations, and their stars can be all considered at the same distance;
• once an accurate empirical PLK has been obtained and a comparison with the predicted
PLK has been performed to investigate the dependence of the relation on the chemical composition, we plan to use the PLK relation to achieve accurate distance estimates for cluster and field RR Lyrae stars, belonging to several old stellar populations.
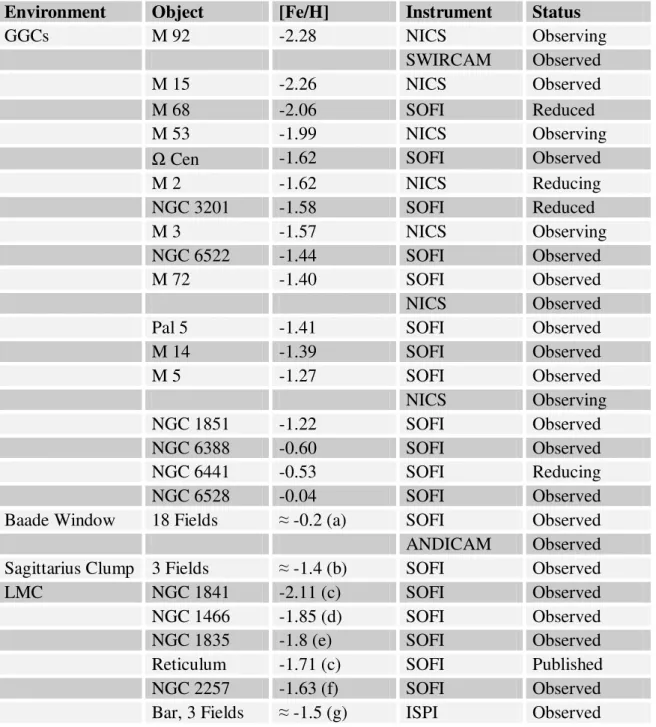
Specifically, the environments for which data have been already collected are:
1. Galactic Globular Clusters (GGCs). Data have been collected for 17 globular clusters that cover a wide range in chemical content. Since the method yields absolute distances, absolute ages can be inferred, giving a lower limit to the age of the Galaxy and of the Universe. Moreover, the selected clusters span a wide range in metallicities, allowing a meaningful test of the metallicity-dependence of the PLK.
2. Galactic Bulge. Although the distance to the Galactic center is a fundamental parameter, used, for example, in the dynamical models of the Milky Way, its determination is still hampered by several uncertainties (Reid 1993). One of the main sources of error in the distance estimates of the Galactic center is the uncertainty on the strong (and differential) absorption, which translates into errors of the order of 10% in the estimates of the de-reddened magnitudes. However, PLK relation constitutes a robust diagnostic to achieve distances for RR Lyrae stars in the Bulge, since the absorption in the K-band is only the 10% of the absorption in the V-band.
3. Galactic Halo. Empirical evidence (Vivas et al. 2001) shows that RR Lyrae stars of the Galactic Halo have a clumpy distribution. Data have been collected for three fields, and they should provide information both on the distance and the structure of the clumps. One of these clumps could be the sign of the accretion by the Galaxy of the Sagittarius dwarf galaxy and the others could be the relic of the globular cluster Pal 5. On the basis of the estimates of the RR Lyrae distances, it should be possible to assess whether the first of the observed fields is the relic of the Sagittarius dwarf (Helmi & White 1999; 2001), and to check if the other two fields are connected to the tidal debris of the globular cluster Pal 5. 4. Large Magellanic Cloud (LMC). LMC is the first ladder in the extragalactic distance
scale, and therefore it is of paramount importance to get an accurate distance estimate of its center, as well as of its 3-D structure. Our dataset includes 5 globular clusters, located in different positions along this galaxy, and 3 pointings along the central bar, with about 150 field RR Lyrae stars expected. This dataset should provide an estimate of the distance and of the geometry of the LMC with an unprecedented accuracy.
Table 1.1 summarizes the complete dataset.
Environment Object [Fe/H] Instrument Status
GGCs M 92 -2.28 NICS Observing
SWIRCAM Observed
M 15 -2.26 NICS Observed
M 68 -2.06 SOFI Reduced
M 53 -1.99 NICS Observing
Ω Cen -1.62 SOFI Observed
M 2 -1.62 NICS Reducing NGC 3201 -1.58 SOFI Reduced M 3 -1.57 NICS Observing NGC 6522 -1.44 SOFI Observed M 72 -1.40 SOFI Observed NICS Observed
Pal 5 -1.41 SOFI Observed
M 14 -1.39 SOFI Observed M 5 -1.27 SOFI Observed NICS Observing NGC 1851 -1.22 SOFI Observed NGC 6388 -0.60 SOFI Observed NGC 6441 -0.53 SOFI Reducing NGC 6528 -0.04 SOFI Observed
Baade Window 18 Fields ≈ -0.2 (a) SOFI Observed
ANDICAM Observed
Sagittarius Clump 3 Fields ≈ -1.4 (b) SOFI Observed
LMC NGC 1841 -2.11 (c) SOFI Observed
NGC 1466 -1.85 (d) SOFI Observed
NGC 1835 -1.8 (e) SOFI Observed
Reticulum -1.71 (c) SOFI Published
NGC 2257 -1.63 (f) SOFI Observed
Bar, 3 Fields ≈ -1.5 (g) ISPI Observed
Table 1.1. The complete dataset available for this project. Metallicities for Galactic Globular Clusters are from the catalogue by Harris (1996). (a) Alves (2000); (b) Pal 5 value adopted (Harris 1996); (c)Suntzeff et al. (1992); (d) Walker (1992); (e) Walker (1993); (f) Dirsch et al. (2000); (g) Gratton et al. (2004), mean value.
Chapter 2
RR Lyrae stars
RR Lyrae stars are low-mass, radially pulsating variable stars, typical of old stellar populations. Since their discovery, occurred at the end of the 19th century by S. Bailey (Pickering & Bailey 1895), it was recognized that their mean V magnitude is almost constant. This occurrence, together with the fact that they are moderately bright (≈40L⊙), ubiquitous in all the stellar systems hosting an old population, and easily recognizable from their light curve, make them attractive as distance indicators.
2.1 Observational properties
RR Lyrae stars appear as bright giants stars, with spectral types ranging from A to F (Smith 1995), which show regular light variations. Radial velocities curves, together with the Baade-Wesselink analysis, demonstrate that the light variation is connected with a periodic variation in the radius of the structures (fig. 2.1).
The three observable quantities, without considering spectra, are magnitudes, pulsation period, and pulsation amplitudes. Magnitudes and color indexes can be adopted to derive the Color-Magnitude-Diagram (CMD, figure 2.3), where at fixed age (which fixes the evolving masses) and chemical composition the position depends on the luminosity and on the effective temperature. Periods and luminosity amplitudes can be arranged in the so-called Bailey’s diagram, and they are linked to the structural parameters mass, luminosity, effective temperature and chemical composition. CMDs show that RR Lyrae stars are located in a well-defined region that is the intersection of the Horizontal Branch, which is populated by core helium-burning structures, with the Cepheid Instability Strip (IS), one of the regions of the CMD where stars are pulsationally stable. The physical reasons for the pulsation instability will be discussed in section 2.3. Bailey’s diagram shows that RR Lyrae stars populate two distinct regions: this occurrence, together with the different shape of light curves, led to the classification of RR Lyrae in three
different types, namely a-type, b-type and c-type (Bailey & Pickering 1902). Subsequently a-type and b-type variables where recognized as a single class, leading to the current classification in RRab and RRc type stars. RRab stars are characterized by “saw-tooth” light curves, with steep rise and less steep decline; RRc have almost sinusoidal light variations. Schwarzschild (1940), on the basis of theoretical models, realized that RRab pulsate in the fundamental mode, while RRc stars are first-overtone pulsators.
Figure 2.1 Behavior of the light curve (upper panel) and of the radial velocity curve for a typical radial pulsator. The dashed line in the lower panel shows the atmospheric zero velocity: the non vanishing value is due to the radial component of the motion of the star. The plot clearly shows that light variations are due to variations in the radial velocity, i.e. to a radially moving atmosphere. Figure from Rose (1973).
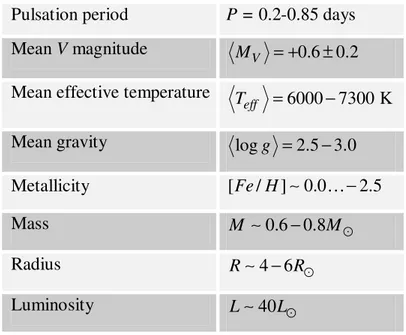
Figure 2.2 shows the Bailey’s diagram for RR Lyrae stars in the Galactic Globular Cluster M5 (upper panel) and their position in the (B-V)-V CM diagram (lower panel). As shown in the figure, RRc type stars are bluer (i.e. hotter) than RRab stars. Finally, it is worth noting that amplitudes and periods are not quantities affected by usual observational uncertainties, such as distance and reddening. Table 2.1 summarizes the average properties of RR Lyrae stars.
Pulsation period P = 0.2-0.85 days
Mean V magnitude 0.6 0.2
V
M = + ±
Mean effective temperature 6000 7300 K
eff
T = −
Mean gravity logg =2.5 3.0−
Metallicity [Fe H/ ]∼0.0…−2.5
Mass M ∼0.6 0.8− M⊙
Radius R∼4 6− R⊙
Luminosity L∼40L⊙
Table 2.1. Main physical properties of RR Lyrae stars. Table adapted from Smith (1995).
Figure 2.2. Upper panel: Bailey’s diagram for the RR Lyrae stars in M5. RRab and RRc stars are located into twodifferent locations in this plane. Lower panel: the same stars in the CM diagram. Filled and open circles depict RRab and RRc stars, respectively. The two solid lines display the predicted edges of the Instability Strip, which hosts RR Lyrae stars. Plot from Caputo et al. (1999).
2.2 Evolutionary properties
Stars with masses ranging between 0.5 and 3 M⊙ are usually referred as low-mass stars (V. Castellani, in preparation). These stars spend a substantial fraction of their life burning hydrogen in their cores. In the CM diagrams, stars in this evolutionary status arrange themselves into a mono-parametric sequence, called the Main Sequence (MS, fig. 2.3). If a simple stellar population is considered (i.e. stars coeval, sharing the same chemical composition and at the same distance), the positions of the stars along the MS depend on stellar mass, being stars with lower masses fainter and cooler. The MS phase ends when stars exhaust the most (about 90%) of their central hydrogen. Starting from this point, the He core contracts and becomes electron-degenerate, and the outer envelope expands, while the Hydrogen is still burning in a shell: stars begin the so-called Red Giant phase, and in the CMD they climb the Red Giant Branch (RGB). During this evolutionary stage, the helium-core increases its mass with the helium produced in the hydrogen-burning shell, heating up. The outer envelope expands more and more, and red giants become brighter. The RGB phase ends when cores are massive enough (about 0.5 M⊙) to
effectively ignite the helium burning (at a temperature of10 K ), via the 3α process. The ignition 8 of the 3α abruptly removes the electron degeneration and produces a phenomenon called the helium-flash. In the CMD, stars leave the RGB and they place themselves along the Zero Age Horizontal Branch (ZAHB), a sequence characterized by a constant luminosity, and by a spread (≈30, 000 K) in temperatures. Now, since the RGB phase is faster (of about a factor 30-100) than the MS phase, at the tip of the RGB, where the helium flash is produced, stellar masses tend to be the same. Therefore, if no other phenomenon occurs, stars should arrange themselves into a narrow sequence in the ZAHB. Oddly enough, CMDs for several Galactic Globular Clusters show extended HBs, thus suggesting the occurrence of a spread in the envelope masses, produced by mass-loss phenomena. However, it is worth noting that the observed spectra on RGB stars suggest a smaller rate for the mass-loss than that required to explain the observed temperatures spread along the HB. The spread in the temperatures is therefore a spread in the envelope masses, with smaller masses on the blue side of the ZAHB. Starting from ZAHB, stars evolve off-ZAHB, following their evolutionary tracks and becoming more luminous. Figure 2.4 shows that, at a fixed metallicity, there is a fixed range of the stellar masses for which an HB star shows up as a RR Lyrae star, since its position on the ZAHB is inside the IS, while stars with masses smaller or
larger of this range can enter the IS during their evolution, from the hot side or from the cool side, respectively. Evolved RR Lyrae stars are more luminous than ZAHB up to 0.25 mag in the V-band, and this is an important point to take into account when they are used as distance indicators (Bono 2003; Cacciari & Clementini 2003).
Figure 2.3. Color-Magnitude diagram for the Galactic Globular Cluster M3. The principal evolutionary phases, discussed in the text, are labeled. The two solid lines on the HB mark the edges of the Instability Strip. Blue Stragglers (see CMDs in chapter 4) are labeled with BS. Photometry from Buonanno et al. (1994).
2.3 Pulsation physics
2.3.1 Generalities
The main aim of the pulsation theory is to describe the physics of pulsations and to explain why some stars pulsate and some others do not. This approach is based on an artificial perturbation of a static stellar envelope, leaving the equilibrium condition, and to investigate whether the perturbation grows or it is damped. From first linear computations (Zhevakin 1953), more and more sophisticated codes have been developed: at the present time, linear, non-local, time-dependent convective treatment of stellar pulsation can predict not only periods and
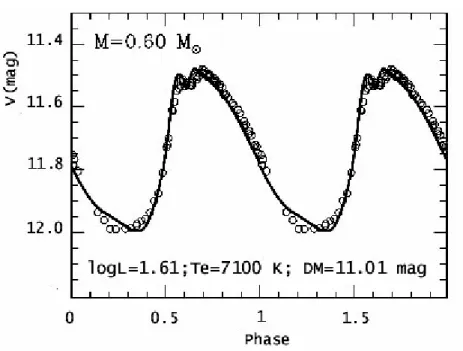
pulsation amplitudes, but also the observed light curves (Bono, & Stellingwerf 1994; Bono et al. 1997). Figure 2.5 shows the agreement between models and observations for the RR Lyrae star U Comae (Bono, Castellani, & Marconi 2000). Moreover, theoretical models reproduce the position and the width of the IS in the CM diagram, and its topology. As shown in the fig. 2.6, the IS is made of a region populated by fundamental pulsators, limited by the Fundamental Blue Edge (FBE) and the Fundamental Red Edge (FRE), and a region populated by first overtone pulsators, marked by the First Overtone Blue Edge (FOBE) and the First Overtone Red Edge (FORE). The two regions intersect in the OR zone, where either fundamental or first overtone pulsators can exist. According to current empirical and theoretical evidence, this region is crucial to explain the so-called “Oosterhoff dichotomy”, (see section 2.5). Moreover, the OR zone can be populated by stars which simultaneously pulsate in the fundamental and in the first-overtone: these stars are called RRd stars (Nemec 1985).
Figure 2.4. Evolutionary track (solid lines) for low-mass stars, for three different metallicities. Outer dashed lines mark the edges of the Instability Strip, while the inner lines mark the edges of the fundamental pulsators, the first-overtone pulsators, and the OR zone (see section 2.3 for details). Plot from Bono et al. (1997).
Figure 2.5. Comparison between observations (empty circles) and theoretical prediction (solid line) for the light curve of the RR Lyrae star U Comae. Physical parameters used for the fit are listed. Figure adapted from Bono, Castellani, & Marconi (2000).
Figure 2.6. Topology of the Instability Strip. Outer edges of the IS are the FOBE on the hot side, and the FRE on the cool side. FBE and FORE mark the blue edge and the red edge of the fundamental and first overtone pulsators, respectively. The two regions intersect in the OR region, where the two pulsational modes can exist. Plot from Bono, Caputo, & Marconi (1995).
2.3.2 Kappa and Gamma mechanisms
The physical mechanism at the basis of the stellar pulsation was suggested in 1926 by Eddington, who called it the “valve mechanism”. The idea is to see if a layer in the atmosphere releases heat during the compression stage, or retains it. In the latter case, the layer contributes to the instability of the structure. Such a behavior is tied to the opacity κ of the layer. When a
Kramer opacity is considered,κ ∼ρr /Ts, r≈1 and s≈3.5 for a layer where no important element is undergoing partial ionization. This means that during an adiabatic compression the opacity decreases, since
[
( 1)]
d dT r s T κ γ κ = − −and γ ≥4 / 3 is the adiabatic coefficient. Thus, the heat is released and the layer is pulsationally unstable. However, in a region where an abundant element is partially ionized, s becomes very small or even negative, and the opacity increases with the temperature (King & Cox 1968). This accounts for the Eddington’s valve, and it is called the κ−mechanism. Zhevakin (1953; 1959) singled out that the layer responsible of the instability is the zone of second ionization of helium (in a range of temperature between 30,000 and 60,000 K). This result was subsequently confirmed by Baker & Kippenhahn (1962) and by Cox (1963). Therefore, the pulsation instability is a phenomenon that interests only the outer layers of the stellar atmosphere. Theory also shows that HeI and the H ionization layers, at temperatures of 13,000 and 17,000 K respectively, play a role in the onset of the pulsations (e.g. Bono & Stellingwerf 1994). Figure 2.7 shows the structure of a HB stars, with the stratification in mass, density, and temperature. Ionization zones for H and HeI are also depicted.
The second main mechanism, connected with the ionization zones in RR Lyrae stars, that contributes to the instability is the γ−mechanism. In this case, the energy that normally would raise the temperature is absorbed by the ionizing matter, lowering the adiabatic exponent γ. Therefore, the layer tends to absorb heat during compression, leading to a driving force for the pulsations (King & Cox 1968). It is evident that the two mechanisms are connected each other.
Figure 2.7. Internal structure for a 0.625M ⊙ Horizontal Branch star. Stratification in mass, density and temperature is shown. Helium and Hydrogen ionization zones are also shown. Figure from Iben (1974).
As previously outlined, RR Lyrae stars can pulsate in the fundamental or in the first overtone. Models show that the choice of the pulsation mode relies on the minimization of the integral of the mechanical work needed to keep that mode pulsationally stable: starting from the FOBE, at a fixed luminosity level, the condition of minimum energy supports the first overtone, which is characterized by a “node” (a zero-velocity layer) in the atmosphere. Moving to the cooler side of the IS, the node moves toward layers of smaller density, until it reaches a layer of too low density and disappears. Therefore, the star switches to fundamental mode (Bono & Stellingwerf 1994).
It has also been claimed that RR Lyrae can pulsate in the second overtone mode (e.g. Demers & Wehlau 1977; Soszynski et al. 2003). Unfortunately, no definitive observational
evidence is available, nor the second-overtone RR Lyrae stars, sometimes called RRe, are predicted by theory.
The last aspect that pulsation physics is able to explain is the width of the IS in the HR diagram: stars bluer than the FOBE cannot pulsate because the ionization zone is too close to the surface, thus its envelope mass is too low to effectively retain heat and to act as a valve; on the other side, on the red edge, convection quenches the pulsation mechanism (Smith 1995). It is worth noticing that the FOBE is well defined by theory, so that it is possible to use the FOBE location in the CMDs as a distance indicator (Caputo 1997; Caputo et al. 2000), while the position of the FRE depends on the assumptions adopted to treat the convective transport.
2.4 Pulsation Periods
Pulsation periods are fundamental quantities in stellar pulsations, since they are: a) well-defined observables, which can be measured with high accuracy and do not depend on distance and reddening; b) well-defined theoretical quantities, predicted with good accuracy even with the simplest models. Indeed, since first calculations by von Ritter (1879), it is known that the period
P of pulsation and mean density ρ are related by
P ρ =Q
where Q is the pulsation constant. If ρ is written as ρ=M R/ 3(where M is the total mass, and R
is the radius), and R is written asR∝ LT−4 , it results that
3 1
log log log 3log
4 2 e
P=const+ L− M − T
At the present time, non-linear, non-local, time dependent convective models predict
log 11.066( 0.002) 0.832 log 0.650 log 3.363log
log 10.673( 0.001) 0.805log 0.603log 3.281log
F e FO e P L M T P L M T = ± + − − = ± + − −
for fundamental and first overtone pulsators, respectively (Marconi et al. 2003). It is worth mentioning that these two equations are not directly comparable with observations, since L, M, and Te are not observable quantities. Observations yield magnitudes and colors, which can be related to luminosities and effective temperatures via bolometric corrections and color-temperature transformations. Stellar masses are estimated from evolutionary predictions. For example, using B, V photometry and transforming the equations above in the observational plane, one obtains log 0.612( 0.002) 0.340 0.663log 1.307( ) log 0.762( 0.001) 0.340 0.643log 1.381( ) F V B V FO V B V P M M M M P M M M M = − ± − − + − = − ± − − + −
where MV and MB are the absolute magnitudes in the V and B bands, respectively.
In fact, there is only one case in which masses can be estimated directly from the theoretical equations, and this is the case of the mixed-mode (RRd) pulsators: indeed, the pulsator must obey to the same time two equations, therefore individual masses can be inferred from, provided that luminosities and temperatures are estimated from observations.
In some cases it is useful to consider together fundamental and first overtones pulsators: in these cases, first overtones are “fundamentalized”, i.e. the constant 0.127 (the mean difference between
logPFandlogPFO) is added to their logPFO (Di Criscienzo, Marconi, & Caputo 2004). A more accurate relation is logPF =0.147 1.033log+ PFO (Marconi et al. 2003).
2.5 The Oosterhoff dichotomy
It has long been known (Oosterhoff 1939) that Galactic globular clusters can be classified in two distinct groups, on the basis of the mean period of their RRab pulsators and on the percentage of RRc stars with respect to the total number of RR Lyrae stars (fig. 2.7, right panels). Oosterhoff type-I clusters (OoI) are characterized by a smaller number of RRc stars (20%) and by a shorter RRab mean period, <Pab>=0.55 days. The prototype of this class is the GGC M3. OoII clusters show a larger number of RRc pulsators (40%) and a longer RRab mean period,
0.64 Pab
Subsequent works have highlighted that, besides such dichotomy, OoI and OoII GGCs show also a dichotomy in the metal content, having OoI clusters a metallicity higher than OoII ([Fe/H] ~ -1.5 vs. ~ -2; Kinman 1959).
The dichotomy in mean periods has been explained with a difference in luminosities: indeed, from the equations of pulsation, longer periods imply higher luminosities, the other parameters being fixed. This explanation is known as the Sandage’ “period shift effect” (e.g. Sandage 1990). The main problem with this interpretation is that it is at odds with predictions of evolutionary theories and with chemical enrichment models: indeed, to have higher luminosities, OoII clusters should have higher helium fraction than OoI clusters, therefore showing an anti-correlation between helium and metals content (Gratton, Tornambè, & Ortolani 1986).
Figure 2.7. Left panels: fundamentalized periods histograms for the GGC’s M 15 and M 3. The fraction of RRc stars changes when moving from OoI clusters (M 3) to OoII clusters (Oo II). Right panels: distribution of the mean periods of RRab stars of a sample of Galactic Globular Clusters as a function of the metallicity. In the upper panel it is evident the dichotomy of the distribution; such a dichotomy disappears when fundamentalized periods are used (lower panel). Figure from Castellani, Caputo, & Castellani (2003).
on the evolutionary path in the IS. In this model, RRab stars that enter the OR zone from the red side, save their pulsation mode until they reach the FBE; conversely, RRc stars that enter the OR zone from the blue side keep the pulsating first overtone mode until they reach the FORE. Therefore, if the OR zone is populated mainly by RRab stars, and since period is a strong function of temperature, <Pab> will be shorter and the cluster will be an OoI type; on the other hand, if the OR zone is populated mainly by RRc stars, <Pab> will be longer and the cluster will be an OoII type. It is worth noting that with the Sandage’s hypothesis, the difference is on a star-by-star basis, while with the Van Albada & Baker mechanism the difference arises from sample properties. A test of this latter hypothesis can be made using the fundamentalized periods: if the hysteresis mechanism is correct, then the difference between OoI and OoII clusters should disappear, because the difference in the period distribution between RRab and RRc stars disappears. Indeed, figure 2.7 (panels a and b) shows that fundamentalized periods are the same from [Fe/H] ~ -2.2 to ~ -1.5, hence supporting the hysteresis mechanism.
At the present time, Oosterhoff dichotomy seems to be a phenomenon connected only with the Galaxy, since other galaxies in the Local Group show intermediate properties between the two Oosterhoff types (as in dwarf spheroidals, Mateo 1998; Dall’Ora et al. 2003, and references therein), or a continuum in the RR Lyrae pulsation properties as in the Large Magellanic Cloud (Smith 1995; and references therein).
2.6 The Blazhko effect
The so-called “Blazhko effect” (Blazhko 1907) is a modulation of the light curves (changes in the maxima and minima), with a periodicity that ranges from about ten to few hundreds days, that seems to affect mainly RRab stars.
The physical reasons of such a modulation are still unknown. Here, we mention the phenomenon because it complicates the estimate of the mean magnitudes and colors of the observed RR Lyrae stars, i.e. the quantities that are compared with theoretical predictions.
2.7 Mean magnitudes
In comparing observations with theory, it is important to bear in mind that magnitudes and colors used in the theoretical relations are static, i.e. they are the magnitudes and the colors that the star would have if it was a static star. Magnitudes and colors derived from observations are
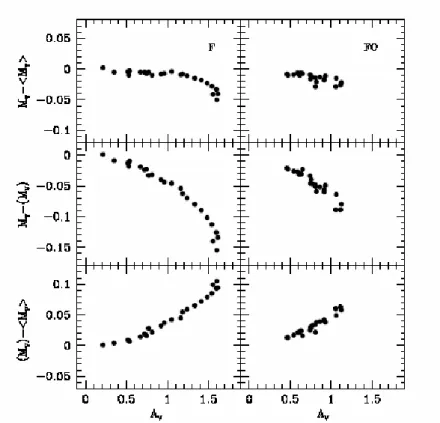
mean quantities, obtained averaging in some way the observed light curves. Usually, the average can be performed in magnitudes or in intensities. Figure 2.8 shows the differences in the V band between static and mean magnitudes, averaged both in intensities and in magnitudes, and between magnitude-averaged and intensity-averaged magnitudes as a function of the amplitude, for fundamental (left panels) and first-overtone pulsators (right panels).
Figure 2.8 discloses that the key element that governs the differences is the morphology of the light curves, i.e. large-amplitude, asymmetrical light curves tend to produce larger differences, while low-amplitude, sinusoidal light curves show almost negligible differences between static and averaged quantities. This follows from the fact that in calculating the averages, a logarithmic and a more sensible linear scale are adopted for the magnitude-averaged and for the intensity-averaged quantities, respectively. Since, at fixed effective temperature, the amplitude decreases from B to near-infrared bands, it follows that in the K-band these differences are marginal.
2.8 RR Lyrae stars as distance indicators: the MV-[Fe/H] relation
2.8.1 Pros and Cons
As previously outlined, RR Lyrae stars are excellent distance indicators for old stellar populations, since they are bright, are easily recognizable and show an almost constant V magnitude. Usually, V band luminosity of the RR Lyrae stars is calibrated as a linear function of the metallicity [Fe/H]:
[ / ]
V
Figure 2.8. Upper panels: differences between static and intensity-averaged mean magnitudes in the V-band for Fundamental (F) and First Overtone (FO) pulsators as a function of the pulsation amplitude. Middle panels: the differences between static magnitudes and magnitude-averaged mean magnitudes. Lower panels: differences between magnitude-averaged mean magnitudes and intensity-averaged mean magnitudes. Plot from Marconi et al. (2003)
This relies on the fact that V magnitudes and [Fe/H] ratios are easy observables, but unfortunately no general agreement has still been reached both on the slope and on the zero point of this relation. Indeed, recent evaluations for α cover an interval of about 0.3 mag, while the
values of the slope β range from ~0.13 to ∼0.30 mag dex-1(Di Criscienzo, Marconi, & Caputo 2004). Moreover and even more importantly, theoretical calibrations of the (MV-[Fe/H]) relation supply magnitudes that are systematically brighter ≈ 0.15 mag than empirical calibrations, revealing the existence of poorly-known systematic effects. As a consequence, at given metallicity, a spread is found up to ≈0.3mag (Bono et al. 2003, Bono, 2004). The use of the (MV
• evolutionary effects: theoretical models yield the luminosity on the Zero Age Horizontal Branch. However, during their evolution, RR Lyrae stars become brighter, introducing an uncertainty in the V magnitude up to 0.25 mag. Moreover, theoretical and empirical evidence suggest an increase in the spread of the intrinsic ZAHB luminosity moving from metal-rich to metal-poor GGCs. Therefore, actual luminosity of RR Lyrae stars depends on their evolutionary status, as well as on the ZAHB morphology. This problem is even more striking with field RR Lyrae stars, for which no evidence on their evolutive status is available;
• linearity: as evidenced in Castellani, Chieffi, & Pulone (1991), Caputo et al. (2000), and Layden (2002), the (MV-[Fe/H]) relation is not strictly linear, but there is a change of slope at [Fe/H] ~ -1.5. A quadratic curve seems to be more appropriate to fit the data. It is worth noting, however, that recent photometric and spectroscopic observations (Clementini et al. 2003) in the LMC do not confirm the change of slope at [Fe/H] ~ -1.5;
Figure 2.9. Distribution of the mean absolute V-magnitudes as a function of the metallicity for a sample of Galactic globular clusters. Filled triangles depict OoI clusters, while filled circles mark OoII clusters. Solid lines show the change of slope in the MV −[Fe H/ ]relation. Plots have been produced for a solar-scaled composition (f=1, lower panel) and for an αα-enhanced chemical αα
• metallicity: usually, the metal content of the stars is evaluated with the iron-to-hydrogen ratio [Fe/H], with the implicit assumption that other elements change in lockstep with iron; this assumption appears to be too simplistic, since it is known that metal-poor stars show an overabundance of the α-elements (the so-called α-enhancement) with respect to iron (see, e.g., King 1999). RR Lyrae spectra are quite complex (Smith 1995; Bono 2003 and reference therein) and hence it is difficult to estimate their [Fe/H] content; moreover, such estimates are usually based on the Preston’s ∆s index (Preston 1959), or on the hk index (Anthony-Twarog et al. 1944; Rey et al. 2000): the main problem is that such indexes are based on the calcium abundance, which is an α-element. Finally, there is the fundamental problem of the calibration of the metallicity scale: the Zinn &West (1984) and the Carretta & Gratton (1997) scales show in the intermediate metallicity range a difference of the order of 0.2 dex (Rutledge, Hesser, & Stetson 1997; Kraft & Ivans 2003). Note that the zero-point of the MV-[Fe/H] relation is generally estimated at [Fe/H]=-1.5, and therefore current uncertainties on the metallicity scale might introduce an error of the order of 0.04 mag. However, Kraft & Ivans (2003) proposed a new metallicity scale, which agrees quite well with the Zinn & West scale in the range
1.7 [Fe H/ ] 1
− < < − , but it gives metal abundances that are 0.2–0.3 dex lower at both higher and lower metallicities.
2.8.2 Outline of the current calibrations
Without entering into a detailed discussion, current calibrations can be divided in two groups: the “observational route” and the “theoretical route” (Smith 1995). In the first group mainly fall calibrations based on statistical parallaxes solutions (in which distance-dependent proper motions or proper motions dispersions are compared with the distance-independent radial velocities or radial velocities dispersions), Baade-Wesselink solutions (in which the linear radius variation, estimated from the velocity curve, is compared with the angular radius variation, estimated from the light curve), main sequence fitting of Galactic globular clusters and calibrations based on independent distance estimates of the Large Magellanic Cloud. Following Cacciari & Clementini (2003, and references therein), statistical parallaxes give
0.78 0.12
V
[
]
(0.20 0.04) / 0.98( 0.05) V
M = ± Fe H + ± (Fernley et al 1998); main-sequence fitting yields
results such as MV(RR)=0.61( 0.07)± mag at
[
Fe H/]
= −1.5(Gratton et al. 2003). Calibrations of the absolute magnitude of the RR Lyrae MV(RR)based on the distance of the LMC have to been consciously considered, since the distance of LMC is mainly fixed on the Cepheids Period-Luminosity relation, but its zero-point is calibrated with the Galactic Cepheids. Moreover, the Cepheids PL relation may not to be universal, as e.g. suggested in Tammann, Sandage, & Reindl (2003), but could have a dependence on the metallicity (Romaniello et al. 2005; and references therein). For the theoretical route, HB models still depend on the input physics, and the calibrations based on them show a spread up to 0.2 mag, as illustrated in figure 2.10. Theoretical calibrations can be based not only on the evolutionary models, but also on the pulsation models: this point will be discussed in the next two paragraphs.Figure 2.10. Absolute V-magnitudes for HB models as a function of the metallicity. Different models are plotted, with different input physics. The spread is up to ≈ 0.25 mag. Plot from Cacciari & Clementini (2003).
2.9 RR Lyrae stars as distance indicators: the FOBE method
Non-linear, non-local, time-dependent pulsation theory predicts with good accuracy the blue edge of the IS, since the uncertainty on the convection efficiency, usually treated with the free parameterl H/ p, is small compared to the red edge of the IS. Indeed, current models predict, forl H/ p =1.5 and for a fixed Z=0.001, that the absolute magnitude of the FOBE is
1.193( 0.034) 2.230 log 2.536 log
FOBE FO
V
M = − ± − M − P
(Marconi et al. 2003); if l H/ p =2.0is adopted, the absolute magnitude of the FOBE changes of only +0.05 mag, while the same change in the convection produces a change in the magnitude of the FRE of -0.14 mag (Marconi et al. 2003). This characteristic makes the location of the FOBE in the CM diagram an attractive distance indicator (Caputo 1997; Caputo et al. 2000). The essential requirement to apply this method is to have a well-populated IS, i.e. this method is useful only with homogeneous populations (as globular clusters and old components of dwarf spheroidal galaxies) with a significant sample of RRc stars. However, it is worth noticing that this method relies on the estimate of the position of the FOBE with the bluest RRc stars: therefore, strictly speaking, this method yields only an upper limit for the distance modulus. The reliability improves if the HB is well populated, so that the difference in color between the bluest RRc stars and the first non-pulsating HB stars, hotter than the bluest RRc stars, is as small as possible. In practice, it is convenient to fix the mass from evolutionary models, and to express the magnitude as a function of the metal abundance
0.78 2.255 log 0.151log
V
M = − − P+ Z
(Caputo et al. 2000) and where the metal fraction Z can be related to the observable [Fe/H] ratio by
(simply scaling the solar chemical composition, with Z⊙ =0.02 1
) or by
logZ =[Fe H/ ] 1.70 log(0.638− + f +0.362)
when the ratio f of α-elements respect to iron is taken into account (Salaris, Chieffi, & Straniero 1993). The intrinsic accuracy of the FOBE relation is σV =0.065mag. As a matter of example, Figure 2.11 shows the FOBE method applied to RRc stars belonging to the Carina dwarf spheroidal galaxy (Dall’Ora et al. 2003).
Figure 2.11. Distribution of the dSph Carina RR Lyrae stars in the MV −logPplane. Observed apparent magnitudes were shifted to match the FOBE of the IS. The shift is the estimated distance modulus. Figure from Dall’Ora et al. (2003).
2.10 RR Lyrae stars as distance indicators: the PLK relation
2.10.1 Empirical evidence and theory
Empirical evidence shows (Longmore et al. 1986; 1990) that RR Lyrae stars follow, in the
K-band, a rather tight period-luminosity relation (PLK). This empirical finding was subsequently
1
Solar chemical abundances have recently been revised by Asplund, Grevesse, and Sauval (2004). They foundZ⊙ =0.012. If confirmed, this new value would slightly affect absolute distances, while relative distances
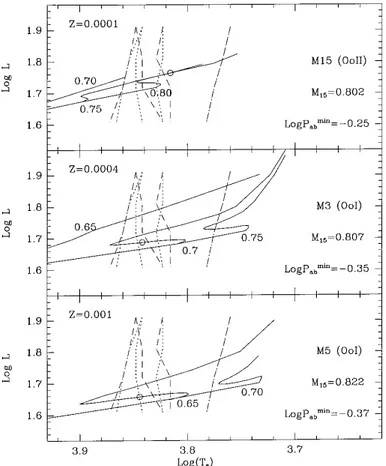
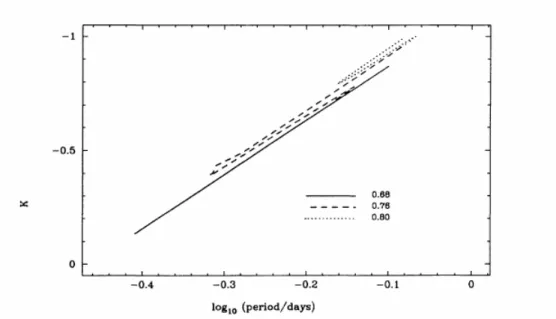
theoretically supported by Buckley, Longmore, & Dixon (1992), who combined the pulsation equations by Van Albada & Baker (1973) with the horizontal branch models of Lee & Demarque (1990). Figure 2.12 shows their theoretical relation obtained for three different values of the stellar masses. Moreover, they took into account the effect of the evolution: figure 2.12 shows quite clearly that the evolutionary effects have a small impact on the magnitude, since they introduce a scatter of about 0.1 mag.
Figure 2.12. Theoretical PLK relations for the three labeled masses and for two luminosity levels. Figure from Buckley, Longmore, & Dixon (1992).
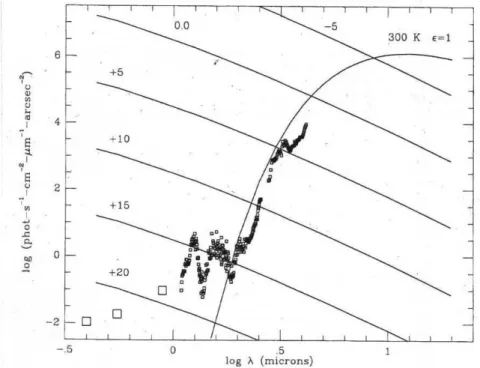
On the basis of more sophisticated theoretical models, these findings were subsequently confirmed and refined by Bono et al. (2001, hereafter B01). In Figure 2.13 absolute V and K magnitudes are plotted as a function of logP, for a fixed chemical composition and for three different values of the luminosity. The V magnitude is strongly dependent on the luminosity level, since a variation of 0.1 dex implies a variation of 0.25 mag; on the other hand, the same luminosity change implies in the K-band a variation both in the K-magnitudes and in the periods, and the net effect is that the PLK relations of bright and faint pulsators agree with each other, within 0.1 mag. It is evident that in the V band RR Lyrae stars do not follow any period-luminosity relation. The physical reason is that in the K band the bolometric correction strongly depends on the effective temperature (i.e. on the period, having fixed the other parameters) while in the V-band the bolometric correction is nearly constant. Figure 2.14 shows the behavior of the
correction starts to show a linear and significant dependence on the temperature only with the I- band, and the effect is maximum in the K band. It is worth noting that, although K magnitudes depend on the chemical composition (figure 2.14) this effect is smaller than in the V band. If one starts from the pulsation equation (for example, for the fundamental pulsators)
logPF =11.066( 0.002) 0.832 log± + L−0.650 logM −3.363logTe
(Marconi et al. 2003) and neglects the effect on the period of luminosity and mass (in the previous relation the coefficients are quite small compared to the coefficient of the temperature), the period mainly depends on the effective temperature and, in turn on the bolometric correction.
Figure 2.13. Upper panel: predicted V-band absolute magnitudes for fundamental (filled symbols) and first overtone (empty symbols) pulsators, for a fixed chemical composition (Y = 0.24, Z = 0.001) and mass (M =0.65M⊙), but with different luminosity levels. Lower panel: same as in the upper panel, but for K-band absolute magnitudes. Figure from Bono et al. (2001).
Figure 2.14. Predicted bolometric correction as a function of the effective temperature for the labeled values of helium, metallicity and mass in the V (upper panel), I (middle panel), and K-band (lower panel). Figure from Bono (2004).
Figure 2.15 shows the dependence of V and K magnitudes on the stellar masses: the luminosity level is fixed ( log /L L⊙ =1.61), and two values of masses have been plotted (0.625 and 0.675 M⊙), considered representative of the spread in masses for RR Lyrae stars in a GC at logZ ≈ − (see figure caption for details). In particular, PLK relation is only marginally affected 3 by a spread in masses, and indeed a variation of 8% in mass introduces, at fixed period, a variation of ~0.06 mag.
0.568 2.071log 0.087 log 0.778log
K
M = − P+ Z− L
where the periods are fundamentals or fundamentalized. Estimating the luminosity level on the basis of the logL(ZAHB)-logZ calibrations provided by (Bono et al. 1997; Cassisi et al. 1998; 1999), one obtains the relation
0.139 2.071(log 0.30) 0.167 log
K
M = − P+ + Z
with the intrinsic accuracy of σK =0.037mag. The previous equation can be rewritten as
0.766 2.071log 0.167[ / ]
K
M = − − P+ Fe H
and compared with the empirical calibrations available in the literature, based on the Baade-Wesselink luminosity calibrations of field RR Lyrae stars
0.647 1.72 log 0.04[ / ] (Longmore et al., 1990) 0.76 2.257 log 0.08[ / ] (Liu & Janes, 1990) 0.72 2.03log 0.06[ / ] (Jones et al., 1992)
K K K M P Fe H M P Fe H M P Fe H = − − + = − − + = − − +
It is worth noticing that the theoretical relations have all been obtained on a solar-scaled mixture (i.e. without α-enhancement).
Figure 2.15. Predicted absolute magnitude in the V (upper panel) and in the K-band, as a function of the pulsation period. The luminosity is fixed, logL L/ ⊙ =1.61, and two different mass values are adopted, namely 0.625M ⊙ (triangles) and0.675M ⊙ (circles). Figure from Bono et al. (2001).
Theory has been validated on RR Lyr itself by Bono and coworkers (2002): the pulsation parallax (i.e. the parallax that a star, with the estimated distance, should have), obtained with the
PLK relation, was compared with the trigonometric measure obtained by Benedict et al. (2002) using the interferometer on board of the Hubble Space Telescope. In particular, the PLK estimate
3.858 0.131 puls
π = ± mas is in excellent agreement with the measured valueπtrig =3.82 0.20± , but with a smaller formal error. The estimate of the pulsation parallax relies on the comparison between the K band absolute and de-reddened apparent magnitudes. Unfortunately, RR Lyrae is located at low Galactic latitude and its reddening is poorly known, ranging from E B V( − )≈ 0.03 to ≈ 0.06 mag. This means, following the relations provided by Cardelli, Clayton, & Mathis (1989), that the absorptions in the V and K band range from AV =3.1×E B V( − )≈0.09to ≈ 0.18 mag, and from AK =3.1 0.11× ×E B V( − )≈0.01to ≈ 0.02 mag, respectively. As shown in Bono et al. (2003), the pulsation parallax is only moderately dependent on the absorption (figure 2.16, upper panel), decreasing with increasingAV ; however, pulsation-based estimates are within the error bar of the HST measurements.
Figure 2.16. Top panel: predicted pulsation parallax for RR Lyr (filled circles), as a function of the visual extinction. Solid and dashed lines show the HST direct measurement and the relative uncertainty, respectively. Middle panel: comparison between K magnitudes of RR Lyr based on HST trigonometric parallax (open circles) and on the pulsation approach (filled circles), as a function of the visual extinction. For the sake of clarity, HST data have been slightly shifted along the x-axis. Bottom panel: the same as the middle panel, but for absolute visual magnitude. Plot from Bono et al. (2003).
Middle and bottom panels of figure 2.16 show the dependence on the absorption of the absolute K and V magnitudes, respectively. Data in both panels show that the empirical determination of the absolute magnitude is still hampered by the uncertainty in the HST measurement, even if the absorption was firmly known.
2.10.2 PLK relation: fine tuning
Relations provided Bono et al. (2001) were provided only for fundamental pulsators and, although PLK is moderately dependent on the pulsator mass, and the quoted equations were obtained by fixing only a reference mass, in the middle of the IS.
On the basis of a finer grid of pulsation models, Bono et al. (2003) derived new theoretical relations, both for fundamental and first overtone pulsators. The equations they obtained are
0.511 2.102 log 0.095 log 0.734 log 1.753log /
0.029 2.265log 0.087 log 0.635 log 1.633log /
F K r FO K r M P Z L M M M P Z L M M = − + − − = − − + − −
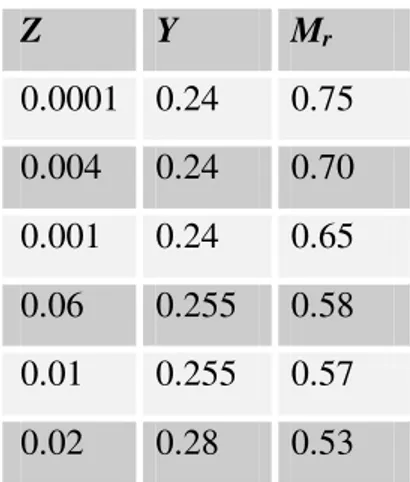
with a rms scatter of σ = 0.016 mag. In these equations, Mr is a reference mass, function of the metal content, and M is the model mass, that can be inferred from HB evolutionary models. Reference masses (in solar units) for different metals and helium abundances are listed in the table 2.2, partially reproducing Bono et al. (2003) table 1.
Once the reference mass is included in the above equations the masses predicted from ZAHB models for fundamental and first overtone pulsators, at logTe= 3.80 and 3.85, respectively
0.565 2.101log 0.125 log 0.734 log 0.016 2.265log 0.096 log 0.635 log
F K FO K M P Z L M P Z L = − + − = − − + −
with a rms of σ = 0.031 and 0.025 mag, respectively.
Z Y Mr 0.0001 0.24 0.75 0.004 0.24 0.70 0.001 0.24 0.65 0.06 0.255 0.58 0.01 0.255 0.57 0.02 0.28 0.53
Table 2.2. Input parameters for the grid of the models used by Bono et al. (2003). Masses are in solar units
Following the same procedure outlined above, Bono et al. derived
(
)
(
)
4.014 1.986 log 0.134 log 1.662 log 1.656 log / 5.195 2.518 log 0.159 log 2.158 log 1.815log /
F V K r FO V K r M M P Z L M M M M P Z L M M − = + − − + − = + − − +
or, fixing the mass as in the PLK relations,
(
)
(
)
3.963 1.986 log 0.162 log 1.662 log 5.180 2.518log 0.168log 2.158 log
F V K FO V K M M P Z L M M P Z L − = + − − − = + − −
with an intrinsic dispersion of 0.037 and 0.031 mag, respectively. These equations are particularly useful, since if one fixes the luminosity level they can be used as an independent check on the estimated distances with the PLK relations. Moreover, and even more importantly, due to their strong dependence on the luminosity level, they can be used to give an estimate of the luminosity L, to use therefore in the PLK equations.
Catelan, Pritzl, & Smith (2004), on the basis of synthetic HB computations, studied the behavior of the Period-Luminosity relation in several bandpasses, from U to K. They accounted for the evolutionary effects and the spread in masses by considering several HB morphologies, which can be described with the Lee-Zinn ratio (B−R) /(B V+ +R), where B and R are the number of stars on the blue side and on the red side of the IS, respectively, and V is the number of RR Lyrae stars. For the K band, they found the average (i.e. not depending on the specific HB morphological type) relation
0.597 2.353log 0.175log
K
M = − − P+ Z
which is similar to that found by Bono et al. (2001), but with a slope slightly steeper: in terms of zero point, at the representative values P=0.50d and Z =0.001, the above relation provide a magnitude 0.05 mag brighter than B01.
A very similar approach was adopted by Cassisi et al. (2004), who found slopes ranging from α = −2.30 to α = −2.41.
2.10.3 The MK-[Fe/H]-log P relation
In the above equations the metallicity is treated with the mass fraction Z. Unfortunately, this is a not an observable parameter, but it is estimated from the observed quantity [Fe/H]. It is worth to recall that [Fe/H] actually is not the real metallicity of the star, being neglected the abundances of other elements, such as α-elements. Nevertheless, since the α-enhancement is of the order of 0.3-0.4 dex, the difference between [Fe/H] and the global metallicity [M/H] is of the order of ≈ 0.2-0.3, and the [Fe/H] ratio is currently adopted as metallicity indicator, since it is relatively ease to get even from photometric observations. To study the
[
/]
log KM − Fe H − Prelation, B03 chose a set of RR Lyrae stars for which accurate V and K magnitudes were available, as well as with reliable evaluations of the reddening and metallicity. (V-K) colors were used to estimate the luminosity level, and then their absolute K-band magnitude was estimated with the PLK relation. They found a very tight relation between
K
M and
[
Fe H/]
ratio, i.e.[
]
2.101log 0.770( 0.044) 0.231( 0.012) / K
M + P= − ± + ± Fe H
Note that the dependence on the metallicity is steeper than in the purely theoretical relation, where the metallicity is given with the mass fraction log Z (in that case the slope was 0.125, or 0.167 when the theoretical B01 relation is considered). To check the occurence of systematic uncertainties on the distance scale based on the B03 PLK semi-empirical relation, Dall’Ora et al. (2004b) performed a comparison between the distance moduli of four Galactic Clusters estimated with the Baade-Wesselink calibration and with the FOBE method (only for three of them, in this latter case), with the distance modulus estimated with the B03 semi-empirical calibration. Results are summarized in table 2.2, which reproduces their table 2. Table 2.2 clearly shows that the most discrepant results are with the most metal-poor clusters, especially if the comparison with the results from the Baade-Wesselink method is considered. The trend is weaker with the FOBE.
Object [Fe/H]a E(B-V)b <V>c σσσσV µµµµ0 (BW)d µµµµ0 (FOBE)e µµµµ0 (K)f ∆µ∆µ∆µ∆µ0f ∆µ∆µ∆µ∆µ0f
Ω Cen -1.62 0.12 14.57 0.12 13.57±0.16 … 13.77±0.04 0.20 …
M 3 -1.57 0.01 15.61 0.12 14.94±0.16 14.97±0.07 15.15±0.16 0.21 0.18
M 5 -1.27 0.03 15.06 0.08 14.26±0.13 14.28±0.07 14.37±0.09 0.11 0.09
M 15 -2.26 0.10 15.82 0.08 15.01±0.13 15.17±0.07 15.32±0.10 0.30 0.15
Table 2.3. a) Mean cluster metallicity according to Harris (1996) b) Cluster reddning according to Harris (1996)
c) Mean visual magnitude according to ΩΩΩΩ Cen, Olech et al. (2003); M3, Corwin & Carney
(2003); M5, Caputo et al. (1999); M15 Silbermann & Smith (1995)
d) True distance moduli based on the Baade-Wesselink calibration provided by Fernley (1994) e) True distance moduli based on the FOBE method suggested by Caputo et al. (2000)
f) True distance moduli based on the K-band mean magnitudes for RR Lyrae stars collected by Longmore et al. (1990) and the semi-empirical relation derived by B03
g) Difference in distance moduli between the PLK relation and the BW method h) Difference in distance moduli between the PLK relation and the FOBE method Table from Dall’Ora et al. (2004b)
Chapter 3
Data reduction
In this chapter will be discussed the observing strategies and data reduction techniques used in the present work. A brief introduction on the near-infrared arrays and on the problems in observing in the near-infrared bands with ground-based telescopes will be given.
3.1 Near-Infrared arrays
Near-Infrared arrays are imaging devices developed starting from the second half of 80’s. Typical dimensions are of 1024 × 1024 pixels, and only recently 2048 × 2048 pixels arrays become available to the astronomical community.
The physical bases of the IR arrays are the same of visual CCDs, both being based on the photoelectric effect, but construction and operation differs in several significant aspects.
IR arrays are made with semiconductors with a small energy gap between the valence and conduction bands (in order to allow infrared low-energy photons to excite electrons). The side effect is that electrons can be excited into the conduction band not only by photons, but also by thermal energy. As a consequence, IR arrays must be operated at temperatures (about 60 – 80 K for HgCdTe detectors) much lower with respect to CCDs. Moreover, in order to reduce the thermal background as much as possible, they must also be extremely well baffled by cold (typically 77 K) surfaces to admit only the solid angle subtended by the telescope optics.
From the structural side, current technology does not allow to build IR detectors that function adequately as shift registers and amplifiers: in this case hybrid arrays are adopted, made of a detector array and of a readout array (multiplexer), assembled separately, aligned and joined. It is worth noting that the multiplexer, although made of silicon is not a CCD, but for
noise-advantages, since each pixel is effectively isolated from his neighbors: this eliminates annoying effects seen in CCDs, such “blooming” (i.e., the overflowing of photoelectrons from one pixel to neighbors) and “charge trail” or “bleeding” (the loss of charges along a column during the reading stage), because each pixel is read separately and there is no charge transfer from one pixel to another.
Figure 3.1. Representation of the voltage of the single pixel as a function of time. The “double correlated sampling” technique, described in the text, is labeled with DCS. The kTC noise is shown. Figure from Joyce (1992).
3.2 Array operation
As mentioned, IR arrays are made of pixels that are isolated from neighbors and that are read separately. Therefore, the readout process is non-destructive because it does not affect the charge on the pixel and hence it can be carried out at any time.
As in CCDs, the pixels are made of diode junctions that act as capacitors, on which the voltage is function of the collected charges. The adopted sampling technique is based on the assumption that charge and voltage on the pixel follow a linear relation. This is certainly not the case if the pixel is saturated, but even in normal operating limits, there is a slight voltage