2017
Publication Year
2021-01-11T14:34:42Z
Acceptance in OA@INAF
The 2015 outburst of the accretion-powered pulsar IGR J00291+5934: INTEGRAL
and Swift observations
Title
De Falco, V.; Kuiper, L.; Bozzo, E.; Galloway, D. K.; Poutanen, J.; et al.
Authors
10.1051/0004-6361/201629575
DOI
http://hdl.handle.net/20.500.12386/29641
Handle
ASTRONOMY & ASTROPHYSICS
Journal
599
Number
DOI:10.1051/0004-6361/201629575 c ESO 2017
Astronomy
&
Astrophysics
The 2015 outburst of the accretion-powered pulsar
IGR J00291+5934: INTEGRAL and Swift observations
V. De Falco
1, 2, L. Kuiper
3, E. Bozzo
4, D. K. Galloway
5, 6, J. Poutanen
7, C. Ferrigno
4, L. Stella
8, and M. Falanga
2, 1 1 Institut für theoretische Physik, Universität Basel, Klingelbergstrasse 82, 4056 Basel, Switzerlande-mail: [email protected]
2 International Space Science Institute (ISSI), Hallerstrasse 6, 3012 Bern, Switzerland
3 SRON–Netherlands Institute for Space Research, Sorbonnelaan 2, 3584 CA, Utrecht, The Netherlands 4 ISDC, Data centre for astrophysics, University of Geneva, Chemin d’Écogia 16, 1290 Versoix, Switzerland 5 School of Physics and Astronomy, Monash University, VIC 3800, Australia
6 Monash Centre for Astrophysics, Monash University, VIC 3800, Australia
7 Tuorla Observatory, Department of Physics and Astronomy, University of Turku, Väisäläntie 20, 21500 Piikkiö, Finland 8 INAF–Osservatorio Astronomico di Roma, via Frascati 33, Monteporzio Catone, 00078 Rome, Italy
Received 24 August 2016/ Accepted 5 December 2016
ABSTRACT
The pulsar IGR J00291+5934 is the fastest-known accretion-powered X-ray pulsar, discovered during a transient outburst in 2004. In this paper, we report on INTEGRAL and Swift observations during the 2015 outburst, which lasts for ∼25 d. The source has not been observed in outburst since 2008, suggesting that the long-term accretion rate has decreased by a factor of two since discovery. The averaged broad-band (0.1–250 keV) persistent spectrum in 2015 is well described by a thermal Comptonization model with a column density of NH ≈ 4 × 1021cm−2, a plasma temperature of kTe ≈ 50 keV, and a Thomson optical depth of τT ≈ 1. Pulsations at the
known spin period of the source are detected in the INTEGRAL data up to the ∼150 keV energy band. We also report on the discovery of the first thermonuclear burst observed from IGR J00291+5934, which lasts around 7 min and occurs at a persistent emission level corresponding to roughly 1.6% of the Eddington accretion rate. The properties of the burst suggest it is powered primarily by helium ignited at a depth of yign ≈ 1.5 × 10⁹ g cm−2following the exhaustion by steady burning of the accreted hydrogen. The Swift/BAT
data from the first ∼20 s of the burst provide indications of a photospheric radius expansion phase. Assuming this is the case, we infer a source distance of d= 4.2 ± 0.5 kpc.
Key words. pulsars: individual: IGR J00291+5934 – stars: neutron – X-rays: binaries – X-rays: bursts
1. Introduction
Accreting millisecond X-ray pulsars (AMXPs) are old (in the order of Gyr) neutron stars (NSs) endowed with a relatively low magnetic field (B ≈ 108−9 G) and spin frequencies typi-cally between 180–600 Hz. They are hosted in low mass X-ray binaries (LMXBs) characterised by an orbital period ranging from 40 min to 5 h. All AMXPs are X-ray transients, spend-ing most of their time in a quiescent state (X-ray luminosities of the order of 1031−32erg s−1) and sporadically undergoing
out-bursts that can last for a few weeks and reach X-ray luminosi-ties of 1038 erg s−1 (see, e.g., Wijnands 2006;Poutanen 2006;
Patruno & Watts 2012, for reviews).
The AMXP IGR J00291+5934 was discovered during an outburst in 2004 and it is the fastest spinning AMXP dis-covered so far. Its spin period is 1.67 ms (Markwardt et al. 2004;Falanga et al. 2005b). IGR J00291+5934 is also the first AMXP showing a clear spin-up behaviour during outburst (Falanga et al. 2005b). Together with other AMXPs, such as SAX J1808.4–3658 (the first discovered in 1998; Wijnands & van der Klis1998), PSR J1023+0038 (Shahbaz et al.2015), and IGR J18245–2452 (Papitto et al. 2013), it confirms the evolu-tionary link between the accretion powered LMXBs and the rotation-powered millisecond pulsars (so-called recycling sce-nario;Alpar et al. 1982). RXTE/ASM data suggest that possible
outbursts from the source could have occurred already in 1998 and 2001 (Remillard 2004), tentatively indicating a recurrence time of ∼3 yr. This possibility can not be confirmed further, as the following outbursts from IGR J00291+5934 are recorded only in 2008 and 2015 (Lewis et al. 2010;Hartman et al. 2011;
Lipunov et al. 2015;Sanna et al. 2015). The quiescent emission from the source is studied by Jonker et al.(2005), who record with Chandra a luminosity as low as (5−10) × 1031erg s−1(0.5–
10 keV). This value is comparable with that observed from other AMXPs in quiescence.Patruno(2010) also reports the possible spin-down between the outbursts that would be expected accord-ing to the standard magneto-dipole radiation scenario (see, e.g.,
Patruno & Watts 2012, for a review).
The donor star hosted in IGR J00291+5934 is identified to be a hot brown dwarf with a mass ranging between 0.039– 0.16 M (Galloway et al. 2005). This is in agreement with
stellar evolutionary expectations, which predict that the ob-served AMXPs with an orbital period in the 1.4–11 h range (that in our case is 2.5 h) should host hydrogen-rich white or brown dwarfs (see Bildsten & Chakrabarty 2001, and ref-erences therein). Therefore, all these AMXPs also exhibit he-lium type-I X-ray bursts after they burned prior to ignition of the accreted hydrogen fuel (see e.g.,Galloway & Cumming 2006; Watts & Strohmayer 2006; Falanga et al. 2007, 2011;
A&A 599, A88 (2017) Table 1. Log of all Swift and INTEGRAL observations used in this
work.
Sequence Obs/mode Start time (UT) Exposure
(UTC) (ks) 00031258005 Swift/WT 2015-07-24 13:23:42 1 00650221000 Swift/WT 2015-07-25 01:56:19 0.3 00650221001 Swift/WT 2015-07-25 03:21:27 2 00031258006 Swift/WT 2015-07-29 00:18:11 1.4 00031258007 Swift/WT 2015-07-31 12:46:58 1.9 00031258008 Swift/PC 2015-08-02 01:27:58 2.5 00031258009 Swift/PC 2015-08-04 02:48:58 2 00031258010 Swift/PC 2015-08-06 18:45:58 2 00031258012 Swift/PC 2015-08-09 08:57:57 1.9 00031258014 Swift/PC 2015-08-14 16:57:57 1.8 00031258015 Swift/PC 2015-08-17 08:38:12 0.9 00031258016 Swift/PC 2015-08-19 11:31:58 1.1 00031258017 Swift/PC 2015-08-23 10:00:58 1.7 15690004001 INTEGRAL 2015-07-27 17:45:57 170
In this paper, we report on INTEGRAL and Swift observa-tional campaign carried out to monitor the IGR J00291+5934 July 2015 outburst. We study the properties of the broad-band spectral energy distribution of the source, as well as its timing properties. We also present a detailed analysis of the first ther-monuclear X-ray burst observed from IGR J00291+5934 (see alsoKuin et al. 2015;Bozzo et al. 2015a).
2. Observations and data
The 2015 outburst is covered by INTEGRAL (22–250 keV) and Swift (5–22 keV) data (see Sects. 2.1 and 2.2). To have the full coverage of the outburst trend we have used all the daily-averaged available Swift/BAT data (15–50 keV).
2.1. INTEGRAL
We analysed the INTEGRAL (Winkler et al. 2003) target of op-portunity (ToO) observation performed on IGR J00291+5934 during its outburst in July 2015. The observation started on 2015 July 27 at 17:45:57.2 UTC and ended on July 29 at 21:07:17.2 UTC, summing up to a total exposure time of 170 ks (see Table1).
The reduction of the INTEGRAL data was performed using the standard
offline science analysis
(OSA) version 10.2 distributed by the ISDC (Courvoisier et al. 2003). INTEGRAL data were divided into science windows (ScW), that is, di ffer-ent pointings each lasting ∼2–3 ks. The algorithms used for the spatial and spectral analysis are described in Goldwurm et al.(2003). The observation, that is in a hexagonal dithering mode aimed at IGR J00291+5934, consisted of 50 ScWs with a source position offset .2◦.5 from the centre of the field of
view. We analysed data from the IBIS/ISGRI coded mask tele-scope (Ubertini et al. 2003; Lebrun et al. 2003), covering the 20–300 keV energy band, and from the two JEM-X monitors (Lund et al. 2003), covering the 3–20 keV energy range.
The pulsar IGR J00291+5934 was detected in the
IBIS/ISGRI mosaic at a significance level of 60σ (20–100 keV energy range). We note that the nearby source V709 Cas (de-tection significance of 9σ in the 20–100 keV energy band) can be clearly distinguished thanks to the spatial resolu-tion of the instrument and thus is not contaminating the
X-ray emission recorded from IGR J00291+5934 (see also
Falanga et al. 2005b). IGR J00291+5934 is also clearly detected in the JEM-X mosaics with a detection significance of 42σ in the 3–20 keV energy range. The best determined position of IGR J00291+5934 is at αJ2000 = 00h29m01s.97 and δJ2000 =
59◦3401800. 9, with an associated uncertainty of 300. 5 at the 90%
confidential level (c.l.; 20–100 keV;Gros et al. 2003). The offset with respect to the position of the associated optical counterpart is 000. 2 (Torres et al. 2008). We first extracted a number of energy
resolved light curves for IBIS/ISGRI and the two JEM-X, at a time scale of one ScW. The analysis of these light curves does not provide evidence for significant spectral variation during the outburst, and thus we extracted a single ISGRI and JEM-X spec-trum averaged over the entire exposure time available. These spectra are described in the next section and fit together with the Swift data.
2.2. Swift
Swift/XRT (Burrows et al. 2005) started to monitor the source ∼135 s after a BAT trigger that occurred on 2015 July 25 at 02:12 UTC, which corresponds to the onset of the first type-I X-ray burst observed from this source (Kuin et al. 2015). The XRT monitoring campaign covers the source outburst from 57 227 MJD to 57 250 MJD, comprising a total of 13 pointings and an effective exposure time of 21 ks. One XRT observation is carried out on 2015 July 29 (ID 00031258006) simultaneously with the INTEGRAL ToO. The effective exposure time of this XRT pointing is 1.4 ks (see Table1).
We processed the Swift/XRT data by using standard pro-cedures (Burrows et al. 2005) and the calibration files version 20160113. The Swift/XRT data awere taken both in window-timing (WT) and photon-counting (PC) modes (processed with
the
xrtpipeline
v.0.13.2). Filtering and screening criteria wereapplied by using FTOOLS contained in the
heasoft
software package (v6.19)1. We extract source and background light curves and spectra by selecting event grades of 0–2 and 0–12 for the WT and PC mode, respectively. We used the latest spectral redistribution matrices in the HEASARC calibration database. Ancillary response files, accounting for different extraction re-gions, vignetting and PSF corrections, were generated using thexrtmarkf
task. When required, we corrected PC data forpile-up, and used the
xrtlccorr
task to account of this correction in the background-subtracted light curve.We extracted the BAT light curve with
batgrbproduct
tool and standard techniques and we also used the public daily-averaged Swift/BAT data in the 15–50 keV energy band retrieved from the Hard X-ray Transient Monitor webpage2(Krimm et al.2013).
3. Outburst properties
3.1. The light curve
In Fig.1we show the light curve of IGR J00291+5934 as ob-tained from all data used in this paper and showing the entire source outburst. The count-rates measured from all instruments were converted to bolometric flux (0.1–250 keV) using the spec-tral analysis results from Sect.4.
The source displays a clear increase in flux for ∼3 d af-ter the onset of the event, reaching a peak value that is about
1 http://heasarc.gsfc.nasa.gov/docs/software.html 2 http://swift.gsfc.nasa.gov/results/transients/
0 10 20 30 024 Flux (10 − 9 erg cm − 2 s − 1)
Time since MJD 57224 (days)
burst
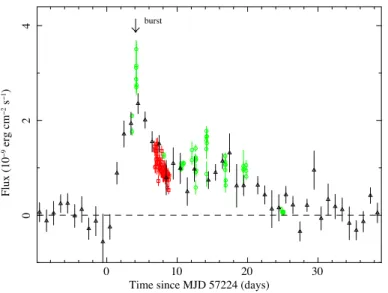
Fig. 1. Light curve of the 2015 outburst observed from IGR J00291+5934. We show data from Swift/XRT (green circles, bin time of 500 s; July 24–15 August), Swift/BAT (black triangles, each measurement is averaged over 1 d; July 11–28 August), and INTEGRAL/ISGRI (red squares, the integration time is one science window of ∼2–3 ks; July 27–29). The arrow indicates the time of the only detected type-I X-ray burst. The dashed line shows the quiescent flux level. The source outburst reaches the highest peak flux that has ever been detected in the previous outbursts.
three orders of magnitude larger than the persistent quiescent flux recorded before 57 225 MJD. The source then decays back into its quiescent state around 57 250 MJD, suggesting that the outburst lasts ∼25 d in total.
The profile of the outburst over time, shown by the source in 2015, is strongly reminiscent of that recorded during the event in 2004, as in both cases the return to quiescence occurs on a time scale of 15–25 d and also the peak flux is roughly com-parable (we note that the onset of the outburst in 2004 can not be observed; seeFalanga et al. 2005b, and references therein). The profile of the source outburst corresponding to the 2008 event is much more peculiar, featuring a double outburst light curve separated by 30 d. On that occasion, the source displayed a clear rise and fast decay in flux during the first 9 d of the event and then remains below the instrument detection level for about a month. A second brightening phase follows, lasting roughly ∼15 d (Hartman et al. 2011). The origin of this singular out-burst profile is still a matter of debate (see also the discussion inBozzo et al. 2015a). The analysis of the long term BAT light curve shows that no rebrightening episode takes place after the main outburst in 2015.
A novel feature of the 2015 outburst of IGR J00291+5934 is the first detection of a thermonuclear burst, occurring 2.8 d after the event onset, close to the time of the peak flux achieved by the source (Kuin et al. 2015; Bozzo et al. 2015a). We perform a time-resolved spectral analysis of the source X-ray emission during the type-I burst in Sect.6. No additional thermonuclear bursts are found either in the continuous 170 ks INTEGRAL monitoring observation or in the available 13 Swift/XRT point-ings lasting 21 ks.
3.2. The recurrence time
Prior to the 2015 outburst, IGR J00291+5934 has exhibited out-bursts roughly every three years, with a gradually increasing interval (Table2). The regularity of the outbursts allows the time
2005 2010 2015 2020 0 0.5 1 1.5 2 <F X > (10 − 11 erg cm − 2 s − 1) Time (yr) IGR J00291+5934
Fig. 2.Estimated time-averaged X-ray flux for IGR J00291+5934 for the outbursts observed between 2001–2015, based on the outburst flu-ences listed in Table2. The 2008 August and September outbursts are taken together to estimate the average rate since 2004. The average flux can be taken as a measure of the accretion rate into the disk between outbursts; the dashed line shows a linear fit, which (extrapolated) de-creased to zero by 2024. We predict that the source may not exhibit another outburst as strong as that in July 2015 in the next decade.
of the 2008 outburst to be predicted to within 1% of the actual interval, 3.7 yr (Galloway 2008). The same quadratic fit would predict that the next outburst should occur after 4.1 yr, around 56 200 MJD (2012 October); instead, it occurs some 2.8 yr later, after an interval of 6.9 yr.
It is tempting to speculate that the pair of outbursts ob-served in 2008, separated by one month, may exhaust the disk to an unusual extent, delaying the following outburst. In fact, the total fluence of both 2008 outbursts together is slightly be-low that of the 2004 outburst. The 2015 outburst is somewhat more energetic again; the integrated flux from the Swift/BAT and INTEGRAL/ISGRI measurements indicates a total fluence of (2.01 ± 0.11) × 10−3erg cm−2. Furthermore, it is usually
as-sumed that such transient outbursts exhaust all the accumulated material in the disk (although admittedly the secondary 2008 outburst is evidence that this is not always the case). We can also rule out any missed outbursts between 2008 and 2015, based on Swift, BAT monitoring. Due to the high declination of the Swift satellite, IGR J00291+5934 is constantly monitored by BAT on a daily timescale, and the typical upper limit outside the outburst is 5 × 10⁻¹⁰erg cm−2s−1(H. Krimm, priv. comm.).
Instead, we find the long-term outburst history offers strong evidence that the steady mass transfer rate is decreasing, by about 50% between 2001 and 2015. We calculate in Table 2
the time-averaged X-ray flux as the outburst fluence divided by the outburst interval. This value is 1.6 × 10⁻¹¹ erg cm−2s−1 be-tween 2001–2004, but only 9.3 × 10⁻¹² erg cm−2s−1 between 2008–2015 (see Fig. 2). For a distance of 4 kpc, this cor-responds to a range of accretion rates of (0.2–0.01)% ˙MEdd.
Such a decrease in the long-term accretion rate is also in-ferred from the outbursts in SAX J1808.4−3658, on a similar timescale (Galloway 2008). Following the same line of thought ofGalloway(2008), we also perform a linear fit to the average fluxes over the last three outburst intervals. It may indicate that the time-averaged X-ray flux has dropped steadily with the rate of ∼0.08 × 10⁻¹¹ erg cm−2s−1yr−1. While this fit is purely phe-nomenological, if the trend continues, the wait time for future outbursts (of similar fluence to those in 2004 and 2015) will oc-cur substantially longer than seven years.
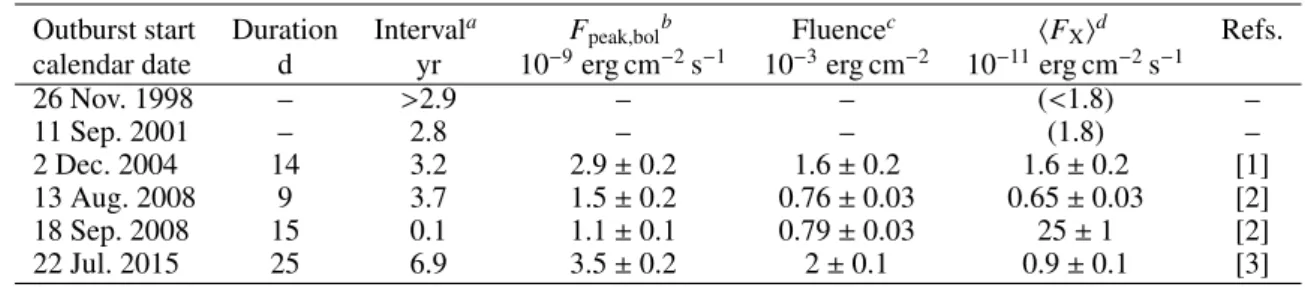
A&A 599, A88 (2017) Table 2. Transient outbursts from IGR J00291+5934.
Outburst start Duration Intervala F
peak,bolb Fluencec hFXid Refs.
calendar date d yr 10−9erg cm−2s−1 10−3erg cm−2 10−11erg cm−2s−1
26 Nov. 1998 – >2.9 – – (<1.8) – 11 Sep. 2001 – 2.8 – – (1.8) – 2 Dec. 2004 14 3.2 2.9 ± 0.2 1.6 ± 0.2 1.6 ± 0.2 [1] 13 Aug. 2008 9 3.7 1.5 ± 0.2 0.76 ± 0.03 0.65 ± 0.03 [2] 18 Sep. 2008 15 0.1 1.1 ± 0.1 0.79 ± 0.03 25 ± 1 [2] 22 Jul. 2015 25 6.9 3.5 ± 0.2 2 ± 0.1 0.9 ± 0.1 [3]
Notes. (a)The epoch for the outburst prior to the first known is assumed to be earlier than the first RXTE/ASM measurements (typically 1996
January 6 or 50 088 MJD).(b)The peak bolometric flux is in the 0.1–250 keV energy range.(c)Bolometric fluence.(d)Estimated time-averaged
bolometric flux. Values in parentheses are estimated from the RXTE/ASM intensity, since RXTE/PCA measurements are not available at the outburst peak, and are approximate.
References. [1]Galloway et al.(2005); [2]Hartman et al.(2011); [3] this paper.
4. Spectral analysis
The spectral analysis is carried out using
xspec
version 12.6 (Arnaud 1996). All uncertainties in the spectral parameters are given at a 1σ confidence level for a single parameter.We first fitted all the different XRT spectra extracted from the available 13 pointings, excluding the type-I burst. This anal-ysis revealed that in all cases the source X-ray emission in the soft energy band can be reasonably well described by using a simple absorbed power-law model (χ2
red/d.o.f. = 0.98/97). In
all cases, we measured an absorption column density of NH =
(1.30 ± 0.15) × 1022cm−2, and a photon index ofΓ = 1.96±0.05,
with no evidence of significant spectral variability. We thus per-formed a more detailed broad-band spectral fit by combining the XRT observations carried out on 2015 July 29 with the INTE-GRAL data. In order to limit the uncertainties in the calibrations of the different instruments, the fit to the broad-band spectrum is limited to 1.1–7.5 keV for the XRT data in WT mode, 5–22 keV for the two JEM-X and 22–250 keV for ISGRI. A constant fac-tor was included in the fit in order to take into account the inter-calibrations between the different instruments and the possible intrinsic variability of the source (in all cases we assume ISGRI as the reference instrument and fix the corresponding constant to unity).
We obtained an acceptable fit to the broad-band spectrum of IGR J00291+5934 using an absorbed cut-off power-law model (χ2red/d.o.f. = 0.73/95). We measured a column density NH =
(1.01 ± 0.17) × 1022 cm−2, a photon index of Γ = 1.7 ± 0.1 and a cutoff energy of Ecut = 147+77−39 keV. In order to achieve
a more physical description of the source X-ray emission, we replaced the cutoff power-law model with the thermal Comp-tonization model
compps
, under the assumption of a slab ge-ometry (Poutanen & Svensson 1996). This model has been suc-cessfully applied in the past to a number of other AMXPs (see e.g.,Gierli´nski & Poutanen 2005;Falanga et al. 2005a,b,2007,2011;Ibragimov & Poutanen 2009;Bozzo et al. 2010). The new set of model parameters are the absorption column density NH,
the plasma temperature of the accretion column kTe, the
black-body temperature kTbb of the soft-seed photons assumed to be
injected from the bottom of the slab, the Thomson optical depth τT across the slab, and the inclination angle θ between the slab
normal and the line of sight. This model provides a fully ac-ceptable result (χ2
red/d.o.f. = 0.72/102) and we report all
val-ues of the best fit parameters in Table 3. The column density NH = (4+7−3) × 10
21 cm−2 turns out to be fully in agreement (to
Table 3. Best parameters determined from the fit to the broad-band spectrum of IGR J00291+5934 with the
compps
model.compps
NH(1021cm−2) 4+7−3 kTe(keV) 49 ± 12 kTbb(keV) 0.6+0.2−0.1 τT 1.4+0.5−0.3 cos θ 0.6 ± 0.2 Aseeda(km2) 48 ± 15 χ2 red/d.o.f. 0.72/102 Lbola(1037erg s−1) 0.21 ± 0.02Notes.(a)Assuming a source distance of 4 kpc (see Sect.6).
within the uncertainties) with that estimated previously NH ≈
2.8 × 1021 cm−2 from the Chandra and Swift observations
(Nowak et al. 2004;Torres et al. 2008;Bozzo et al. 2015a). The
compps
model also allows us to determine the apparent area ofthe hot spot region on the NS surface, Aseed≈ 48 (d/4 kpc) km2.
At the estimated distance of IGR J00291+5934 (see Sect.6), the radius of the hot spot is ≈4 km. We note that the spectral pa-rameters reported in Table3are comparable to those measured by Falanga et al. (2005b) during the source outburst in 2004. Figure3shows the unfolded measured broad-band spectrum to-gether with the residuals from the best fit model. In this fit, the normalization constants of the JEM-X and XRT data are 1.02 and 1.8, respectively compared to the ISGRI data fixed at unity. The large variability of the multiplicative normalization factor between XRT and ISGRI data may be due to the different ex-posure time. In addition, the XRT pointing is coincident with a small flare.
5. Timing analysis
We study the ephemeris and the pulse profile of
IGR J00291+5934 in the 20–150 keV energy range taking advantage of the relatively good statistics of the ISGRI data. For an AMXP timing analysis we have insufficient time-resolution both in Swift/XRT PC and WT modes. The timing accuracy of the ISGRI time stamps recorded on-board is about 61 µs. We convert all ISGRI on-board arrival times from the terrestrial time A88, page 4 of8
0.1 0.05 0.2 0.5 E F E (10 − 9 erg cm − 2 s − 1) IGR J00291+5934 1 10 100 − 4 − 20 2 4 χ Energy (keV)
Fig. 3.Unfolded measured broad-band spectrum of IGR J00291+5934 as observed by JEM-X (red points), ISGRI (green points) and Swift/XRT (black points). The best fit is obtained with the
compps
model with a plasma temperature kT ≈ 50 keV, which is represented in the figure with a solid black line. The residuals from the best fit are shown in the bottom panel.
(TT) reference system to the solar system barycenter (TDB). This barycentering procedure requires an accurate knowledge of the instantaneous spacecraft position and velocity, the best known (optical) pulsar position (Torres et al. 2008), and the solar system ephemeris (DE200) information. We excluded from this analysis events recorded during time periods where the ISGRI count rate behaves erratically (e.g., near perigeum ingress and egress, or during high solar activity). We further selected only events with rise times between channels 7–90 (Lebrun et al. 2003) from non-noisy pixels having a pixel illumination factor larger than 25%.
The spin period of IGR J00291+5934 is known to evolve in time (Patruno 2010;Hartman et al. 2011;Papitto et al. 2011) and thus the precise rotational frequency of the pulsar, as well as the correspondingly updated binary orbital parameters, can not be accurately predicted a priori for the outburst of 2015. We thus first performed a search for coherently modulated signals in the ISGRI data around the most probable pulsar rotational fre-quency, assuming binary parameters reasonably similar to previ-ously reported values. In order to maximise the signal to noise ratio of the data we additionally screened out events that are out-side the energy range 20–60 keV (see discussion inFalanga et al. 2005b). The systematic search was carried out by using a code based on a
simplex
optimisation scheme, that finds the global minimum of the Z21-test statistics (Buccheri et al. 1983) as a
function of the spin frequency and the time of the ascending node, Tasc. The arrival time of each event is first corrected for
the binary motion (thus involving the time of ascending node) and subsequently converted into a pulse phase using the assumed spin frequency (the other free parameter). The best parameters determined with this technique are νspin= 598.8921299(8) Hz at
epoch 57 231.0 MJD (TDB) and Tasc = 57 231.847035(25) MJD
(TDB) (Kuiper et al. 2015) with a detection significance of pul-sations of 5.2σ (uncertainties are given at 1σ confidence level).
The spin frequency measured by ISGRI in the outburst in 2015 is consistent, to within the relatively large uncertainties, with the value that can be predicted from the previous obser-vations in 2008 and taking into account any of the spin down torques reported by Patruno(2010),Hartman et al.(2011), and
Papitto et al. (2011). The updated value obtained for Tasc also
Table 4. Ephemeris of IGR J00291+5934 obtained from the INTE-GRAL observations.
Parameter Value
Epoch data start/end (MJD) 57 230.7–57 232.9
Frequency 598.8921299(8) Hz
Solar system ephemeris DE200
Epoch of the period (MJD; TDB) 57 231.0
Orbital period 8844.07672(2) s
axsin i∗ 64.990(1) (lt-ms)
Time of ascending node (MJD; TDB) 57 231.847035(25) Notes.(∗)FromPapitto et al.(2011).
counts
/bin
Pulse Phase
Fig. 4. Pulse profile of IGR J00291+5934 in different energy bands during its 2015 outburst. The pulsed emission is detected significantly by INTEGRAL up to the ∼150 keV energy band.
allows us to refine our knowledge on the system orbital pe-riod by fitting together all available measurements of the times of the ascending node. With this technique we obtain Porb =
8844.07672(2) s. We find no evidence for a change in the or-bital period and the corresponding 2σ upper limit on the oror-bital period derivative is ˙Porb= 1.1 × 10⁻¹²s s−1.
We phase fold the barycentered ISGRI times upon the up-dated 2015 ephemeris, given in Table 5. The resulting pulse-phase distributions are shown in Fig.4 for three different en-ergy bands. The Z12-significances are 4.6σ, 3σ and 5.4σ for the 20–60 keV, 60–150 keV and 20–150 keV bands, respectively. Thus, significant pulsed emission is detected for energies above 60 keV. We inspected the significance of the pulsed signal using the Z2
1statistics above 60 keV by progressively extending the
en-ergy range from 60–90 keV to 60–180 keV in steps of 30 keV. We find that the significance increased as function of the upper
A&A 599, A88 (2017)
0
0.02
0.04
Cts/s (15
−
20 keV)
SWIFT/BAT
0
100
200
300
400
0
50
100
150
200
Cts/s (0.3
−
10 keV)
Time (s)
SWIFT/
XRT
0
50
100
150
200
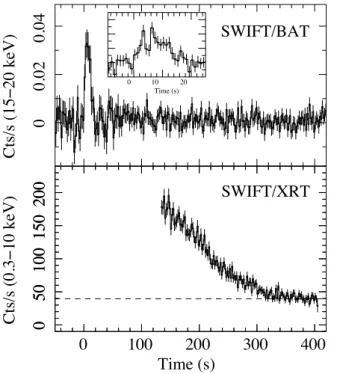
0 10 20 Time (s)Fig. 5.Type-I burst detected during its 2015 outburst. The burst start time is 57 228.0926 MJD. The upper panel shows the BAT light curve in the 15–25 keV energy range with a time bin of 2 s (1 s for the inset). The XRT light curve in the bottom panel shows that the narrow field instrument on-board Swift starts to observe the source ∼135 s after the onset of the event. The dashed line in this panel indicates the emission level of the X-ray background as measured ∼400 s after the burst. The burst is very energetic during the first ∼20 s with the tail of the black-body detected above 25 keV.
integration limit up to 150 keV and then flatten. This is consistent with the source emission being pulsed in the full energy range in which it is significantly detected.
6. Properties of the type-I burst
In Fig.5, we show the Swift/BAT 15–20 keV (upper panel) and XRT/WT 0.3–10 keV (lower panel) light curves of the only type-I burst observed so far from IGR J00291+5934. The burst start time of 57 228.0926 MJD corresponds to the point at which the X-ray intensity of the source in BAT increases by 15% with respect to the persistent level. The two plots in the figure suggest that the type-I burst is very energetic during the first ∼20 s, with the tail of the black-body emission becoming detectable above 25 keV. The WT light curve starts with a delay of ∼135 s af-ter the onset of the burst caught by BAT. The total duration of the burst, that is, the time to evolve away from and return to the persistent state, is ∼7 min.
To perform a time-resolved spectral analysis of the burst, we extract 9 XRT spectra during the event. All these spectra can be well fitted by using an absorbed black-body model (
bbodyrad
in XSPEC) with the absorption column density fixed at the value determined from the broad-band analysis (i.e., 4 × 1021 cm−2; see Table3). However, if we leave the NHvalue free to vary, wefind a value consistent with ≈4 × 1021cm−2. We plot in Fig.6the measured values of the apparent radius, Rbb, the colour
temper-ature, kTbb, and the bolometric luminosity, Lbol, of the thermal
emitting region.
The luminosity at the peak of the burst, Fpeak, is obtained
from BAT. The uncertainty derived from the spectral fit is in-creased by 20% as the energy range of the instrument is largely
01234
L
bol(10
38erg s
− 1)
123
kT
bb(keV)
5
10
R
bb(km)
0
100
200
300
400
1
1.5
χ
2 redTime (s)
1
1.5
Fig. 6.Evolution of the spectral parameters during the type-I burst, as measured from BAT (first point) and XRT. The bolometric luminosity and the
bbodyrad
radius are computed by using a distance of 4 kpc. The bottom panel shows the χ2redvalues for all fits. The dashed line in
the first upper panel represents the best determined exponential func-tion with which we fit the burst profile. It shows an e-folding time of τfit≈ 55 s.
outside the peak energy of the black-body (see for more details Fig. 4 in Falanga et al. 2009, and Bozzo et al. 2015b). Taking into account the errors on the NHvalue, this does not change the
20% uncertainty on the burst peak flux. All the other luminosities are obtained from the XRT fluxes extrapolated in the 0.1–35 keV energy range by generating ideal responses.
We fitted the burst decay with an exponential function and derive an e-folding time of τfit= 55 ± 11 s (see Fig.6). This is
similar to the value obtained as τtheo ≡ fb/Fpeak= 60 ± 15 s. In
Table5, we report the measured burst parameters. The estimated burst fluence is fb= Eburst/(4πd2)= 1.1 × 10⁻⁵erg cm−2, which
corresponds to the total energy release of Eburst= 2.1 × 1040erg
(at a source distance of d= 4 kpc, see below).
The BAT burst light curve rebinned at 1s (see the small in-set in Fig. 5) shows a double-peaked profile as evidence for a photospheric radius expansion (PRE; see e.g., Falanga et al. 2007). Assuming that the peak X-ray luminosity of the burst corresponds to the Eddington value LEdd = 3.8 × 1038 erg s−1
(as empirically derived by Kuulkers et al. 2003), we can thus estimate the source distance. We obtain d = 4.2 ± 0.5 kpc in case of a pure helium burst or d = 2.7 ± 0.5 kpc for a ther-monuclear burst ignited in material with a solar composition (X0 = 0.7). For comparison, we note that the theoretical value of
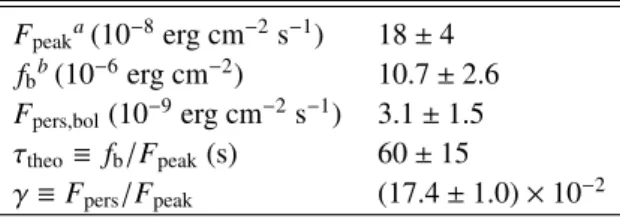
Table 5. Parameters of the type-I burst observed from IGR J00291+5934 during its 2015 outburst.
Fpeaka(10−8erg cm−2s−1) 18 ± 4
fbb(10−6erg cm−2) 10.7 ± 2.6
Fpers,bol(10−9erg cm−2s−1) 3.1 ± 1.5
τtheo≡ fb/Fpeak(s) 60 ± 15
γ ≡ Fpers/Fpeak (17.4 ± 1.0) × 10−2
Notes. (a) Unabsorbed flux (0.1–35 keV).(b) Net burst fluence (0.1–
35 keV).
the source distance calculated by assuming a helium atmosphere and canonical NS parameters (MNS= 1.4 M and RNS = 10 km)
would be d = 3.6 ± 0.5 kpc (Lewin et al. 1993). The estimated error on the distance is similar to those reported, for example, in
Kuulkers et al.(2003).
The amount of fuel liberated during the thermonuclear burn-ing can be estimated as Eburst/εHe, where Eburst= 2.1 × 1040erg
is the observed total energy released during the burst and εHe≈
1.6 MeV/nucleon ≈ 1.6 × 10¹⁸ erg g−1is the total available
nu-clear energy for the transformation of pure helium into iron-peak elements. We thus obtain Eburst/εHe ≈ 1.3 × 10²² g. This value
is consistent with the estimated total mass∆M accreted from the onset of the outburst to the start time of the thermonuclear burst (∆t = 2.52641 d). ∆M = ˙M∆t ≈ 1.3×10²²g, where ˙Mis derived
from the X-ray flux at a distance of 4 kpc and the usual accreting equation LX= GMNSM/R˙ NS(see, e.g.,Frank et al. 2002). For a
hydrogen type-I burst, the fuel burned during the thermonuclear burst would be ≈ 2.6 × 10²¹ g, which is one order of magnitude
lower than the measured total accreted matter (≈ 1.2 × 10²²g at d = 2.7 kpc). The energetics of this burst can thus be explained by assuming that it is a helium type-I burst triggered by unsta-ble helium burning, after any accreted hydrogen is exhausted by steady burning prior to the burst. We thus assume d ≈ 4 kpc as the fiducial distance to IGR J00291+5934.
At the distance of 4 kpc, the pre-burst persistent unabsorbed flux Fpers,bol≈ 3.1 × 10⁻⁹erg cm−2s−1translates into a
bolomet-ric luminosity of Lpers,bol ≈ 6 × 1036 erg s−1, or ≈ 1.6% LEdd.
The local accretion rate per unit area is then given by ˙m = Lpers(1+ z)(4πR2(GM/R))−1, that is, ˙m ≈ 3.3 × 10³ g cm−2s−1
(where the gravitational redshift is 1+ z = 1.31). At this local accretion rate, helium type-I bursts are expected following com-pletion of hydrogen burning, thus providing additional support to our conclusion above (e.g., Strohmayer & Bildsten 2006).
The observed energy of the type-I burst allows us to esti-mate the ignition depth by using the equation yign = Eburst(1+
z)(4πR2Q
nuc)−1 = 1.5 × 10⁹ g cm−2, where the nuclear
en-ergy generated for helium abundances (assuming a mean hy-drogen mass fraction at ignition hXi = 0) is Qnuc ≈ 1.6+
4hXi MeV/nucleon ≈ 1.6 MeV/nucleon (Galloway et al. 2004, and references therein), including losses owing to neutrino emis-sion following Fujimoto et al. (1987). The ignition depth is a particularly interesting parameter, as it regulates the recur-rence time between different bursts through the equation trec =
(yign/ ˙m)(1 + z). At the mass accretion rate corresponding to
the peak of the 2015 outburst shown by IGR J00291+5934 (1.6% LEdd for pure helium), the expected recurrence time is
∼7 d. Since the outburst from IGR J00291+5934 lasts less than a month and the continuous coverage provided by INTEGRAL is only 2.2 d, there is a high probability of missing another type-I burst. For a burst recurrence time of 7 d and for a total BAT
exposure time of ∼2 ks, the probability of observing a burst is 0.3%.
7. Summary and discussion
We have studied the spectral and the timing behaviours of IGR J00291+5934 during its outburst in 2015 by using the avail-able INTEGRAL and Swift observations. We have discussed the outburst recurrence time, that after the last three outburst inter-vals will drop to zero 8.4 yr after the July 2015 outburst. We have been able to detect the pulsed emission from the source up to the ∼150 keV. The standard binary evolution scenario suggests that the orbital period is caused by angular momen-tum loss through gravitational waves, or by magnetic brak-ing (Tauris & van den Heuvel 2006). The AMXP SAX J1808.4– 3658 has shown an orbital expansion, but one that is much faster than expected from the standard binary evolution theory (di Salvo et al. 2008; Hartman et al. 2008; Patruno et al. 2012, and references therein). For IGR J00291+5934 ˙Porbis consistent
with zero, at variance of SAX J1808.4–3658 and orbital evolu-tion predicevolu-tion. The single Swift pointings show no evidence of significant spectral variability and the average broad-band (1.1– 250 keV) spectrum is best fitted with a thermal Comptonization model.
We have also reported on the discovery of the first thermonu-clear burst emitted by the source and occurred around the peak of the 2015 outburst, roughly 2.5 d after the onset of the event. We have noted, that the type-I burst lasted ∼7 min, which is most similar to the “intermediate-duration” type-I bursts, that last be-tween 15–30 min and are powered by pure helium (see, e.g.,
in’t Zand et al. 2005;Falanga et al. 2008,2009). However, in the IGR J00291+5934 type-I burst the accretion rate is low enough to build up a thick layer of pure helium, and any accreted hydro-gen will be exhausted (via the hot CNO cycle) at the base of the layer within ∼10 h (Lampe et al. 2016). In this case we consider that the source accretes hydrogen matter with the solar hydro-gen fraction hXi= 0.7 and metallicity similar to solar with mass fraction of CNO elements ZCNO = 0.02. The burst recurrence
times are comparatively longer to reach ignition because there is no contribution from steady hydrogen burning at the base. This is in agreement with the accumulated mass and the inferred ig-nition column observed by IGR J00291+5934 for a helium igni-tion at low mass accreigni-tion rates. It is worth menigni-tioning that the calculated ignition depth is a factor of approximately ten larger than the typical short (tens of seconds bursts) for helium burst in high accretion rate sources, which means that the photon di ffu-sion time is also at least a factor of approximately ten larger. The presence of a possible PRE phase is identified by the double-peaked BAT data of the type-I burst, providing the opportunity to estimate the source distance with a relatively good accuracy at d= 4.2 ± 0.5 kpc. This value is within the previous estimated source distances ranging from 2 to 4 kpc (Galloway et al. 2005;
Jonker et al. 2005;Torres et al. 2008).
Acknowledgements. This research was financed by the Swiss National Sci-ence Foundation project 200021_149865. V.D.F. and M.F. acknowledge the Department of Physics at the University of Basel and especially Friedrich-K. Thielemann. V.D.F. and M.F. also thank the International Space Science Insti-tute in Bern for their support.
References
Alpar, M. A., Cheng, A. F., Ruderman, M. A., & Shaham, J. 1982,Nature, 300, 728
Arnaud, K. A. 1996, in Astronomical Data Analysis Software and Systems V, eds. G. H. Jacoby, & J. Barnes,ASP Conf. Ser., 101, 17
A&A 599, A88 (2017)
Bildsten, L., & Chakrabarty, D. 2001,ApJ, 557, 292
Bozzo, E., Ferrigno, C., Falanga, M., et al. 2010,A&A, 509, L3
Bozzo, E., Papitto, A., Sanna, A., et al. 2015a, ATel, 7852 Bozzo, E., Romano, P., Falanga, M., et al. 2015b,A&A, 579, A56
Buccheri, R., Bennett, K., Bignami, G. F., et al. 1983,A&A, 128, 245
Burrows, D. N., Hill, J. E., Nousek, J. A., et al. 2005,Space Sci. Rev., 120, 165
Courvoisier, T. J.-L., Walter, R., Beckmann, V., et al. 2003, A&A, 411, L53
di Salvo, T., Burderi, L., Riggio, A., Papitto, A., & Menna, M. T. 2008,MNRAS, 389, 1851
Falanga, M., Bonnet-Bidaud, J. M., Poutanen, J., et al. 2005a,A&A, 436, 647
Falanga, M., Kuiper, L., Poutanen, J., et al. 2005b,A&A, 444, 15
Falanga, M., Poutanen, J., Bonning, E. W., et al. 2007,A&A, 464, 1069
Falanga, M., Chenevez, J., Cumming, A., et al. 2008,A&A, 484, 43
Falanga, M., Cumming, A., Bozzo, E., & Chenevez, J. 2009,A&A, 496, 333
Falanga, M., Kuiper, L., Poutanen, J., et al. 2011,A&A, 529, A68
Ferrigno, C., Bozzo, E., Falanga, M., et al. 2011,A&A, 525, A48
Frank, J., King, A., & Raine, D. J. 2002, Accretion Power in Astrophysics: Third Edition (Cambridge, UK: Cambridge University Press)
Fujimoto, M. Y., Sztajno, M., Lewin, W. H. G., & van Paradijs, J. 1987,ApJ, 319, 902
Galloway, D. 2008, in 40 Years of Pulsars: Millisecond Pulsars, Magnetars and More, eds. C. Bassa, Z. Wang, A. Cumming, & V. M. Kaspi,AIP Conf. Ser., 983, 510
Galloway, D. K., & Cumming, A. 2006,ApJ, 652, 559
Galloway, D. K., Cumming, A., Kuulkers, E., et al. 2004,ApJ, 601, 466
Galloway, D. K., Markwardt, C. B., Morgan, E. H., Chakrabarty, D., & Strohmayer, T. E. 2005,ApJ, 622, L45
Galloway, D. K., Morgan, E. H., Krauss, M. I., Kaaret, P., & Chakrabarty, D. 2007,ApJ, 654, L73
Gierli´nski, M., & Poutanen, J. 2005,MNRAS, 359, 1261
Goldwurm, A., David, P., Foschini, L., et al. 2003,A&A, 411, L223
Gros, A., Goldwurm, A., Cadolle-Bel, M., et al. 2003,A&A, 411, L179
Hartman, J. M., Patruno, A., Chakrabarty, D., et al. 2008,ApJ, 675, 1468
Hartman, J. M., Galloway, D. K., & Chakrabarty, D. 2011,ApJ, 726, 26
Ibragimov, A., & Poutanen, J. 2009,MNRAS, 400, 492
in’t Zand, J. J. M., Cumming, A., van der Sluys, M. V., Verbunt, F., & Pols, O. R. 2005,A&A, 441, 675
Jonker, P. G., Campana, S., Steeghs, D., et al. 2005,MNRAS, 361, 511
Krimm, H. A., Holland, S. T., Corbet, R. H. D., et al. 2013,ApJS, 209, 14
Kuin, P., Page, K., Campana, S., & Zane, S. 2015,ATel, 7849, 1
Kuiper, L., Falanga, M., De Falco, V., et al. 2015,ATel, 7949, 1
Kuulkers, E., den Hartog, P. R., in’t Zand, J. J. M., et al. 2003,A&A, 399, 663
Lampe, N., Heger, A., & Galloway, D. K. 2016,ApJ, 819, 46
Lebrun, F., Leray, J. P., Lavocat, P., et al. 2003,A&A, 411, L141
Lewin, W. H. G., van Paradijs, J., & Taam, R. E. 1993,Space Sci. Rev., 62, 223
Lewis, F., Russell, D. M., Jonker, P. G., et al. 2010,A&A, 517, A72
Lipunov, V., Rebolo, R., Serra-Ricart, M., et al. 2015,ATel, 7835, 1
Lund, N., Budtz-Jørgensen, C., Westergaard, N. J., et al. 2003,A&A, 411, L231
Markwardt, C. B., Galloway, D. K., Chakrabarty, D., Morgan, E. H., & Strohmayer, T. E. 2004,ATel, 360, 1
Nowak, M. A., Paizis, A., Wilms, J., et al. 2004,ATel, 369, 1
Papitto, A., Riggio, A., Burderi, L., et al. 2011,A&A, 528, A55
Papitto, A., Ferrigno, C., Bozzo, E., et al. 2013,Nature, 501, 517
Patruno, A. 2010,ApJ, 722, 909
Patruno, A., & Watts, A. L. 2012, ArXiv e-prints [arXiv:1206.2727] Patruno, A., Bult, P., Gopakumar, A., et al. 2012,ApJ, 746, L27
Poutanen, J. 2006,Adv. Space Res., 38, 2697
Poutanen, J., & Svensson, R. 1996,ApJ, 470, 249
Remillard, R. 2004,ATel, 357, 1
Sanna, A., Pintore, F., Riggio, A., et al. 2015,ATel, 7836, 1
Shahbaz, T., Linares, M., Nevado, S. P., et al. 2015,MNRAS, 453, 3461
Strohmayer, T., & Bildsten, L. 2006, in Compact stellar X-ray sources, eds. W. H. G. Lewin, & M. van der Klis, Camb. Astrophys. Ser. 39 (CUP), 113 Tauris, T. M., & van den Heuvel, E. P. J. 2006, in Formation and evolution of
compact stellar X-ray sources, eds. W. H. G. Lewin, & M. van der Klis, 623 Torres, M. A. P., Jonker, P. G., Steeghs, D., et al. 2008,ApJ, 672, 1079
Ubertini, P., Lebrun, F., Di Cocco, G., et al. 2003,A&A, 411, L131
Watts, A. L., & Strohmayer, T. E. 2006,MNRAS, 373, 769
Wijnands, R. 2006, in Trends in Pulsar Research, ed. J. A. Lowry (New York: Nova Science Publishers Inc.), 53
Wijnands, R., & van der Klis, M. 1998,Nature, 394, 344
Winkler, C., Courvoisier, T. J.-L., Di Cocco, G., et al. 2003,A&A, 411, L1