The advantage of the “split” turbocharger in Formula 1 engines
Luca Piancastelli1*, Filippo Peli1, Eugenio Pezzuti21 Dept. of Industrial Engineering, Alma Mater Studiorum University of Bologna, Viale Risorgimento, 2 - Bologna, Italy 2 Università di Roma "Tor Vergata", Dip. di Ingegneria dell’Impresa "Mario Lucertini”, Via del Politecnico, 1 - Roma, Italy Corresponding Author Email: [email protected]
https://doi.org/10.18280/ti-ijes.620105 ABSTRACT
Received: 14 January 2018 Accepted: 12 March 2018
The 2014 Formula 1 season was characterized by the return of supercharging through turbocharger in a complex hybrid propulsion system. The new direct-injection turbocompound engines V6 of 1600cc have innovative systems for the recovery of the energy otherwise wasted (Energy Recovery System - ERS). The following article introduces a one-dimensional simulation of two different engine concepts. The first one is the “split turbocharger” arrangement that allows the design of a very short “log” exhaust; the other with a traditional short-shaft turbocharger that needs a more complex and longer “tubular” exhaust. The paper demonstrates that the longer “tubular” exhaust dissipates more energy that the shorter “log” one. In this way, the efficiency is impaired and the “log” exhaust makes it possible to have more energy available to the wheels with the same amount of fuel and with the same limitation on the fuel flow. Therefore, with the current limitations in the fuel, the “log” exhaust / split-turbo arrangement is more convenient for current Formula 1 engines. In this paper, loads, pressures, power and speed of the various components of the turbocompound engine were simulated. A standard turbocharger compressor and turbine were used for the log and tubular exhaust arrangement and the results were compared. Even if the turbocharger matching is not optimal, in fact the boost pressure does not reach the maximum allowed, the comparison between the two arrangements is still valid.
Keywords:
formula 1, engines, split turbo,
turbocompound simulation
1. INTRODUCTION
The introduction of hybrid engines marked the beginning of a new era for most vehicles, not only in terms of consumption but also of polluting emissions. A problem that has become increasingly important in recent years. This requirement has restricted the use of a classical internal combustion engines in favor of a hybrid electric “cleaner” propulsion, with the aim of reducing carbon dioxide, NOx and particulate matter. In fact, the use of turbocharged engines, with hybrid elements in Formula one, was explained with the possibility to recycle racing “products” into serial production. The “old” Formula 1 had already a hybrid recovery system, namely the KERS [1] (Kinetic Energy Recovery System). This system, in the most popular and successful version, was composed by an electric/motor generator that recovered the energy from the brakes and gave it back to the wheels when most needed. In 2014, The Fédération Internationale de l’Automobile introduced the downsizing of the previous naturally-aspirated 2.4-litre V8 engines to the new 1.6 liter V6 turbo-compound engines [2-4]. The new regulations include multiple energy recovery systems and fuel flow restrictions, to improve propulsion efficiency and reduce emissions. This complex power-unit controls the propulsion and the braking (recovery) of the car. In particular, the ICE (Internal Combustion Engine, V6-90°, about 600kW of power) (Energy Recovery System). The ERS consists of two brushless-type synchronous motor-generators, called MGU (Motor Generator Unit). The MGU-K, where K stands for Kinetic, recovers the braking energy. The MGU-H, where H stands for Heat, recovers the energy
from the turbocharger shaft. When in generator mode, the MGUs charge the battery for energy storage. The MGU-H can also directly transfer the energy to the wheels through the MGU-K when it works as a motor. When the MGU-H works as a motor, it acts directly on the turbocharger shaft to keep the required speed or increase the acceleration of the turbocharging unit. The new turbocharged engine crankshaft velocity is limited to 15,000 rpm. The MGU-K adds a maximum of 160HP of recovered energy from the battery. The fuel quantity for the race is limited to 100 kg (-35% from 2013) and the fuel flow rate can be no higher than 100 kg/h. Therefore, the nominally unlimited turbo boost pressure stays around 3.5 bar. The turbocharger maximum speed is limited to 125,000 rpm. The MGU-H converts heat energy into electric power that is stored in the battery and can later be re-deployed to reduce the turbo lag to near zero to match the instant torque delivery of the V8. In this way, the system does the job of a normal wastegate. Therefore, the MGU-H absorbs power from the turbocharger shaft and it can improve the matching of the turbocharger to the air requirement of the engine. The MGU-K recovers the energy only from braking. The MGU-MGU-K will generate three times as much power as the old V8 KERS unit did. Therefore, its contribution is fundamental. The battery has a minimum mass of 20kg. Under acceleration, the internal combustion engine uses its reserve of fuel. The turbocharger will be rotating at maximum speed. The MGU-H acts as a generator and recovers energy from the energy lost in the exhaust and passes it to the MGU-K and the battery. The MGU-K, which acts on the crankshaft of the Internal Combustion Engine (ICE), works as a motor and deliver
TECNICA ITALIANA-Italian Journal of Engineering Science
Vol. 61+1, No. 1, June, 2018, pp. 36-41 Journal homepage: http://iieta.org/Journals/TI-IJES
additional power to pull harder or save fuel, depending on the control electronic software. At the end of the straight, the driver lifts off for braking for the corner. At this point, the MGU-K becomes a generator and recovers the energy dissipated in the braking event, to charge the battery. Under braking, the MGU-H turns to a motor and powers the turbo, keeping the rotational speed as close to the optimum minimum value to reduce the turbolag. In this condition, a direct energy transfer from the MGU-K to the MGU-H is also possible. When the driver exits the corner and throttles up, the MGU-H returns to the generator mode, and picks up the energy from the exhaust gases. The energy recovered can either power the MGU-K to keep the fuel burn as low as possible or charge the battery. Over the course of the lap, this balance between energy harvesting, energy deployment and fuel burn are optimized to obtain the fastest lap possible, the maximum efficiency, or the maximum instantaneous power. Power scheduling is therefore a complex problem and depends on fuel availability, fuel flow and driver requests. Energy recovery systems are allowed to have a maximum power of 120 kW (160 HP) from the MGU-K and 2 MJ per lap. In the 2015 season, the Mercedes engine was the most powerful with 870 HP. Table 1 summarizes the main data of a Formula 1 propulsion unit.
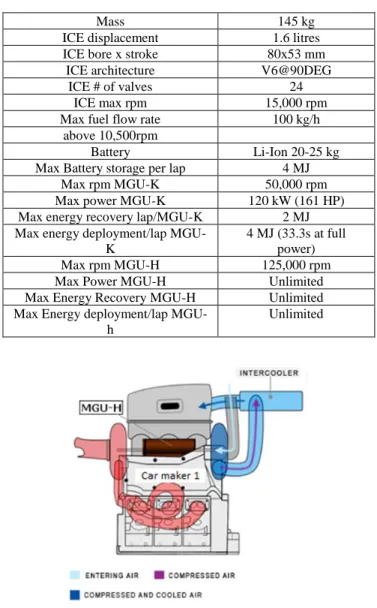
Table 1. Technical data of a F1 propulsion unit (2015)
Mass 145 kg
ICE displacement 1.6 litres
ICE bore x stroke 80x53 mm
ICE architecture V6@90DEG
ICE # of valves 24
ICE max rpm 15,000 rpm
Max fuel flow rate 100 kg/h
above 10,500rpm
Battery Li-Ion 20-25 kg
Max Battery storage per lap 4 MJ
Max rpm MGU-K 50,000 rpm
Max power MGU-K 120 kW (161 HP)
Max energy recovery lap/MGU-K 2 MJ
Max energy deployment/lap MGU-K
4 MJ (33.3s at full power)
Max rpm MGU-H 125,000 rpm
Max Power MGU-H Unlimited
Max Energy Recovery MGU-H Unlimited
Max Energy deployment/lap MGU-h
Unlimited
Figure 1. “Car-maker 1”: “split type” turbocharger
2. THE POWER UNIT: EXHAUST SYSTEM LAYOUT A main layout difference is clearly visible by comparing Figure 1 and Figure 2. Figure 1 shows a “split-type” turbocharger with a long connecting shaft that allows the compressor and the turbine to be placed in the front and in the rear of the engine [5].
Figure 2. “Car-maker” 2: “normal turbocharger” in rear position
This solution allows shorter exhausts, with mechanical problems on the shaft design. The second (Figure 2), more classical solution. has a “normal” short-shafted turbocharger with a smaller connecting shaft, at the price of longer exhaust system. In this paper, this longer exhaust of figure 2 will be called “tubular type”. The shorter one of Figure 1 is called “log type”. The separation from hot (turbine) to cold (compressor) side of the turbocharger (split-turbo solution) means less interferences from the high gas temperature, outgoing from cylinders (at temperature of about 1300K), with inlet air in the intake system and the use of a shorter exhaust system, to the benefit of turbine efficiency and turbo-lag reduction. The fundamental advantage of the shorter exhaust system (the log type) is in terms of lower pressure loss ∆Pd (1). The other
fundamental advantage of the shorter exhaust system (the log type) is the higher temperature at turbocharger inlet with higher energy available for the MGU-H and the turbine (1).
ΔP
d=
8Kaṁ2
π2D4ρ
L
(1) In fact, pressure loss is linearly dependent with the length (L). In addition, shorter exhaust systems have a better empirical friction factor Ka that depends also on exhaust geometry and roughness. Equation (2) sums the concentrated and distributed pressure losses. Both are higher in the tubular exhaust.
ΔP
tot= ∑
(
8KaLi π2D4ρ i+
8 π2D i 4ρ i∑
miK
cij)
j=1 n i=1ṁ
2(2)
The power in output from the crankshaft is equal to (3):
P =
λ Vρ α+1 2n τ 1 60H
iη
e(3)
The power usually can be varied acting on rotational speed, or by keeping constant the rotational speed and vary the load (by acting on λ). All the supercharging system increase the inlet air density by recovering energy from the exhaust. A fluid density larger than the atmospheric one, allows you to increase the amount of fuel injected and the output power. Therefore, the amount of energy recovered from the exhaust is critical. The higher is outlet temperature from the engine exhaust system to the inlet of the turbocharger, the higher will be the useful work recovered by turbine (4-8):
(4)
(5)
(6)
(7)
(8)
Equation (6) shows that the available energy to the turbine W depends on enthalpy of exhaust gas h4 and external air h5. Enthalpy depends on temperature (7). In particular the larger is the temperature at engine-exhaust-outlet t4, the greater will be the work recovered by the MGU-H. In fact, if t4=1273K and t5=900K the isentropic energy W available from the exhaust for each intake air kilogram, is (9):
W = h
4-h
5≈ 990
KJ Kg(9) The energy required for an ideal compression, with a compression ratio of 3, is approximately equal to Wc=320
kJ/kg. The difference between W and Wc is the amount of
energy that can be recovered by the MGU-H of the ERS. 3. THE POWER UNIT
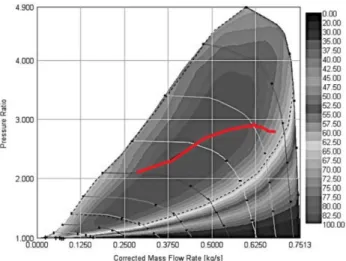
The Garrett GTX4294R compressor (Figure 3) with GT4294R turbine (Figure 4, red line) seems to be the best compromise among commercial turbochargers. The turbine-increased size is due to the high temperatures in the entry area. Using a software for one-dimensional flow analysis, there is the possibility to simulate the regions of highest level of performance, and therefore the efficiency, of both components (compressor and turbine), evaluated between 8.000 and 15.000 RPM of engine. Two identical turbocompound models were defined with the only difference of exhaust system layout.
The main features that will be evaluated to compare the two different configurations will be engine power, torque, operating conditions and efficiency of the turbocharger system. In fact, the ICE (Internal Combustion Engine) is identical for the two configurations. Model simulation results with LOG exhaust are shown in Table 2 and Figures 5-7.
With log exhaust, the maximum power is 803HP and the maximum torque is 471 Nm at 11,000 rpm (figure 5).
Figure 3. GTX4294R compressor map (from Garrett on-line catalogue)
Figure 4. GTX4294R turbine map (red line). Source: Garrett on line catalogue
Table 2. Speed, torque and power with the LOG exhaust
Engine Speed
[rpm] Brake Torque [Nm] Brake Power [HP]
8000 343 385 9000 398 503 10000 464 652 11000 471 728 12000 464 782 13000 437 799 14000 408 802 15000 381 803
Figure 5. Power, torque curve of ICE with LOG exhaust
Figure 6. Working curve on compressor-map for the LOG exhaust ICE
The working curve on the compressor map is shown in figure 6. The matching seems to be nearly optimal. The working curve on the turbine map is shown in figure 7.
Figure 7. Working curve on the turbine map for the LOG exhaust ICE
Operation of turbine and compressor lie in regions of maximum efficiency. Furthermore, the operating limits (max RPM: 125,000, max pressure ratio: 3.5bar) imposed by the
FIA have been complied with. As it can be seen margins are present to improve power output. The maximum pressure can be increased from 3 to 3.5 bar. A different compressor with an ad hoc design will probably obtain this result.
Table 3 and figures 8-9 show the results of the simulation results with the TUBULAR exhaust.
Table 3. Speed, torque and power with the TUBULAR exhaust Engine Speed [rpm] Brake Torque [Nm] Brake Power [HP] 8000 343 386 9000 394 499 10000 456 640 11000 463 716 12000 461 778 13000 434 793 14000 403 793 15000 377 794
Figure 8. Power, Torque curve of ICE with TUBULAR exhaust
The maximum power of the ICE with tubular exhaust is 794kW with a maximum torque of 463 Nm at 11,000rpm. Figure 8 shows the power and torque curve for the ICE with tubular exhaust. Figure 9 shows the working curve on compressor-map for the tubular exhaust ICE. Also in this case the working curve of the compressor is in region of maximum efficiency (albeit less than the Log). Furthermore, the operating limits (max RPM: 125,000, max pressure ratio: 3.5 bar) imposed by the FIA have been complied with. In addition, in this case, margins are present to improve power output. The maximum pressure can be increased from 3 to 3.5 bar. A different compressor with an ad hoc design will probably obtain this result. Figure 9 shows compressor-working curve for the engine with the TUBULAR exhaust. Again, an optimized compressor would output a higher torque at low rpm. In fact, commercial turbochargers are rarely perfectly matched to a specific engine.
In the case of the tubular exhaust, the turbine is in a far less efficient region (see Figure 10). In fact, the log exhaust allows the turbine to rotate faster, with higher efficiency and to develop more power. For example, the log turbine outputs 101kW at 15,000 rpm (ICE), against 89kW at 15,000 rpm for the tubular exhaust. Also the first four points of the curve (8, 9, 10, 11 krpm, see arrow in Figure 10) for the turbine curve are out of the maximum turbine efficiency region for the tubular exhaust ICE. Therefore, the turbocharger will be
slower in acceleration or will need more power from the MGU-H. Table 4 shows the turbine working points with the log exhaust. Table 5 shows the turbine working points with the tubular exhaust.
Figure 9. Working curve on compressor-map for the tubular exhaust ICE
Figure 10. Working curves on turbine-map for the tubular and log exhaust ICE
Table 4. Speed, mass flow, power required and efficiency of the turbine at full load (engine with LOG exhaust)
Speed [rpm] Mass flow rate [kg/s] Power [kW] ηt [%]
82,880 0.22 18 71 88,549 0.29 31 63 98,567 0.37 52 59 103,775 0.43 66 56 108,839 0.47 80 55 114,134 0.5 89 55 111,984 0.51 95 55 117,136 0.52 101 55
Table 5. Speed, mass flow, power required and efficiency of the turbine at full load (engine with TUBULAR exhaust)
Speed [rpm] Mass flow rate [kg/s] Power [kW] ηt [%]
82,625 0.22 16 68 88,102 0.29 28 61 97,923 0.37 46 58 103,084 0.42 58 57 108,150 0.47 71 55 111,265 0.5 78 55 113,388 0.5 83 55 116,416 0.52 89 55 4. CONCLUSIONS
The simulation results showed that the same engine has a larger power, if it has a log type exhaust (803HP (log) against 794HP (tubular). The difference in terms of power is not very large, although in favor of the log exhaust, but the turbine-working region is even more penalized. Figures 10 shows that the turbine works in regions of higher efficiency with log exhaust, especially at low engine rpm. In this way, the turbolag phenomenon is minimized, as the turbocharger rotational speeds are higher for all the eight cases (from 8,000 to 15,000 rpm of the engine crankshaft) taken into consideration (Tables 4 and 5). Finally, the turbine with the log exhaust delivers a larger power (101 kW against the 89 kW of the tubular exhaust) to the advantage of the MGU-H system that in this way manages to recover a higher quantity of energy. This last point, in Author’s opinion, is the most important issue. In fact, the maximum energy that the MGU-H can recover at every lap is without any restriction form the technical regulations. This absence of limitations means that a system characterized by an excellent design, and therefore efficiency, allows the car to take full advantage of those additional power (about 160HP) deriving from the ERS system. The larger rotation speed of the turbine occurs because the log exhaust, of smaller length, allows the gas to lose a lower energy content in the ducts, thus making available to the turbine a higher enthalpy value of the gases and, consequently, to the turbocompound engine. The log arrangement of the exhaust, allowed by the split-turbocharger, is more efficient and more powerful.
REFERENCES
[1] Piancastelli L, Frizziero L, Pezzuti E. (2014). Kers applications to aerospace diesel propulsion. Asian Research Publishing Network (ARPN). Journal of Engineering and Applied Sciences 9(5): 807-818. [2] Fédération Internationale de l’Automobile
https://www.fia.com/sites/default/files/regulation/file/1- 2014%20TECHNICAL%20REGULATIONS%202014-01-23_0.pdf. Accessed: 2018-03-26.
[3] Piancastelli L, Frizziero L. (2014). Turbocharging and turbocompounding optimization in automotive racing. Asian Research Publishing Network (ARPN). Journal of Engineering and Applied Sciences 11(9): 2192-2199. [4] Upendra K, Grauers A. (2014). Analysis of 2014
Formula one hybrid powertrain. Swedish Hybrid Vehicle Centre. Chalmer University of Technology.
http://hybridfordonscentrum.se/wp- content/uploads/2015/02/Analysis-of-2014-formula-one-hybrid-powertrain_ver1.pdf. Accessed: 2018-03-26. [5] Piancastelli L, Burnelli A, Cassani S. (2017). Validation of a simplified method for the evaluation of pressure and temperature on a RR Merlin XX head. International Journal of Heat and Technology 35(1): 549-558. https://doi.org/10.18280/ijht.350311
NOMENCLATURE
Sym. Description Unit
ka Friction coefficient -
m’ Mass flow kg s-1
ρ Mass density kg m-3
L Pipe length m
kcj Pressure drop coefficient -
V Engine displacement m3
λ Volumetric efficiency -
α Air mass/Fuel mass -
n ICE crankshaft velocity rpm
Hi Lower heating value J
τ # strokes -
ηe Engine efficiency -
p5 Outside air pressure Pa
p4 Pressure at turbocharger inlet Pa
T5 Temperature at turbocharger inlet K T4 Temperature at turbocharger outlet K PRT Pressure ratio turbocharger
compressor
-
γ Heat capacity ratio -
Cp Heat capacity at constant pressure
J K-1kg-1
ηad Compressor efficiency -