Università degli Studi di Ferrara
DOTTORATO DI RICERCA IN
"Scienza della Terra"
CICLO: (XXI)
COORDINATORE: Prof. Luigi Beccaluva
Geochemical and Isotopic Composition of Natural Waters in the Central
Main Ethiopian Rift: emphasis on the study of source and genesis of
fluoride
Settore Scientifico Disciplinare GEO/07
Dottorando
Dott. Godebo Tewodros Rango
______________________
(firma)
Tutore
Prof. Luigi Beccaluva
_______________________ (firma) Co-Tutore Dr. Gianluca Bianchini ________(firma)______________ _ Anni 2006/2008
LIST OF CONTENTS………PAGES List of contents……… …. 2 Acknowledgments……… 4 Dedication……… 6 List of Figures………... 7 List of Tables……… 10 List of appendices………. 12 Abbreviations……… 13 Abstract……… 15 Italian abstract………. 18 1. General introduction……… 21
2. Description of the central Main Ethiopian Rift (MER) ……….. 24
2.1. Morphology and Hydrology………. 24
2.2. Geothermal activities……… 28
2.3. Climate and vegetation………. 29
2.4. Soils……….. 30
2.5. Settlements and water supply………... 30
2.6. Significance of the Ethiopian rift system……….. 31
2.7. Geological settings……… 35
3. Geochemistry of rocks and sediments from the central MER……….. 37
3.1. Rock/sediment sampling and analytical techniques……….. 37
3.2. Chemical and mineralogical composition of rocks……… 37
4.5.1. Base-exchange softening……… 54
5. Geochemistry of elements in waters and experimental leachates……….. 60
5.1. Trace (and Major) elements composition in natural waters. ……….. 60
5.2. Trace (and major) elements composition in the experimental leachates………. 69
6. Origin and genesis of the geochemical anomalies observed in the MER waters……… 76
6.1. Origin of fluoride and arsenic……….. 76
6.2. Genesis……… 77
6.2.1 Clues on the enrichment mechanism of fluoride and arsenic……….. 77
7. Column experiment on volcanic ash……….. 80
7.1. Introduction……….. 80
7.2. Sampling and analytical techniques………. 80
7.3. Moment analysis and numerical modelling………. 84
7.4. Geochemistry of pyroclastic ash………. 85
7.5. Geochemical composition of leachates……… 87
7.6. Tracer tests and model results……….. 92
8. Geochemistry of isotopes in waters and rocks……… 96
8.1. Introduction……… 96
8.2. Sampling and analysis of δD, δ18O and 87Sr/86Sr isotopes. ……… 97
8.3. Delta Notation of Stable Isotope Data……….... 98
8.4. Defining the local meteoric water line (LMWL) ……… 99
8.5. Stable δ18O, δD and radiogenic (87Sr/86Sr) isotope composition of waters and rocks….. 102
9. Conclusions and recommendations……… 113
10. References………. 116
ACKNOWLEDGEMENTS
First and foremost, I would like to thank the University of Ferrara for initiating research collaboration with Addis Ababa University, Ethiopia, through the proposition of this PhD program. The financial grant from the University of Ferrara is gratefully acknowledged.
I am greatly indebted to my primary supervisor, Director of the Doctorate program, Prof. Luigi Beccaluva, for significantly supporting and facilitating this research activity. I sincerely thank my co-supervisor, Dr. Gianluca Bianchini, University of Kingston, England, who was most available and responsible in supporting this research through close consultations and for providing assistance and alternative views in my perspective which significantly improved the quality of the research outcome. I would also like to thank Prof. Paolo Billi, for being the main link between Addis Ababa and the University of Ferrara and for making this PhD opportunity possible. I am thankful for his valuable assistance in academics as well as his willingness to support other aspects of my life.
I am also thankful for Prof. Riccardo Petrini and Dr. Barabara Stenni, University of Trieste, Italy, for providing analytical facilities for isotope analysis and for their valuable consultations as well as Dr. Renzo Tassinari, University of Ferrara, Italy, for kindly carrying out all the necessary analytical analyses (AAS, ICP-MS, and XRF).
I would like to thank Dr. Dereje Ayalew, Dr. Mohammed Umer and Dr. Bekele Abebe from Addis Ababa University, Ethiopia, for being responsible and having the confidence in me so as to choose to involve me in this PhD program.
I would like to thank all the staff members (Claudio, Costanza, Barabara, Elena, Mattia and Alexandro) in the department of Earth sciences, Ferrara for the support that helped to make the transition to life in Ferrara an easy one.
My deepest heartfelt gratitude goes to my family who are the source of my strength and inspiration which makes me work hard and do my best. They will always be one of the main reasons to keep me on the right track in difficult times. I thank my father who first directed and supported my education life. This may be one of the most valuable moments to thank my mother, for her unconditional love, consistent care and support since my childhood.
I also thank to my close relatives, all friends and colleagues who have accompanied and assisted me all along. I am very much thankful.
Tewodros Rango Godebo University of Ferrara March, 2009
Dedicated to my mother Askale Enderias
LIST OF FIGURES………... PAGES
Figure 2.1: Tectonic map of the central MER in Ziway-Shala basin. ……… 25
Figure 2.2: Partial view of Lake Langano……… 26
Figure 2.3: Partial view of Chitu Crater Lake with flamingos. ………... 27
Figure 2.4: Deep (>2 kms) geothermal well at Aluto-Langano geothermal field. ……….. 28
Figure 2.5: Hot spring close to Lake Chitu with the local community taking water for domestic use (photo: January 2007)………... 29
Figure 2.6: Community water supply well from the study area……… 31
Figure 2.7: Simplified geologic map of the study area (Ziway-shala lakes basin) modified from Dainelli et al. (2001)………... 35
Figure 2.8: Fluvio-lacustrine sediment, east of Lake Shala. ……… 36
Figure 2.9: Pumice deposit, northeast of Lake Ziway………... 36
Figure 3.1: TAS diagram of volcanic rocks from the central MER……… 40
Figure 4.1: Simplified geologic map of the study area (Ziway-shala lakes basin) modified from Dainelli et al. (2001) reporting the localities of water sampling……… 45
Figure 4.2: Langelier and Ludwig, 1942 diagram showing compositions of different water types of the central MER in Ziway-Shala basin……… 47
Figure 4.3: Leaching test results: a) Na+ versus pH; b) F¯ versus pH c) F¯ versus Na d) F¯ versus HCO3¯... 51
Figure 4.4: Average elemental concentrations of the leachates: Sediment leachates are more enriched by Na+ and HCO3− than the rock leachates. (Values are expressed in mg/L)……… 52
Figure 4.5: Relationship between pH, F¯, Na+, HCO3¯, Ca2+ and Mg2+ in waters of the central MER in Ziway-Shala basin.………... 53
Figure 4.6: Fluorite and calcite Saturation indices of various water types of the central MER in Ziway-Shala basin..……… 56
Figure 4.7: a) HCO3¯versus Na+ and, b) F¯ versus TDS in waters of the Ziway–Shala basin. Note the different behaviour of samples characterized by Na+/ HCO3¯ ratio above and below unity………. 58
MER groundwater wells……… 65
Figure 5.2: Arsenic relationships with F−, Mo, V, U, Rb, Fe and Mn in the
MER groundwater wells……….. 66
Figure 5.3: Map of F− distribution in the MER natural waters……… 67
Figure 5.4: Map of As distribution in the MER natural waters. ………. 68
Figure 5.5: Concentrations of F, As, Fe, Al, Mn, Mo and U in leachates compared with
WHO (EU directives, 1998 for Fe and Mn) guideline values (dotted lines). Note that all concentrations are expressed in μg/L except for F (in mg/L). TW9, TW11, TW29, TW30 and TW31 are rocks and TW14, TW15, TW22, TW34, TW39 and TW43 are sediments. -: below detection limit………... 71
Figure 5.6: Concentrations of Li, Sr and V in leachates. Note that all concentrations are
expressed in μg/L TW9, TW11, TW29, TW30 and TW31 are rocks and TW14, TW15, TW22, TW34, TW39 and TW43 are sediments……….. 72
Figure 5.7: Percentage proportion of trace elements extracted in leachates (average of all
the available rocks and sediments leachates)………... 73
Figure 5.8: Leaching test results: Relationship between of As and F with pH, Na, and
HCO3. Note that the extreme As value (220µg/L) from the TW22 sediment
leachate is excluded………. 74
Figure 7.1: Simplified geologic map of the study area modified from Dainelli et al. (2001)
with sampling location………. 82
Figure 7.2: Schematic diagram of the column experimental set-up………. 83
Figure 7.3: Backscattered SEM image of the studied ash. Light grey represents both the
glass phase and alkaline feldspar, whereas white grains are aegirina pyroxene crystals. Note the vesicles that characterize the pumice fragments……… 86
Figure 7.7: 3D-Column diagram showing the behaviour of F− leaching with time for the
fine, coarse and raw ash leachates.……….. 91
Figure 7.8: Calculated tracer concentration and observed breakthrough curves for the raw
column (black line and triangles); for the coarse ash column (light dark line and circles) and for the fine ash column (black dashed line and crosses)……... 93
Figure 7.9: Calculated and observed tracer concentration breakthrough curve for the raw,
coarse and fine ash column……….. 95
Figure 8.1: LMWL in Ziway-Shala basin defined using all precipitation data (Appendix 8.1).. 100 Figure 8.2: LMWL in Ziway-Shala basin defined after excluding samples affected by
evaporation. Excluded samples are indicated in Appendix 8.1……… 101
Figure 8.3: δD and δ18O of the various water types compared with GMWL and LMWL…… 103 Figure 8.4: Regional groundwater flow directions at the upper part of central MER in
Ziway-Shala basin………... 105
Figure 8.5: Regional groundwater flow directions at the lower part of the central MER
in Ziway-Shala basin………. 106
Figure 8.6: Delta 2H versus Cl¯ ratio in the hydrothermal waters of the central MER……… 109
Figure 8.7: Delta 18O versus Cl¯ in the hydrothermal waters of the central MER…………... 110
Figure 8.8: Delta 2H versus B/Cl ratio of hydrothermal waters of the central MER………… 110
Figure 8.9: K versus B in the hydrothermal waters of the central MER……….. 111
LIST OF TABLES………...PAGES Table 2.1: Basic hydrological data of the lakes (Wood and Talling, 1988, Chernet, 1982
and Ayenew, 1998) ………. 27
Table 3.1: Bulk rock XRF analyses of the MER rocks and sediments………... 38 Table 3.2: Microprobe analyses on amphibole and volcanic glass of rhyolitic ignimbrites… 41
Table 3.3: Summarized (average and maximum) concentrations from microprobe analyses
on amphibole and volcanic glass of rhyolitic ignimbrites………….……… 41
Table 4.1: Major ion hydrochemical compositions (in mg/l) of MER waters from Rivers,
hot springs, geothermal wells, groundwater wells, cold springs, and lakes in the Ziway-Shala basin. WL=Groundwater wells, HS=Hot springs, CS=Cold springs, GWL=Geothermal wells, LW= Lakes (ID: 23=Langano, 24=Awasa, 25=Chitu, 26=Shala, 27=Abijata, 28=Ziway), RI= Rivers (ID: 1=Bulbula, 2=Meki, 3=Ketar); bdl = below detection limit. X and Y are geographic coordinates expressed in degree decimal……… 44
Table 4.2: Major ion chemical compositions of the leachates with TDS, EC and pH values.. 52
Table 5.1: Trace elements hydrochemical composition (in µg/l) of MER waters from
Rivers, hot springs, geothermal wells, groundwater wells, cold springs, and lakes in the Ziway-Shala basin. WL= Groundwater wells, HS=Hot springs, CS=Cold springs GWL= Geothermal wells, LW= Lakes, RI= Rivers, nm= not measured, LOD= Limit of Detection in diluited samples, DF= Dilution Factor applied in each samples, bdl = below detection limit. The geographic coordinate from major elements applicable for trace elements as well. ………. 62
Table 5.2: International water quality standards for drinking water, and percentage of MER
Table 5.4:Elements found in the leachates exceeding the concentration limit set by (WHO, 2006) applied for F, As, Al, U and Mo, and (EU directives, 1998) for Fe and
Mn……… 70
Table 6.1: PHREEQC calculations of saturation indices for selected mineral phases and
selected water samples. WL= Groundwater wells, HS=Hot springs, CS=Cold springs, GWL= Geothermal wells, LW= Lakes, RI= Rivers and (a): amorphous phasel, SI=saturation index………... 79
Table 7.1: Bulk XRF analysis of major oxides (wt%) of the pyroclastic ash. Note: the
detection limit for all major oxides ~0.01 wt%……….. 85
Table 7.2: Average (wt%) composition of the glass phase carried out by in-situ SEM
microanalysis of glass particles. ……… 85
Table 7.3: Major ions compositions from the column experiment for a) fine ash b) coarse
ash and c) raw ash………. 88
Table 7.4: Moment analysis results for the three columns……….. 92 Table 7.5: Lists of volcanic ash grain size distribution, hydraulic conductivity, bulk density
and total porosity.……… ………... 93
Table 8.1: Major ions hydrochemical compositions (in mg/L) of the central MER waters
from hot springs, geothermal wells, groundwater wells, lakes and rivers, in the Ziway-Shala basin. HS=Hot springs, WL=Groundwater wells, GW=Geothermal wells, LW= Lakes, RI= Rivers (ID: RI30=Meki, RI31=Ketar)……… 102
Table 8.2: δ18O, δD, 87Sr/86Sr isotopic signatures and trace elements (Sr, Rb, Li, and B)
hydrochemical composition (in mg/L) of the central MER waters from hot springs, geothermal wells, groundwater wells, lakes and rivers, in Ziway-Shala basin. HS=Hot springs, WL=Groundwater wells, GW=Geothermal wells, LW= Lakes (LW25=Langano, LW26=Awasa, LW27=Shala, LW28=Abijata, LW29=Ziway), RI=Rivers (ID: RI30=Meki, RI31=Ketar), d is deuterium-excess=(δD -8*δ18O), nm=not measured……… 103
LIST OF APPENDICES………PAGES Appendix 4.1: PHREEQC calcultions of saturation indices for various water types
(groundwater wells, hot springs, geothermal wells, rivers and lakes) of the central MER in Ziway-Shala basin………... 125
Appendix 4.2: PHREEQC calcultions of saturation indices for groundwater wells (1-14) and
geothermal wells (15-21) in the Ziway-Shala basin (source: Ayenew 20……. 129
Appendix 4.3: Na+, HCO3¯ (in mmoles/L) and Na+/ HCO3¯ ratios with the corresponding
F¯ concentration variations in waters from Ziway–Shala basin. Note the different behaviour of samples characterized by Na+/ HCO3¯ ratio above
and below unity. WL=Groundwater wells, HS=Hot springs, GWL=Geothermal wells, HGW=Highland groundwater wells (Source of samples in bold font: Ayenew 2008)……… 130
Appendix 5.1: International quality standards for drinking water, and number of leachates
from volcanic rocks exceeding the minimum threshold defined by the authorities. NG (no guidelines), NM (not mentioned), Bold font: (the minimum standard considered)……… 132
Appendix 5.2: International quality standards for drinking water, and number of leachates
from sediments exceeding the minimum threshold defined by the authorities. NG (no guidelines), NM (not mentioned), Bold font: (the minimum standard considered)……… 133
Appendix 6.1: Compositions of major ions and SiO2 in the groundwater wells in Ziway and Meki area (Data collected from Meki and Ziway Catholic Mission offices, January 2007)………... 134
ABBREVIATIONS
Abbreviation Meaning
AAS Atomic Absorption Spectroscopy
ADE Advection Dispersion Equation
CRM Certified Reference Material
δ2H or Delta 2H Isotope ratio of hydrogen δ18O or Delta 18O Isotope ratio of oxygen
EU European Union
EC Electrical Conductivity
FAO Food and Agriculture Organization
GMWL Global Meteoric Water Line
GIS Geographical Information System
GPS Global Positioning System
IC Ionic Chromatography
ICP-MS Inductively Coupled Plasma-Mass Spectrometry
ITCZ Intertropical Convergence Zone
LMWL Local Meteoric Water Line
MER Main Ethiopian Rift
MINTEQA2 a geochemical modeling software program
MODFLOW Modular Three-Dimensional Finite-Difference Groundwater Flow Model
MT3DMS Modular Transport Three Dimensional Model Simulator
PHREEQC PH (pH), RE (redox), EQ (equilibrium), C (program written in C)
SDZFB Silti Debre Zeyt Fault Zone
SEM Scanning Electron Microscope
SI Saturation Index
87Sr/86Sr Strontium isotope ratio
TAS Total Alkali-versus-Silica
TDS Total Dissolved Solids
USGS United States Geological Survey
VSMOW Vienna Standard Mean Ocean Water
WHO World Health Organization
WFB Wonji Fault Belt
WATEQ4F a geochemical modeling software program
XRD X-ray Diffraction
ABSTRACT
In the Main Ethiopian Rift (MER), the supply of drinking water principally relies on groundwater wells, springs (including some hot springs), and rivers, and is characterized by a significant problem of fluoride (F¯) contamination. New analyses reveal that the F− geochemical anomaly is sometimes associated with hazardous content of other potentially toxic elements such as As, B, Mo, U, Al, Fe, and Mn. The F¯ content exceeds the permissible limit for drinking prescribed by the World Health Organization (WHO; 1.5 mg/L) in many important wells (up to 20 mg/L), with even more extreme F concentration in hot springs and alkaline lakes (up to 97 mg/L and 384 mg/L respectively) and is causing prevalent endemic fluorosis disease in the region.
87 % of the groundwater wells, 38 % of rivers and 100 % of hot springs and lakes show F¯ content above 1.5 mg/L. The groundwater and surface water from the highlands, typically characterized by low Total Dissolved Solids (TDS) and Ca2+ (Mg2+)-HCO3¯ hydrochemical facies, do not show high F¯
content. The subsequent interaction of these waters with the various rocks of the rift valley induces a general increase of the TDS and a variation of the chemical signature towards Na+-HCO3¯
compositions, with a parallel enrichment of F¯. The interacting matrixes are mainly rhyolites consisting of volcanic glass and only rare F-bearing accessory minerals (such as alkali amphibole).
Comparing the abundance and the composition of the glassy groundmass with other mineral phases, it appears that the former stores most of the total F¯ budget. This glassy material is extremely reactive, and its weathering products (i.e. fluvio/volcano-lacustrine sediments) further concentrate the fluoride. The interaction of these “weathered/reworked” volcanic products with water and carbon dioxide at high pH causes the release of fluoride into the interacting water. This mainly occurs by a process of base-exchange softening with the neo-formed clay minerals (i.e. Ca-Mg uptake by the aquifer matrix, with release of Na+ into the groundwater). This is plausibly the main enrichment mechanism that explains the high F¯ content of the local groundwater, as evidenced by positive correlation between F¯, pH, and Na+, and inverse correlation between F¯ and Ca2+ (Mg2+). Saturation indices (SI) were calculated (using PHREEQC-2) for the different water groups, highlighting that the studied waters are undersaturated in fluorite. In these conditions, fluoride can not precipitate as CaF2, and so F¯ mobilizes freely without
On the other hand, 35 % of the 23 investigated groundwater wells and 70 % of the 12 hot springs (and deep geothermal wells) show Arsenic concentration above the recommended limit of 10µg/L (WHO 2006). The average concentration of Arsenic is 0.9µg/L in rivers, 39µg/L in hot springs, 236µg/L in deep geothermal wells, 21.4µg/L in groundwater wells, 77µg/L in lakes, whereas maximum concentrations reach up to 3µg/L, 156µg/L, 278µg/L, 157µg/L and 405 µg/L respectively. Arsenic in groundwater wells shows positive correlations with Na+ (R2=0.63) and HCO3− (R2=0.70) as well as with
other trace elements such as Mo (R2=0.79), U (R2=0.70), V (R2=0.68) whereas no correlations are observed with Fe and Mn. PHREEQC speciation modelling indicates that Fe and Al oxides and hydroxides are stable in the water systems, suggesting that Fe and Al mineral phases are potential adsorbents and thus influence the mobility of As. The oxidizing, high pH condition combined with Na+ -HCO3¯ hydrochemical facies (competing effect of HCO3− for adsorption sites) of the MER waters play
an important role in the mobilization of arsenic.
Chemical analyses of leachates from MER rhyolitic rocks and their weathered and reworked fluvio-lacustrine sediments were performed in order to evaluate their contribution as a source of the mentioned geochemical anomalies. The leachates were obtained from a one-year leaching experiment on powdered rocks and sediments mixed with distilled water (10g:50ml). The sediment leachates contain as much as 7.6 mg/L of F¯, 220 µg/L of As, 181 µg/L of Mo, 64 µg/L of U and 254 µg/L of V suggesting that the local sediments represent the main source and reservoir of toxic elements. Laboratory column experiment was also conducted in volcanic ash sample using synthetic rain water flushing, and the result showed that significant amount of F¯ were leached out over the duration of the experiments.
This showed that these elements were originally present in the glassy portion of the MER rhyolitic rocks, were progressively concentrated in weathered and redeposited products. It further confirms that the pyroclastic materials are the major source and reservoir of many of the chemical elements (e.g. F¯, As). Therefore, together with the renowned F¯ problem, the possible presence of geochemical
range of (-3.36‰ – 3.69‰) and δD (-0.95‰ – 24.23‰) (VSMOW), 12 groundwater wells δ18O
(-3.99‰ – 5.14‰) and δD (-19.69‰ – 32.27‰) in contrast to the 5 Lakes δ18O (3.98‰ – 7.92‰) and δD
(26.19‰ – 45.71‰). The 2 deep geothermal wells and 1 of the 2 river samples are depleted in stable isotopic values. 87Sr/86Sr values range from 0.7045 to 0.7076 in the hot springs, and the two deep geothermal wells have 0.7043 and 0.7054 values. These signatures are typical of water interacted with mantle derived materials (with a minor crustal contamination), similar to the rocks widely covering the study area. The Sr isotope values of the basalt and ignimbrite samples are 0.7063 and 0.7071 respectively. Generally, the result shows that there exists a complex surface water and groundwater interactions that is reflected on a diversity of the stable and Sr isotopic signature in waters.
The preliminary results of the study has showed that there is a need for future extended works on the geochemistry of solid samples (rocks, sediments and soils) as well as in waters that investigate all the spectrum of chemical elements that are potentially detrimental to human health and environment. Furthermore, from water resource point of view, the following works must focus on a comprehensive study of various isotopes and geochemical data to constrain groundwater age dating, water-rock interaction and flow path and thus help to model and systematize the hydrologic cycles in the basin.
Key words: aqueous geochemistry, major and trace elements, toxic elements, leaching experiment,
RIASSUNTO
Nella “Main Ethiopian Rift” (MER) l’approvigionamento idropotabile avviene sfruttando principalmente acqua di falda e subordinatamente attraverso acque delle sorgenti (alcune di queste termali) e acque dei fiumi. Tali acque sono spesso caratterizzate da una significativa contaminazione da fluoro (F¯). Le analisi presentate in questa tesi rivelano che tale anomalia geochimica è talvolta associata con alte concentrazioni di altri elementi potenzialmente tossici come As, B, Mo, U, Al, Fe e Mn.
Il contenuto di F¯ in queste acque spesso eccede la concentrazione massima ammissibile (1.5 mg/L) prescritta dall’organizzazione mondiale delle sanità (WHO) in molti importanti pozzi della zona dove talvolta si osservano sino a 20 mg/L, e concentrazioni ancora più estreme si rinvengono nelle acque delle sorgenti termali (sino a 97 mg/L) e nelle acque dei laghi (sino a 384 mg/L), causando fluorosi come malattia endemica nelle popolazioni locali.
87% delle acque dei pozzi, 38% delle acque dei fiumi e 100% delle acque termali e dei laghi sono contraddistinte da tale problema avendo concentrazione in F¯ superiore ad 1.5 mg/L.
Le acque superficiali e sotterranee degli adiacenti altopiani, tipicamente caratterizzate basse concentrazioni di sali disciolti (TDS) e da una facies idrochimica carbonato-calcica non mostrano invece tali arricchimenti in F¯. La successiva interazione di tali acque che provengono dagli altopiani con le varie litologie che si rinvengono nella rift valley induce un generale incremento della TDS, una variazione della facies idrochimica verso composizioni carbonato-sodiche, e un arricchimento parallelo in F¯. Le principali litologie che si rinvengono in tali acquiferi della rift valley sono rocce vulcaniche di natura riolitica principalmente costituite da vetro e solo subordinatamente da fasi accessorie contenenti fluoro (es.: anfibolo). Ne deriva che il vetro vulcanico sembra essere la fase che contiene quasi la totalità del fluoro. Tale fase vetrosa è molto reattiva durante i processi di weathering, e i relativi prodotti di
(SI) calcolati con PHREEQC-2 mostra inoltre sottosaturazione rispetto alla fluorite che non precipitando consente la permanenza del F- libero in soluzione.
La presenza di As sembra essere un ulteriore problema che induce seria preoccupazione in quanto 35% dei pozzi e 70% delle sorgenti termali sono caratterizzati da acque con contenuti che eccedono la concentrazione massima ammissibile delineata dalla WHO (10 μg/L). In particolare, la concentrazione di As è 0.9 μg/L nelle acque dei fiumi, 39μg/L nelle acque delle sorgenti termali, 236 μg/L nelle acque di alcuni pozzi geotermici, 21.4 μg/L nelle acque dei pozzi ad uso idropotabile, 77μg/L nelle acque dei laghi, con concentrazioni massime che raggiungono 3 μg/L, 156 μg/L, 278 μg/L, 157 μg/L e 405 μg/L, rispettivamente. As esibisce correlazioni positive con Na+ (R2=0,63) e con HCO3¯ (R2=0,70) e con altri
elementi in traccia come Mo (R2=0.79), U (R2=0.70), V (R2=0.68). ma non con elementi quali Fe e Mn. Le condizioni ossidanti, la presenza di alti pH e la generale facies idrochimica carbonato-sodica giocano evidentemente un significativo ruolo alla mobilizzazione dell’arsenico.
Sono stati effettuati tests di lisciviazione sui principali litotipi che caratterizzano gli acquiferi oggetto di studio al fine di evidenziare il loro ruolo e il possibile contributo alla genesi dell’anomalia in fluoro riscontrata nelle acque. Tali tests sono stati ottenuti mettendo 10 g di polvere di ogni campione a contatto con acqua distillata (50 ml) per un periodo di 1 anno. Fra i vari campioni investigati, le soluzioni ottenute lisciviando i depositi fluvio-lacustri contengono sino a 7.6 mg/L di F¯, 220 μg/L di As, 181 μg/L di Mo, 64 μg/L di U e 254 μg/L di V, suggerendo che tali litotipi rappresentano la principale sorgente di elementi potenzialmente tossici. Esperimenti simili sono stati inoltre effettuati per tempi più brevi su “colonne” opportunamente riempite con litotipi rappresentativi, campionando nel tempo l’acqua che vi fuoriusciva.
Riassumendo, si suggerisce che tali elementi tossici originariamente presenti nella fase vetrosa che costituisce le rocce riolitiche estremamente diffuse nella MER siano progressivamente concentrati nelle coltri di alterazione o nei sedimenti da queste prodottisi. Si suggerisce inoltre che oltre al conosciuto problema della contaminazione da F¯ anche altre anomalie geochimiche relative ad elementi come As, B, Mo, U, Al, Fe e Mn dovrebbero essere prese in serie considerazione in quanto possono indurre un ulteriore impatto sanitario alla popolazione della MER e di altri settori del rift east-africano.
In tale tesi vengono vengono inoltre riportati dati degli isotopi stabili dell’ossigeno e dell’idrogeno (δ18O, δD) effettuati sulle acque oggetto di studio e dati degli isotopi radiogenici dello stronzio
(87Sr/86Sr) effettuati sia sulle acque che sui litotipi più rappresentativi. Le acque delle sorgenti termali
5.14 e δD fra -19.69 e -32.27; in contrasto le acque dei laghi mostrano δ18O fra 3.98 e -7.92 e δD fra
26.19 e -45.71.
87Sr/86Sr varia fra 0.7045 e 0.7076 nelle acque delle sorgenti termali, e fra 0.7043 e 0.7054 nelle acque
di pozzi profondi di natura geotermica. Tale segnatura isotopica è comparabile con quella che si è rinvenuta nelle rocce affioranti nell’area, in quanto l’analisi di roccia basaltica e di una roccia ignimbritica ha fornito valori di 0.7063 e 0.7071 rispettivamente. Tali analisi isotopiche contribuiranno ad una miglior interpretazione della situazione idrogeologica caratterizzata da un complessa interazione fra acque superficiali ed acque sotterranee.
Più in generale si sottolinea l’esigenza di ulteriori studi che coinvolgano oltre alle acque anche la geochimica delle matrici solide che tengano in considerazione un ampio spettro di elementi potenzialmente tossici, nonché di ulteriori studi isotopici che potrebbero fornire informazioni sulle direzioni dei flussi sotterranei, sulle litologie con le quali le acque interagiscono e sui tempi di circolazione di dette acque nei relativi acquiferi.
Parole chiavi: Geochemica delle acque, elementi maggiori e in traccia, test di estrazione, isotopi
1. General introduction
In the MER system, groundwater resources from wells and springs as well as from rivers are a very important supply of drinking water for millions of people living in the area. The MER is part of the East African Rift, located within the central part of the Ethiopia Rift system and characterized by semi-arid to arid climate conditions where water scarcity is often associated with water quality problems. The natural waters of this region are characterized by geochemical anomalies of high fluoride concentration (Kilham and Hecky, 1973; Chernet, 1982; Calderoni et al., 1993; Gizaw, 1996; Darling et al., 1996) often exceeding the 1.5 mg/L tolerance limit for drinking water (WHO, 2006). Above this threshold, the high fluoride concentration causes dental fluorosis (above 1.5mg/L), skeletal fluorosis (above 4 mg/L) and crippling fluorosis (above 10 mg/L; Dissanayaka, 1991). The local population is affected by diseases such as mottled teeth and skeletal fluorosis (Tekle-Haimanot et al., 1987, Kloos and Tekle-Haimanot, 1999) which are linked to the high fluoride concentration observed in the rift’s waters (Figure 1)
Figure 1.1: Dental fluorosis in the main Ethiopian rift (photo: January 2007)
In the past few decades, many geochemical studies have addressed the fluoride problem in order to elucidate its origin (Chernet and Travi, 1993; Gizaw, 1996; Yirgu et al., 1999; Chernet et al., 2001; Ayenew, 2005; Rango et al., 2008) and to investigate the associated health problems (Lester, 1974; Olsson, 1979; Tekle-Haimanot et al., 1987; Tekle-Haimanot, 1990; Shiferaw and Teklehaimanot, 1999; Kloos and Tekle-Haimanot, 1999). Although the health related impact of fluorine is well known, the
hydrogeochemistry of fluorine, with respect to the controlling phases (minerals and/or amorphous), and the processes that induce its enrichment are not extensively studied in the Ethiopian rift system. Similarly, geochemical studies on trace elements are also not yet well investigated in the region.
A proper water quality assessment requires the investigation of a more complete spectrum of potentially toxic elements in order to foresee possible negative health effects in the short or long term. Such kind of studies are extremely important especially in active volcanic areas which are characterized by extremely reactive lithotypes (that can release their chemical budget into the interacting water) and by persisting geothermal manifestations (possibly including juvenile fluids) that can pollute the shallow aquifers. This is the case of the Main Ethiopian rift (MER), where the presence of felsic-volcanic rocks (ashes, tuffs, rhyolitic ignimbrites) and their weathered and re-deposited fluvio-volcano lacustrine sediments, as well as the presence of active geothermal activities, could contribute to the existence of multiple geochemical anomalies with detrimental effects on human health.
This study mainly deals with the natural occurrence of these trace elements, particularly fluoride and arsenic. Occurrence (Kilham and Hecky, 1973;Calderoni et al., 1993; Ashely and Burley, 1994; Gizaw, 1996; Darling et al., 1996) and health problems related to the first element are well known in East Africa (Smith et al., 1953; Grech, 1966; Ocherse, 1953; Moller et al., 1970), whereas geochemistry and related health risks of the latter (together with other associated trace elements) have not yet been documented or are poorly understood. This study highlights the presence of these toxic elements in the MER waters, and discusses their origin, distribution and speciation.
The determination of potentially harmful inorganic substance concentrations in natural water and in the aquifer lithologies is essential. Leaching procedures on the latter are also important as they provide an estimate of the bioavailable elemental budget. The results will provide information on the potential inorganic trace element contaminants harmful to humans and the environment. In addition, fundamental
Therefore, the objectives of this study can be summarized into three parts:
The principal objective of the study is to gain a better knowledge and understanding of fluoride problem with respect to its sources, genesis and distribution in order to support water quality management issues in the central sector of Main Ethiopian Rift (MER) floor.
In this framework we performed an integrated study of both waters and coexisting representative solid aquifer matrixes in the Ziway-Shala lakes basin of the central MER, in order to unravel the water-rock/sediment interactions that ultimately lead to the peculiar geochemical features of the Ethiopian rift waters. Therefore, the hydrochemical investigation was coupled with the mineralogical/geochemical characterization of the lithologies outcropping in the area. Moreover, laboratory leaching tests (batch and column) were also carried out to evaluate the potential release of fluoride from the various rock/sediment types. These approaches serve to understand the lithologic sources and the enrichment mechanisms controlling the anomalous fluoride content in the waters.
The second objective is to perform water quality assessment in order to identify other potentially toxic trace elements and to make a future plan for detail geochemical investigations in solid phases and natural waters of the region, and
The third objective is to investigate the origin of waters, water/rock interactions and mixings processes (among surface waters and groundwaters) in the basin using stable isotopes δD, δ18O
2. Description of the central Main Ethiopian Rift (MER) 2.1. Morphology and Hydrology
The Ethiopian rift system represents the northern half of the East African Rift that consists of three zones with distinct volcanic assemblages and tectonic features. These are the Afar Rift system to the north, the Main Ethiopian Rift (MER) valley at the central and the south western part. The central sector is more than 200 km long and about 75 km wide. The afar rift forms a triangular depression formed by triple tectonic interactions of the Red Sea and Gulf of Aden oceanic rifts with the continental MER. Rift extension in the MER is generally NW-SE (Mohr and Wood, 1976; Korme et al., 1997) and it is strongly affected by NNE-SSW oriented active normal faults of the Wonji Fault Belt (WFB) on the east and the Silti–Debre Zeyt Fault Zone (SDZFZ) on the west, with a large displacement of about 1500– 2000 m between the rift floor and the plateau (Mohr 1962, Di Paola, 1972; Woldegabriel et al., 1990) (Figure 2.1).
From geomorphological point of view Ziway-Shala basin divided into three zones: the rift, the transitional escarpment and the highlands. The rift zone is characterized by an average altitude of 1600 m above sea level (m.a.s.l), is bordered by the Ethiopian plateau to the east and west, having an average altitude of 2500 m.a.s.l) (cross-section AB, Figure 2.1).
In the basin the lowest elevation is at Lake Shala (1550 m.a.s.l). The large Pliocene trachytic shield volcanoes of Mount Chilalo (4006 m), Mount Badda (4170 m), Mount Kubsa (3760 m) overlook the Ziway–Shala basin from the east. Several dormant silicic caldera volcanoes rise above the rift floor: Mount Bora (2293 m), the Alutu Caldera (2328 m), the O’a Caldera (1960 m), and the Corbetti Caldera (2320 m) (Figure 2.1). Quaternary calderas of Aluto, Gademotta and Shala are present in the basin. South west of Ziway–Shala basin, Awasa caldera forms a closed basin.
Figure 2.1: Tectonic map of the central MER in Ziway-Shala basin.
The Ziway–Shala basin (7–8º30`N lat.; 38º–39º30`E long.) of the central MER comprises a rift-bounded chain of lakes (Ziway-Langano-Abijata-Shala), chemically characterized by fresh (e.g Lake Ziway) to alkaline lakes (e.g Lake Shala and Abijata). These lakes are hydrologically closed. The three northernmost lakes, Ziway, Langano, and Abijata are connected by a surface network. Ziway Lake drains into Abijata via the Bulbula River and Langano overflows seasonally into Abijata via the Horakelo River, whereas the Lake Shala, the deepest lake (266m) in Ethiopia lies on a caldera and forms a separate basin. The shallowest and most northerly, Lake Ziway receives surface inflows from the west
by Meki and from southeast by Ketar Rivers that draining the western and eastern highlands of the basin. Lake Langano is fed by small streams from southeast. Lake Shala receives water from Gidu River from the west and Adabat River from the southeast. It partly fed by groundwater seepage from the other lakes (Street, 1979; Chernet, 1982). Lake Chitu is a small crater lake southeast of Lake Shala. Lake Awasa found south of Ziway-Shala basin, where its main tributary is Tikur Wuha River which drains swampy Lake Shallo. Ziway-Shala basin is bordered by Lake Awasa basin to the south, the Bilate River basin to the west, the Awash River basin to the north and the Wabishebelle River basin to the east.
Photos below are taken from Lake Langano and Lake Chitu (Figure 2.2 and Figure 2.3).
Figure 2.3: Partial view of Chitu Crater Lake with flamingos (photo: January 2007)
Each of the three lakes (Ziway-Langano-Abijata) has an elongate shape parallel to the main trend of the MER and can be defined as tectonically controlled lakes. Due to differences in the geomorphological setting they vary in depth, shape and size (Table 1.1).
Lakes Altitude (m.a.s.l) Surface area (km2) Catchement area (km2) Maximum depth (m) Mean depth (m) Volume (106m3) Salinity (g/L) Ziway 1636 440 7380 8.9 2.5 1466 0.349 Langano 1585 230 2000 47.9 17 3800 1.88 Abijata 1580 180 10740 14.2 7.6 957 16.2 Shala 1550 370 2300 266 8.6 37000 21.5
Table 2.1: Basic hydrological data of the lakes (Wood and Talling, 1988; Chernet, 1982 and Ayenew,
2.2. Geothermal activities
The Ethiopian rift system is an area known for its significant geothermal resources. These resources are found scattered throughout the Main Ethiopian Rift valley and in the Afar Depression.
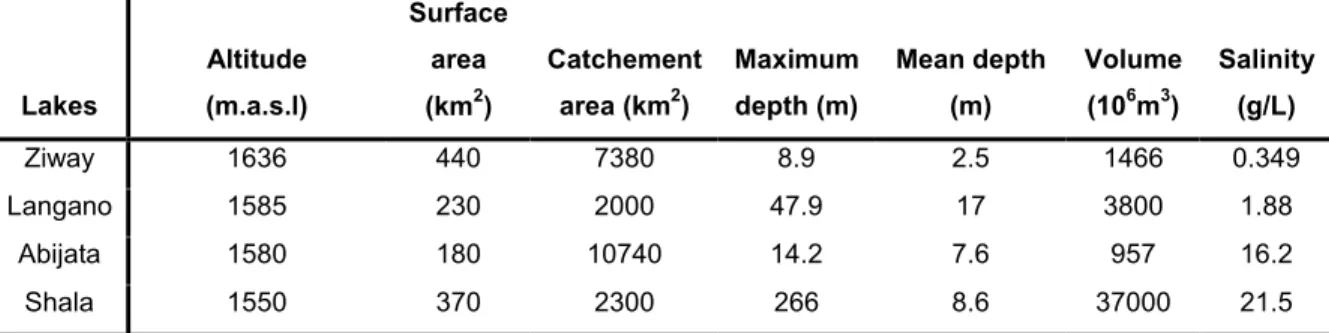
It is characterized by circulation of geothermal fluids which are manifested as geothermal wells, hot springs, fumerols and geysers. This could be due to the persistence of magma at shallow depth, generating heat that induces geothermal and fumarolic activities (e.g. at Aluto-Langano volcanic center;
Figure 2.4) and high temperature thermal fluids outpouring as springs bordering the lakes (Langano,
Shala and Chitu). Hydrothermal fields exist on the Tulu Gudu Island of Lake Ziway, along the northern and eastern shores of Lake Langano (North Bay and Edo Laki Island, Bole, and O-itu Bay) and on the east, southeast and southwest shores of Lake Shala (UNDP, 1973; Chernet, 1982) and hot springs bordering Lake Chitu (Figure 2.5)
Figure 2.5: Hot spring close to Lake Chitu with the local community taking water for domestic use
(photo: January 2007)
2.3. Climate and vegetation
The modern climate of the Ziway–Shala region is mainly characterized by alternating wet and dry seasons following the annual movements of the Intertropical Convergence Zone (ITCZ) which separates the air streams of the northeast and southeast monsoons (Nicholson, 1996). Different climatic conditions characterize the highlands, the escarpment and the rift valley. Annual rainfall ranges from around 650 mm in the rift valley to 1100 mm in the highlands (Ayenew, 1998). Mean annual temperature is less than 15ºC in the highlands and more than 20ºC in the lowlands and evaporation ranges from more than 2500 mm on the rift floor to less than 1000 mm in the highlands (Le Turdu et al., 1999). Highland areas west of Butajira and east of Asela and Shashemene are humid to dry sub-humid. Because evaporation
exceeds rainfall, the rift valley suffers water deficit, as a result surface water and groundwater resources can be constrained.
The vegetation types ranges from tropical woodland to bushed grassland on the rift floor. Rift shoulders are characterized by bushed grassland, then remnants of dry, montane forest and, from 3200 to 3500 m, ericaceous scrub and Afroalpine moorland (Makin et al., 1975).
2.4. Soils
Generally, the soils of the Ethiopian Rift Valley divided into thirteen major soil mapping units and a further six sub-units based on the FAO/UNESCO soil classification. The major soil units in terms of area covered are: Vertisols (19.2%), Cambisols (17.9%), Fluvisols (16.2%), Regosols (15.8%), Lithosols (9.5%), Andosols (7.1%) and Acrisols (6.1%) (King and Birchall., 1975; FAO/UNESCO, 1977).
The soils of the Rift Valley are largely derived from recent volcanic rocks and, by comparison with many areas of east Africa; their base status is generally good. The main parent materials of the Rift Valley soils are: basalt, ignimbrites, lava, gneiss, volcanic ash, alluvium and pumice. Some of the soil problems include, low phosphorus levels, micronutrient imbalances and in some cases poor physical structure (Makin et al., 1975). Fertile volcanic soils prevail in wide areas of the highlands, where mean annual rainfall exceeds 800 mm (Ethiopian Mapping Authority, 1988).
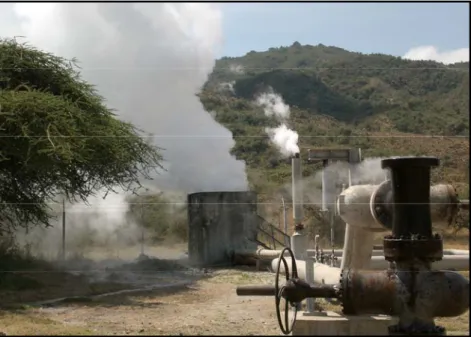
2.5. Settlements and water supply
The rift and the bordering highlands in the study area is one of the most populated regions of the country. The main towns in the basin are Ziway, Meki, Awassa, Shashemene, Arsi-Negele, Butajira, Silte, Bekoji, Asela and Kofele. People live also in scattered villages across the basin. The water supply
Figure 2.6: Community water supply well from the study area (photo: January 2007) 2.6. Significance of the Ethiopian rift system
The Ethiopian rift system has a great geological significance to study the processes and evolution of volcanism and rifting. It is also abundant in natural resources such as fertile volcanic soils, industrial minerals, geothermal energy, surface and groundwater and scenic landscape formed by volcanic and tectonic processes. The presence of lakes (such as Ziway and Langano) and hot springs throughout the rift are known as touristic destinations for foreigners and local populations. Moreover, the rift sedimentary basins are rich in paleoanthropological, paleontological, and archeological heritages for understanding human origin and evolution and use of tools (Woldegabriel et al., 2000). The MER especially the central section is a well-known reference area for palaeoclimatical studies (Street, 1979; Chalié and Gasse, 2002). Despite the great benefit provided by volcanic products and tectonic features, natural hazards and risks associated to volcanoes and tectonics pose potentially destructive threats to the society and environment. As a matter of this fact, the surface and groundwater resources of the rift are contaminated by some toxic elements (such as widely recognized Fluorine).
2.7. Geological settings
The present day geologic and geomorphic features of the region are built by Cenozoic volcano-tectonic and sedimentation processes. Geographic distribution and compositional diversity among the rock units of the Ethiopian volcanic province indicate that there has been a relationship between magma composition and rifting (woldegabriel and Aronson, 1986; Hart et al., 1989). The initial phase of development of the MER is attributed to the influence of a mantle plume beneath the Ethiopian Plateau resulting in widespread flood-basalt volcanism and plateau uplift with two main episodes dated at 45–30 Ma and 18–14 Ma (Davidson and Rex, 1980; Mohr, 1983; Hart et al., 1989; WoldeGabriel et al., 1991; Ebinger et al., 1993; Hofmann et al., 1997). In the southern and central sectors of the MER, volcanism started as early as in Eocene time with important basaltic eruptions, associated with an early stage of rifting characterized by uplift and faulting (WoldeGabriel et al., 1990, 1991; Ebinger et al., 1993). From Late Oligocene to Early Miocene times, the first major phase of rifting within the MER resulted in a series of asymmetric half-grabens with alternating polarity. By mid-Late Miocene time, the eastern and western faulted margins of the MER had formed (Davidson and Rex, 1980; WoldeGabriel et al., 1990) The most important volcano–tectonic event in the central sector of the MER occurred in Early Pliocene, with the eruption of voluminous flows of rhyolitic ignimbrites and the collapse of very large calderas (Di Paola, 1972; Woldegabriel et al., 1990). From early Pleistocene to the present, tectonic and volcanic activity was concentrated along the Wonji Fault Belt (WFB) to the east, and along the Silti Debre Zeit Fault Zone (SDZFZ) to the west (Mohr, 1962; Di Paola, 1972).
The MER divides the volcanic province of Ethiopia into northwestern and southeastern plateau during the Miocene. Despite the occurance of widespread faulting, subsidence and uplifting related to the formation of the MER, the pre-rift geology is barely exposed along the rift system (Woldegabriel et al., 2002). The boundary faults expose crystalline basement rocks beneath tertiary volcanic rocks in the
were fissural basaltic lava flows, stacked one over the other, alternating with volcanoclastic deposits derived from tuff, ignimbrite and volcanic ash.
In the rift recent continental type volcanism has developed, giving rise to lage silicic rocks from predominantly central type eruptions partly accompanied by fissural basaltic lava flows. The oldest flows are rarely exposed beneath thick younger flows, and the individual flows are only local (Barberi et al., 1975; Zanetti et al., 1978; Berhe et al., 1987). The basalts are now concealed by a cover of silicic stratoid volcanics (Di Paola, 1972). Subsequent volcanic activitity has been largely confined to the active Wenji Fault Belt running parallel to the rift axes (Mohr, 1967).
The highlands are dominantly covered with basic volcanic rocks mainly of tertiary age. The oldest volcanic rocks (Plateau Trap Series or Volcanites of Plateau; Figure 2.7, Unit 1) are exposed in the western and eastern elevated areas. The western escarpment consists of about 1000 m of basaltic lava flows, with inter-bedded ignimbritic horizons, overlain by massive rhyolites, tuffs and basalts (Di Paola, 1972; Merla et al., 1979; Woldegabriel et al., 1990). Radiometric ages range from 40 to 25 Ma in the basalts and from 37 to 27 Ma in the rhyolites (Merla et al., 1979; Woldegabriel et al., 1990). Middle Miocene to Pliocene (15–3 Ma) basalt flows, rhyolites and tuffs unconformably cap the early Tertiary volcanic units (Merla et al., 1979; Woldegabriel et al., 1990). The eastern plateau is characterized by shield volcanoes of Pliocene to early Pleistocene (4.6–1.6 Ma) consisting of mainly trachytes with subordinate basalts, mugearites and phonolites (Di Paola, 1972) (Arusi Shield Volcanoes; Figure 2.7, Unit 2).
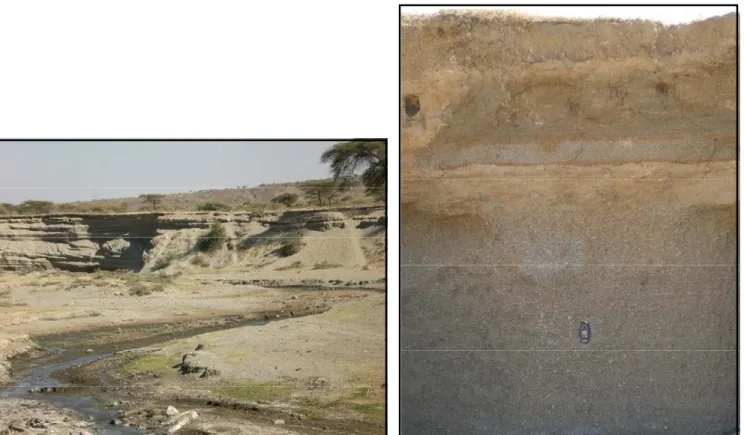
In the central sector of the MER, the outcropping lithologies consist of plio-pleistocene volcanites (pyroclastic products of felsic composition and subordinate basaltic lava flows) and sediments (Benvenuti et al., 2002); and the sediments in large consists of lacustrine deposits (Figure 2.7, Unit 3) and volcano-clastic and fluvial sediments (Figure 2.7, Unit 4). They are characterized by upper quaternary fluvio-volcano lacustrine facies, and colluvial deposits that represent weathered/remobilized volcanic rocks and silicic tephra. Figure 2.8 shows fluvio-lacustrine sediments outcrop, east of Lake Shala. The sediments occupy the rift floor where in the past it was covered by a wide lake. The four present day lakes had once been a single fresh water lake (Nilsson, 1940).
In particular, most of the MER rift floor is covered by silicic pyroclastic materials (rift floor ignimbrites;
Figure 2.7, Unit 5), Early to Middle Pliocene (4.2–3 Ma, Woldegabriel et al., 1990) mainly consisting
unwelded pumices (Di Paola, 1972; Woldegabriel et al., 1990). Ashes are frequently found inter-bedded with ignimbrites and pumice layers.
Some outcrops of alkaline and peralkaline rhyolitic lava flows and domes associated with pumice and ash (with in unit 3) represent the late silicic volcanic events (Di Paola, 1972). These lavas were erupted from Late Pliocene to Middle Pleistocene and, in some places; crop out as remnants of large calderas. The Gademota Ridge, dated 1.30–1.27Ma (Laury and Albritton, 1975; Mohr et al., 1980; Woldegabriel et al., 1990) is one such remnant. It rises in an arc structure, 25–30 km in diameter, up to 400 m above the plain west of Lake Ziway.
A more recent volcanic unit, (basaltic lava flows; Figure 2.7, Unit 6), crops out along the SDZFZ and the WFB (Di Paola, 1972; Kazmin et al., 1980); it is made up of basaltic lava flows, associated with hyaloclastites and scoria cones. It is very recent with a radiometric age of 0.13 Ma (Woldegabriel et al., 1990).
Young volcanoes and calderas, such as the Alutu volcano, and Corbetti calderas, are made up of rhyolitic lava flows, unwelded pumice flows, pumice falls and ashes (rhyolite lava flow; Figure 2.7, Unit 7). Obsidian flows represent the final product of the volcanic activity (Di Paola, 1972; Mohr et al., 1980). Figure 2.9 shows pumice falls at NE of Lake Ziway.
These recent volcanoes started to be active from the Middle Pleistocene (about 0.25 Ma, Di Paola, 1972; Mohr et al., 1980; Woldegabriel et al., 1990) with intermittent Late Holocene activity; obsidian flows and pumices were dated 2000 yBP (Gianelli and Teklemariam, 1993) and very recent ash deposits 1500 and 230 y BP (Haynes and Haas, 1974). Many of these volcanoes are presently in a fumarolic stage (Di Paola, 1972).
Figure 2.7: Simplified geologic map of the study area (Ziway-shala lakes basin) modified
Figure 2.8: Fluvio-lacustrine sediment, east of Figure 2.9: Pumice deposit, northeast of Lake Ziway
3. Geochemistry of rocks and sediments from the central MER 3.1. Rock/sediment sampling and analytical techniques
Representative rock and sediment samples were collected during the field campaign. Rock samples were preliminary characterized by studying thin-sections at the transmitted light microscope. Whole-rock analysis of selected samples were performed by X-ray fluorescence spectrometry (XRF) on pressed powder pellets using wavelength-dispersive automated ARL Advant'X spectrometer at the Department of Earth Sciences of the University of Ferrara. Accuracy and precision, based on the analysis of certified international standards, are estimated as better than 3% for Si, Ti, Fe, Ca and K, and 7% for Mg, Al, Mn, Na, and 10% for trace elements at ppm level. Representative samples that reflect the main lithotypes were subsequently selected for leaching experiments.
In these experiments, powdered samples were mixed with distilled water having a pH of about 5.5, at a ratio of 1 to 5 (10g/50ml; room temperature), and shaken for 12 months at a frequency of 100 rev/min. The experiment was carried out in closed system, i.e. utilizing closed plastic bottles which did not allow interaction with atmospheric gases (such as CO2). The test simulates the potential extractability
(leachability) of soluble components during water-rock/sediment interaction processes. Analysis of major and trace elements on leachates were done, with the above mentioned analytical techniques, after separation from the residue and filtering through (0.45µm membrane filters).
In situ analyses of the constituent phases (minerals and volcanic glasses) were carried out with a Cameca SX 50 microprobe (CNR-IGG Institute of Padova) using natural silicates and oxides as standards.
3.2. Chemical and mineralogical composition of rocks
Bulk rock XRF analyses of the aquifer solid matrixes are reported in Table 3.1. The results is reported in an alkali-silica classification diagram (Figure 3.1), indicate that the prevalent volcanic rocks are rhyolites (i.e. felsic magmas) and that some of the fluvio-volcano lacustrine sediments represent the weathered - redeposited products of the above mentioned volcanic rocks (Table 3.1). These rocks are also further characterized by their high oxides of SiO2 and incompatible elements like Zr, Ce, La, Nb, Y,
TW9 TW11 Ted3 Ted4 Ted5 Ted25 Ted47 Ted48 Ted51 Ted52 Ted53 Ted6 Ted21
Rhyolites Basalt Sediments
SiO2 74.21 67.04 73.03 71.34 72.12 75.81 73.46 69.81 71.86 74.68 50.63 71.78 64.63 TiO2 0.33 0.45 0.34 0.36 0.40 0.27 0.68 0.60 0.36 0.38 2.49 0.37 0.64 Al2O3 9.96 16.02 10.38 9.33 9.73 9.32 9.40 11.10 9.35 9.87 16.67 8.75 8.23 Fe2O3 5.02 4.68 5.61 5.93 5.74 4.62 5.06 6.31 5.48 5.26 12.13 6.66 5.09 MnO 0.23 0.18 0.20 0.20 0.21 0.21 0.11 0.20 0.21 0.20 0.17 0.23 0.19 MgO 0.01 0.13 0.01 0.14 0.18 0.00 1.33 0.51 0.23 0.05 3.44 0.12 3.88 CaO 0.26 0.60 0.24 0.24 0.36 0.19 0.99 0.72 0.86 0.27 9.05 0.29 4.53 Na2O 5.78 4.47 5.63 2.89 4.58 5.26 0.97 3.67 4.36 4.88 3.70 2.87 1.88 K2O 4.04 4.37 4.38 4.67 4.33 4.09 2.31 4.12 4.00 4.17 1.33 4.28 2.58 P2O5 0.00 0.03 nd nd 0.02 nd 0.02 0.14 nd nd 0.41 nd 0.07 LOI 0.15 2.04 0.18 0.34 2.34 0.23 5.67 2.83 3.29 0.24 0.00 4.64 8.26 Ba 202 799 49 50 139 100 167 627 79 72 438 39 211 Ce 278 108 267 256 192 696 120 187 243 263 nd 283 124 Co nd nd nd nd nd nd 3.4 0.6 nd nd 33 nd 2.1 Cr nd 1.0 nd nd nd nd 28 nd nd nd 36 nd 14 La 133 166 168 159 150 238 130 197 143 136 88 166 110 Nb 166 123 143 130 115 225 82 113 118 135 29 132 90 Ni nd nd 3.7 6.2 3.9 5.9 21 7.9 2.0 nd 12 4.1 14 Pb 5 0.3 18 17 18 24 17 12 17 20 5.3 19 12 Rb 91 68 125 141 119 122 86 85 115 127 25 119 84 Sr nd 112 0.7 3.9 16 1.9 103 38 14 3.4 473 5.4 250 Th 19 15 19 24 19 21 18 16 18 19 4.1 20 14 V 2.1 17 4.9 6.7 7.0 5.2 30 19 7.8 3.9 319 7.1 45 Y 98 83 101 88 87 174 60 117 84 73 34 94 58 Zn 251 166 225 212 219 395 166 244 219 242 99 234 162 Zr 1076 812 1031 1000 910 1728 749 1016 942 1047 210 1023 709 Cu nd 0.8 3.5 3.6 3.6 2.0 16 4.6 3.7 4.0 68 2.6 8.1 Ga 21 22 26 31 28 28 28 36 32 26 21 31 31 Nd 93 181 24 36 33 387 nd 148 28 nd nd 80 nd S nd nd nd nd nd nd nd nd nd nd nd nd nd Sc nd 8.4 4.7 5.5 6.7 5.2 11 8.2 5.1 5.1 29 4.3 11
Ted29 Ted38 Ted39 Ted45 TW14 TW15 TW22 TW29 TW30 TW31 TW34 TW39 TW43 Sediments 49.66 55.42 67.45 70.33 67.64 57.78 61.30 70.35 67.68 72.06 71.14 71.25 56.01 0.33 0.58 0.39 0.36 0.46 0.46 0.59 0.65 0.61 0.60 0.40 0.40 0.20 1.76 9.57 8.75 8.52 9.55 8.97 7.96 10.46 12.00 10.74 9.08 9.40 7.28 1.01 6.68 5.32 8.05 5.29 6.63 4.80 6.09 7.33 5.66 6.35 6.53 5.35 0.05 0.21 0.21 0.24 0.22 0.26 0.21 0.19 0.34 0.28 0.47 0.25 0.26 24.68 3.04 1.14 0.41 1.36 2.53 5.34 0.77 0.47 0.31 0.32 0.13 0.47 3.36 10.34 4.19 0.24 4.17 8.17 5.92 0.96 0.38 0.27 0.41 0.33 0.35 3.81 1.84 3.16 3.88 2.54 2.98 1.36 4.02 3.95 5.41 3.62 2.66 4.82 0.62 3.15 2.84 4.68 3.12 3.38 2.27 4.20 4.13 4.16 4.31 4.29 2.47 0.05 0.04 0.07 nd 0.08 0.04 0.07 0.16 0.03 0.02 0.02 0.01 0.01 14.67 9.12 6.46 3.29 5.58 8.80 10.18 2.15 3.08 0.48 3.89 4.76 22.78 85 260 253 46 289 380 207 596 360 271 70 45 349 nd 30 258 233 200 155 148 197 227 198 222 243 153 3.3 3.7 2.4 nd nd nd nd nd nd nd nd nd nd nd 14 8.6 nd 12 10 17 1.9 1.1 nd nd 1.3 nd 7.9 128 152 167 109 109 82 103 141 133 131 137 113 nd 96 139 131 123 103 72 101 153 149 169 124 nd 6.2 10 11 2.4 0.9 nd 4.9 nd nd nd nd 0.9 2.9 2.9 13 13 15 5.3 1.7 0.4 4.7 2.2 4.8 6.1 7.4 1.7 10 87 81 132 83 67 68 86 84 77 109 106 14 791 261 116 5.9 113 256 278 47 12 4.3 15 5.3 31 3.6 11 14 16 14 10 12 14 15 17 19 17 29 249 33 33 6.8 27 20 52 26 10 6.7 5.2 6.2 4.6 5.4 67 81 101 73 65 51 87 94 78 97 89 nd 17 133 238 240 175 152 134 216 233 228 230 216 126 1.2 662 944 1055 849 666 601 931 872 848 1131 988 337 14 8.2 7.5 3.4 2.1 2.3 6.7 1.8 nd nd 0.7 nd nd 0.2 32.8 29 35 21 25 18 26 28 24 29 25 47 97 nd 44 62 86 80 63 88 107 99 93 106 120 953 nd nd nd nd nd 145 nd nd nd nd nd nd 8.9 9.9 10 5.8 5.8 4.9 10 4.4 11 9.7 1.0 0.2 0.4
Figure 3.1: TAS diagram of volcanic rocks from the central MER.
The petrographic investigation of representative thin sections shows that they are characterized by a few crystals of quartz, alkali-feldspar, orthopyroxene and amphibole within a prevalent glassy groundmass. Potential F-bearing minerals such as fluorite and apatite have not been observed.
Microprobe analyses have been carried out on the main mineral phases and on the glassy matrix (Table
3.2). The results revealed that the concentration of F is as high as 180 ppm in the glassy groundmass and
up to 260 ppm in accessory phases such as alkali amphibole (riebeckite composition) (Table 3.3). Therefore, considering the modal proportions of the investigated rocks (hydrous mineral phases are
Label TW30 (Ignimbrite) TW31 (Ignimbrite) TW29(Ignimbrite)
Amphiboles Glass Amphiboles Glass
SiO2 50.98 50.39 50.56 51.21 50.78 71.12 66.20 68.66 51.54 51.09 51.10 50.93 50.60 51.01 73.68 72.76 72.05 TiO2 2.26 2.29 2.18 2.18 2.23 0.55 0.48 0.52 2.11 2.15 2.18 2.38 2.17 2.19 0.34 0.33 0.27 Al2O3 1.85 1.29 1.23 1.43 1.45 9.23 8.80 9.02 1.17 1.17 1.15 1.22 1.28 1.19 9.67 9.75 9.98 FeO 17.01 21.24 21.23 19.71 19.80 6.66 5.60 6.13 21.73 21.33 21.78 21.65 20.86 21.46 4.83 4.70 5.01 MnO 1.01 1.49 1.40 1.20 1.27 0.31 0.31 0.31 1.40 1.39 1.35 1.39 1.37 1.38 0.20 0.21 0.25 MgO 11.83 8.69 9.19 10.74 10.11 0.24 0.21 0.22 9.17 9.01 9.17 9.00 9.28 9.12 0.04 0.03 0.00 CaO 6.03 4.94 4.92 5.32 5.30 0.22 0.13 0.18 4.66 4.73 4.91 4.66 4.88 4.77 0.21 0.20 0.23 Na2O 5.02 5.50 5.37 5.02 5.23 3.85 5.39 4.62 5.71 5.67 5.45 5.66 5.61 5.59 3.95 3.72 3.79 K2O 0.79 0.93 0.82 0.86 0.85 4.50 4.34 4.42 0.87 0.97 0.94 0.94 0.90 0.92 4.06 4.04 3.98 NiO 0.032 0.005 0.000 0.074 0.028 0.000 0.014 0.007 0.037 0.000 0.000 0.000 0.079 0.019 0.076 0.028 0.066 Wt%(F) 0.023 0.022 0.024 0.016 0.021 0.006 0.017 0.012 0.026 0.026 0.016 0.022 0.018 0.019 0.018 0.011 0.008 Wt%(S) 0.017 0.007 0.011 0.000 0.009 0.000 0.079 0.040 0.000 0.011 0.000 0.024 0.002 0.009 0.002 0.025 0.029 Wt%(Cl) 0.046 0.002 0.000 0.010 0.015 0.150 0.282 0.216 0.012 0.000 0.002 0.000 0.002 0.005 0.159 0.155 0.142
Table 3.2: Microprobe analyses on amphibole and volcanic glass of rhyolitic ignimbrites
Rock type Rift floor Ignimbrites
Label TW29 TW30 TW31
Phases Glass Glass Amphibole Amphibole
No of analysis points 4 2 5 6 SiO2 72.63 68.66 50.78 51.01 TiO2 0.31 0.52 2.23 2.19 Al2O3 9.84 9.02 1.45 1.19 FeO 4.82 6.13 19.80 21.46 MnO 0.19 0.31 1.28 1.39 MgO 0.02 0.23 10.11 9.12 CaO 0.22 0.18 5.30 4.77 Na2O 4.10 4.62 5.23 5.6 K2O 4.03 4.42 0.85 0.92 NiO 0.055 0.007 0.03 0.019 Average Wt% (F ) 0.011 0.012 0.021 0.019 average PPM (F) 110 120 210 190 Maximum PPM (F) 180 170 240 260 Average Wt%(S ) 0.024 0.040 0.009 0.009 Average Wt%(Cl) 0.143 0.216 0.015 0.005
Table 3.3: Summerized (average and maximum) concentrations from microprobe analyses on amphibole
4. Hydrogeochemistry of MER waters 4.1. Introduction
The geochemistry of natural waters involves the study of the composition and sources of chemical elements as well as the understanding of processes that control the composition of geochemical anomalies in waters. This chapter provides a brief discussion on the lithologic and hydrochemical controls on the chemical composition of waters. Considering that in the study area people principally relies on groundwater wells and springs for portable water resources, the investigation mainly focuses on toxic elements (such as F¯) which is negatively affecting the health of millions of the local populations.
4.2. Water sampling and analytical techniques
Water samples were collected during dry seasons in January 2006 and 2007 from 53 sites including 12 hot springs, 2 cold springs, 23 groundwater wells, 8 rivers, and 6 lakes in the Ziway-Shala basin of the MER valley, for the analysis of major ions (Na+, K+, Ca2+, Mg2+, F¯, Cl¯, NO3−, SO42−and HCO3−) and
trace elements (Li, Be, B, Al, V, Cr, Mn, Fe, Co, Ni, Cu, Zn, Ga, As, Rb, Sr, Mo, Ag, Cd, Sb, Te, Ba, Hg, Tl, Pb, Bi, U). Samples were stored in 100 ml polyethylene bottles after filtering through 0.45 µm membrane filters. For trace element analysis, samples were filtered and acidified with ultra-pure concentrated nitric acid. pH, electrical conductivity, and temperature were measured in situ.
Analyses were carried out at the Department of Earth Sciences of the University of Ferrara using AA spectrometry for cations (Na+, K+, Ca2+, Mg2+), ion chromatography and spectral photometry for anions (F¯, Cl¯, NO3−, SO42−). Titration techniques were used to analyze total alkalinity (CO32− + HCO3−).
element standards in aqueous matrices using Rh, In and Re as internal standard to correct instrumental drifts. Precision based on replicate analyses are estimated on average better than 4 % for As, B, Cr, V, Co, Fe, Zn, Cu, Ga, Pb, Ni, Cd, Mo, Sb, Al, Ba and about 15 % for the rest (Li, Be, Mn, Rb, Sr, Te, Hg, Bi and U). Accuracy, based on analysis’s results of certified reference material (CRM) is on average better than 12% for all elements.
4.3. Geochemical composition of the MER waters. 4.3.1. Major ion compositions
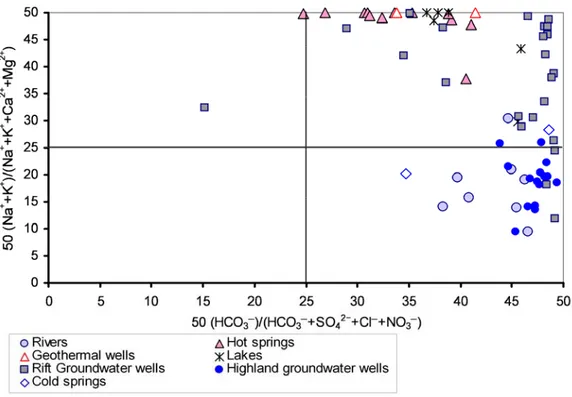
The major ions geochemical analyses of the different MER water types are reported in Table 4.1, show extremely variable composition, ranging from low TDS (and e.g. low F¯) in rivers to very high TDS (and e.g. high F¯) in the rift groundwater wells, hot springs and lakes (see sampling points on Figure
4.1). ID TYPE X Y T(OC) EC pH TDS Na+ K+ Mg2+ Ca2+ F− Cl− HCO 3− SO42− NO3− 1 RI 38.651 7.726 22.2 500 8.4 425 64 15 9.4 25.9 2.2 15 287 7 3.8 2 RI 38.822 8.153 23.3 530 8.7 583 56 12 20.9 42 1.5 16 409 25 2.0 3 RI 39.003 8.046 21.5 180 7.8 174 15 5 5.2 16.8 1.6 4 125 1 2.6 4 RI 39.054 7.801 18.7 90 8.3 98 5 2 2.7 18.5 0.2 1 67 0.8 2.0 5 RI 38.892 7.521 10.6 60 7.9 73 5 3 1.4 10.7 0.1 2 49 1.5 6.2 6 RI 38.863 7.465 11.5 40 7.8 53 3 2 1.2 8.4 0.1 1 37 0.2 1.8 7 RI 38.743 7.487 16.9 150 7.9 118 13 5 2.3 17.9 0.5 3 73 2.3 11.9 8 RI 38.657 7.262 14.0 150 7.9 156 16 7 2.2 40.7 0.3 7 79 4.1 10.2 9 HS 38.628 7.489 48.5 2750 8.9 1600 593 18 bdl 0.9 19.6 279 988 3.3 bdl 10 HS 38.634 7.477 93.4 14440 8.2 7919 2288 25 bdl 0.3 97 1462 3434 612 43.3 11 HS 38.634 7.477 57.3 10570 7.8 7501 2416 26 bdl 1.4 64 1324 3642 28 bdl 12 HS 38.634 7.477 91.4 13190 8.0 6589 2109 1 bdl 1.9 55 1148 3251 22 bdl 13 HS 38.637 7.477 52.6 1780 8.2 1141 346 26 bdl 3.2 8.4 196 561 bdl bdl 14 HS 38.423 7.402 59.3 4630 7.3 3600 969 66 8 8.8 17.5 321 2141 68.8 bdl 15 HS 38.436 7.422 51.8 4870 8.2 3896 1122 64 0.6 1.7 17.6 356 2267 66 bdl 16 HS 38.811 7.664 38.8 630 7.3 499 105 11 5.5 22 1.9 27 293 32.6 0.3 17 HS 38.773 7.712 62.0 3900 7.0 2766 802 60 0.7 13.9 23.4 435 1407 23 bdl 18 HS 38.773 7.690 96.0 4530 8.4 1830 170 39 bdl 0.9 23.5 429 915 253 34.4 19 HS 38.628 7.447 45.0 4665 9.1 3679 945 47 0.2 0.9 45.9 488 2098 54 bdl 20 HS 38.853 7.934 78.0 2040 6.8 1728 398 29 3.3 11 13 128 1110 35 bdl 21 GWL 38.798 7.793 82.0 2160 7.4 1297 306 110 bdl 0.5 13.6 162 653 52.9 bdl 22 GWL 38.796 7.788 85.6 4600 8.2 3051 771 152 bdl 0.8 40 207 1842 37.7 bdl
24 LW 38.448 7.127 22.1 800 8.8 715 161 27 6 13.5 7.4 24 476 0.6 1 25 LW 38.424 7.403 24.6 >20000 10.1 64267 17725 1109 bdl bdl 233 6330 38583 288 bdl 26 LW 38.435 7.423 25.8 >20000 9.6 11563 3426 125 0.6 4.5 90 1326 6497 95 bdl 27 LW 38.595 7.671 27.6 >20000 9.7 52725 15212 619 bdl 0.2 384 5361 30596 553 bdl 28 LW 38.736 7.919 25.2 420 8.6 379 61 11 7.6 27.3 1.5 10 253 6.6 2.4 29 WL 38.689 7.875 24.6 840 8.1 876 180 67 5.7 7.8 4.2 9 598 4 0.4 30 WL 38.724 7.841 26.0 1160 8.3 1164 241 33 4.9 4.4 2.8 16 857 5 1.6 31 WL 38.800 7.542 24.5 210 8.3 188 31 5 0.8 7.3 1.2 1 140 1 0.2 32 WL 38.772 7.520 21.5 340 7.6 323 18 6 7.7 45.7 0.4 2 244 bdl 0.5 33 WL 38.699 7.926 28.2 1020 8.3 1013 232 18 3.1 6.7 2.1 12 738 2 1.3 34 WL 38.834 8.159 24.4 640 7.7 623 90 11 11.5 33.4 3.6 20 448 6 4.3 35 WL 38.812 8.145 25.1 2750 7.8 2227 565 25 6.7 20.8 20 176 958 456 104 36 WL 38.999 8.053 25.3 300 7.8 267 50 5 2.7 10.2 1.8 2 195 bdl 1 37 WL 38.709 7.976 28.3 3360 8.2 3564 858 31 4.2 3.7 13.6 106 2547 7 bdl 38 WL 38.680 7.991 27.3 2180 8.8 1884 467 17 bdl 1.6 21.4 167 1025 186 29.5 39 WL 38.934 8.145 25.6 470 7.6 367 81 8 2.4 22.5 2.4 4 183 63.5 6.4 40 WL 38.966 8.120 24.6 350 7.5 871 61 9 2.3 27.7 3.1 145 226 397.7 15 41 WL 39.015 8.038 22.6 200 7.6 204 30 14 1.9 13.5 0.8 1 140 2 1.6 42 WL 38.749 7.482 22.5 220 8.3 211 33 2 1.1 24.7 1.5 1 146 0.8 0.4 43 WL 38.706 7.331 24.0 220 7.3 266 30 4 2.6 25 2 1 201 0.5 0.7 44 WL 38.395 7.152 23.2 1320 8.1 1252 307 12 5.6 17 13.1 17 872 7.8 bdl 45 WL 38.854 7.841 30.6 520 7.6 501 86 10 10.4 34 4.1 11 342 4 0.2 46 WL 38.838 7.821 32.3 2260 7.6 1952 480 28 30.5 30.7 7.1 266 1077 33.5 2.7 47 WL 38.637 7.833 36.0 2390 8.1 1949 557 26 0.1 29 14.3 153 1092 107 bdl 48 WL 38.648 7.720 23.6 460 7.1 420 69 12 4.6 41 1.7 11 271 8.7 bdl 49 WL 38.822 8.159 25.2 490 7.8 489 55 2 11.2 68 0.9 4 342 5.8 0.1 50 WL 38.742 8.066 23.7 1770 8.7 1735 443 21 1.9 7.2 10 19 1229 3.7 bdl 51 WL 38.532 7.006 36.4 730 7.9 668 140 15 3.2 18.9 3.1 7 475 6.4 bdl 52 CS 38.743 7.487 22.5 180 6.6 137 17 5 2.1 22.7 0.7 5 79 4.8 24 53 CS 38.869 7.891 27.6 280 7.8 258 40 6 4.2 22 1.3 2 180 2.2 bdl
Table 4.1: Major ion hydrochemical compositions (in mg/L) of MER waters from rivers, hot springs,
geothermal wells, groundwater wells, cold springs, and lakes in the Ziway-Shala basin. WL=Groundwater wells, HS=Hot springs, CS=Cold springs, GWL=Geothermal wells, LW= Lakes (ID: 23=Langano,
groundwater wells, thermal springs and rivers whereas the lakes have pH range of 8.6-10, with the highest value recorded in the alkaline lake Chitu.
Figure 4.1: Simplified geologic map of the study area (Ziway-Shala lakes basin) modified