Administrative Seat:
University of Sfax, Tunisia
National School of Engineers of Sfax Biological Engineering Department Unité de Biotechnologie des Algues Doctorate in Biological Engineering
University of Messina, Italy Department of Chemical, Biological, Pharmaceutical and Environmental Sciences Doctorate in Applied Biology and Experimental Medicine – XXIX Cycle
DNA barcoding identification of the
macroalgal flora of Tunisia
Ramzi MILADI
Doctoral Thesis
2018
S.S.D. BIO/01
Supervisor at the University of Sfax Supervisor at the University of Messina
1
TABLE OF CONTENTS
ACKNOWLEDGEMENTS ... 3 ABSTRACT ... 6 1. INTRODUCTION ... 81.1.SPECIES CONCEPT IN ALGAE ... 9
1.2.WHAT ARE ALGAE? ... 11
1.2.1.CHLOROPHYTA ... 12
1.2.2.RHODOPHYTA ... 13
1.3.CLASSIFICATION OF ALGAE ... 15
1.4.SPECIES DELIMITATION BY A DNA BARCODING APPROACH ... 16
1.4.1.ALGAE IDENTIFICATION USING DNA BARCODING ... 17
1.4.2.DNABARCODING APPLICATIONS ... 18
1.4.3.LIMITATIONS OF BARCODING ... 19
1.5.SPECIFIC BIODIVERSITY OF MARINE FLORA IN TUNISIA ... 21
1.5.1.GEOGRAPHICAL POSITION ... 21
1.5.2.INVENTORY ... 21
1.5.3.ALIEN SEAWEED INTRODUCTION ... 22
1.5.4.1. Natural introduction. ... 23
1.5.4.2. Anthropogenic introduction ... 23
2. AIM OF THE THESIS ... 26
3. MATERIALS AND METHOS ... 28
3.1.SPECIMEN COLLECTION AND PRESERVATION ... 29
3.1.1.COLLECTING LOCATIONS ON THE TUNISIAN COASTS ... 29
3.1.2.PRESERVATION ... 31
3.2.MOLECULAR TECHNIQUES ... 32
3.2.1.1.DNA EXTRACTION PROTOCOL FOR RED ALGAE (WIZARD ®DNA CLEAN UP SYSTEM, PROMEGA) ... 32
DNA EXTRACTION RECIPES APPENDIX 2. ... 33
3.2.1.2.DNA EXTRACTION PROTOCOL FOR GREEN ALGAE (CTAB) ... 33
3.2.2.1.POLYMERASE CHAIN REACTION ... 35
4. DNA BARCODING SHADES LIGHT ON NOVEL RECORDS IN THE TUNISIAN RED ALGAL FLORA (SUBMITTED) ... 39
5. A DNA BARCODING SURVEY OF ULVA (CHLOROPHYTA) IN TUNISIA REVEALS THE PRESENCE OF THE OVERLOOKED ALIEN U. OHNOI (ACCEPTED FOR PUBLICATION). ... 120
2
7. REFERENCES ... 157
APPENDIX 1. LIST OF SPECIMENS ... 179
A.1.1.PROJECT:TUGRE-GREENS OF TUNISIA (PHYLUM CHLOROPHYTA) ... 180
A.1.2.PROJECT:TURED-REDS OF TUNISIA (PHYLUM RHODOPHYTA) ... 181
APPENDIX 2. DNA PROTOCOLS ... 183
A.2.1.DNA EXTRACTION RECIPES ... 184
A.2.2.POLYMERASE CHAIN REACTION RECIPES ... 186
Acknowledgements 3
Acknowledgements
Acknowledgements
4
First and above all, I praise God, the almighty for providing me this opportunity and granting me the capability to proceed successfully. Undertaking this PhD has been a truly life-changing experience for me and it would not have been possible to do without the assistance and support that I received from many people.
Foremost, I would like to express my sincere gratitude to my Tunisian supervisor, Prof.Slim Abdelkafi who has been a tremendous mentor for me. I’m grateful to him for accepting me into his group, for his constant support, motivation and allowing me to grow as a research scientist. I have been extremely lucky to have a supervisor who care so much about my work and I would never have been possible for me to take this work to completion without his support and encouragement.
Special and heartily thanks to my Italian supervisor Prof. Marina Morabito for accepting me into her group, for her patience, motivation, enthusiasm and immense knowledge in DNA barcoding approach. It is with her supervision that this work came into existence. Her guidance helped me in all the time of research and correction of this thesis. As my supervisor, she has constantly forced me to remain focused on achieving my goal.
I’m greatly indebted to all the persons at both the University of Sfax and the University of Messina who agreed to conclude the co-tutorship agreement that allowed me to compete for a joint PhD degree especially to Prof. Salvatore Cuzzocrea, Coordinator of the PhD in Applied Biology and Experimental Medicine at Messina.
Furthermore, I am thankful to the funding sources EMMAG organization that allowed me to pursue my studies in Messina.
Dr. Angela Garozzo at the foreign PhD Secretary and Dr. Francesca Pollicino at the Erasmus office were very helpful and remarkably kind with me during my entire stay in Messina.
My sincere thanks also go to Dr. Antonio Manghisi for his advice and for acting as a mentor to me. I’m deeply grateful to him who gave me the opportunity to serve as a Teaching Assistant in his courses during my thesis. I gained a lot from his vast Biology knowledge and scientific curiosity.
Acknowledgements
5
I would also like to thanks Prof. Giusi Genovese for her guidance, encouragement, friendship and support during the whole period of the study. I never forget the opportunity that she gave to me to work on evaluation of antibacterial activity of algae against pathogens relevant in aquaculture, to improve my personal skills.
In my daily work, I have been blessed with a friendly and cheerful group of Professors, Technicians and fellow students in Messina and Tunisia. They made a cooperative atmosphere at work and also useful feedback and insightful comments on my work.
I am especially grateful to Dr. Fakher Kamoun and Dr. Mohamed Ali Ayadi for their incredible support and encouragement.
I would also like to thank my external referees for their interest in my work and for their very valuable comments and suggestions on this thesis.
Finally, last but not the least, I would like to thank my family: the most special thanks go to my Mom, who took the lead to heaven before the completion of this work. Words cannot express how grateful I am to her for encouraging me to follow my dreams. Her prayer for me was what sustained me thus far. Also, this thesis is heartily dedicated to the memory of my father Sleim. I miss him every day, but I’m glad to know he saw this process through to its completion. I never forget the sacrifices that he made on my behalf.
I warmly thank and appreciate my brother Najib for his material and spiritual support throughout my years of study. Also, I’m grateful to my brother Ahmed and my two lovely sisters Ola
and Mejda for their encouragement and assistance in numerous ways.
I can just say thanks for my two best friends of my life Heni and Houcine who helped me in algae collection and may Allah give them all the best in return.
Thank you.
Abstract
6
Abstract
7
Tunisia has a key position in the Mediterranean and constitutes a transition area with a rich habitat diversity between eastern and western basins.
The latest inventory of marine macrophytes dates back to 1987, updated in 1995. The target of this thesis was to carry on a molecular-assisted alpha taxonomy (MAAT) survey of macroalgae, which allowed to reveal cryptic species, allochthonous introductions and to identify problematic taxa.
Twenty-six genetic species of Florideophyceae were resolved, including five new reports, two of which considered as doubtful for the Mediterranean, and two others as alien species. Of the remaining 21, one was an alien, showing cryptic diversity among the Mediterranean reports of this taxon, two revealed cryptic diversity in other geographical regions, five required a taxonomic update and three a nomenclature update.
Nine genetic species groups were resolved within the genus Ulva (Chlorophyta), including the non indigenous species Ulva ohnoi, newly reported for Tunisia.
The actual picture of the taxonomy of Ulva spp. in the Mediterranean as a whole is far to be clarified and the present data on Tunisian collections aim to be a step towards its clarification.
This is the first DNA barcoding study on macroalgae in Tunisia. This paper is useful to add records to the BOLD system catalogue, amplifying the biodiversity knowledge linked to geographical information, and making them freely available for the scientific community.
An effective monitoring of the biodiversity changes by means of a quick and accurate tool, such as DNA barcoding, is essential to provide the basis for a correct environmental management.
Keywords: Alien species, COI-5’, cryptic species, DNA barcoding, Florideophyceae, molecular assisted alpha-taxonomy (MAAT), non indigenous species (NIS), tufA, Tunisian algal flora.
Introduction
8
Introduction
9
1.1. Species concept in algae
Species is considered as the currency for global biodiversity assessments (Caldecott et al., 1996) and important to conservation biology (Agapow et al., 2004). It is used as a fundamental tool of analysis in several areas of biogeography, ecology, and macroevolution (Brown et al., 1996; Blackburn & Gaston, 1998; Brooks & McLennan, 1999; Barraclough & Nee, 2001). The debate on the right species concept is certainly old and ongoing. In the post-Darwinian time, more than 24 different species concepts were proposed with different criteria for species delineation (Mayden, 1997).
The typological Species Concept characterizes species as a set of individuals
that are distinct from others by peculiar diagnostic characters. It is based on collecting and describing a “type” specimen for a given species (Linnaeus, 1751).The problem with this concept is the difficulty to find the good (diagnostic) characters, the polymorphism within populations, the geographic variation among populations and sibling or cryptic species (sibling species are reproductively isolated groups (different genetic entities) that are morphologically indistinguishable).
Biological species concept defines species as “groups of actually or potentially
interbreeding natural populations which are reproductively isolated from other such groups” (Mayr, 1942). Nonetheless, this is not applicable to asexually reproducing entities, such as many protist lineages.
Phylogenetic species concept is based on genetic indicators and defines a
species as the smallest monophyletic group of populations (Cracraft, 1989). The drawbacks are that a large quantity of data are used, variable levels of evolution occur between markers, lineage sorting, lateral transfer and hybridization also occur. It is applicable to allopatric and sympatric populations.
Ecological species concept defines species as a lineage (or a closely related set
of lineages) occupying an adaptive zone slightly different from that of any other lineage within its range and evolving separately from all lineages outside its range (Van Valen, 1976).This concept is problematic because it is based on very large datasets from different ecosystems.
Introduction
10
Genetic species concept defines species as a homogenous group forming a
genotypic cluster (Mallet, 1995). The problem is the variable levels of evolution between molecular markers for the same studied taxa.
Despite there is diversification in contemporary species concepts, all biologists share the fundamental idea that species are segments of lineages at the population level of biological organization, which differ in the secondary properties (e.g., intrinsic reproductive isolation, monophyly, diagnosability).
De Queiroz (1998; 2005; 2007) proposed a unified species concept according to which species are seen as inheriting character lines by vertical descent, which evolve under the influence of the same constraints and the same strength evolving in a spatio-temporal space data. This author suggested that a consensus is possible between the conflicting boundaries of species. When divergences accumulate between two lineages (genetic divergence at different loci, genetic isolation, etc.) two distinct lineages appear. Eventually, all the criteria set by the different concepts of species should be acquired to consider definitely two distinct lineages. The speciation phenomenon is progressive and for recently separated species there is a gray area where different concepts of species may conflict. It is essential to address the delimitation of species through integrative approaches (eg. Barrett & Freudenstein, 2011; Chesters et al., 2012; Roe & Sperling, 2007) in view of the large number of available methods (Sites & Marshall, 2004).
Introduction
11
1.2. What are Algae?
Algae are the organisms that are capable of oxygenic photosynthesis (or belong to phylogenetic groups that are capable of oxygenic photosynthesis) to the exception of Embryophytes. The photosynthetic organelle of algae and plants (the plastid) traces its origin to a primary endosymbiotic event in which a previously non-photosynthetic protist engulfed and enslaved a cyanobacterium. This eukaryote then gave rise to the red, green and glaucophyte algae. The other algal lineages have a more complicated evolutionary history involving secondary endosymbiotic events, in which a protist engulfed an existing eukaryotic alga, tertiary endosymbioses (engulfment of an alga bearing secondary plastid) and even quaternary endosymbioses (Bhattacharya et al., 2004).
Algae constitute a large group of plants primarily aquatic and represent 18% of the plant kingdom (Ramade, 2009). During their evolution, they formed diverse groups colonizing a large number of habitats and presenting, inter alia, a variety of sizes, cell structures and life cycle (De Reviers, 2003). They play very important roles in many marine communities. They are the nutritional base of aquatic food webs and provide a three-dimensional space where animals shelter, breed, and deposit eggs.
Algae can be microscopic, unicellular microalgae or macroscopic, multicellular macroalgae. Some seaweeds are organized in holdfast, stipe and frond or blade, but many others lack one or more of these structures, due to morphological modification and adaptation. According to their thallus construction, the internal structures of seaweeds are composed of similar cells with simple differentiation. In fact, most of them are filamentous or are built up of united or corticated filaments. Parenchymatous development is found only in kelps, fucoids, Ulvales, Dictyotales and some others (Lobban & Harrison, 1994).
Macroalgal systematics is very complex and in continuous evolution. Lamouroux (1813) was the first to use colour to separate algal taxa. Since Harvey (1836) seaweeds are divided into three main groups (red, green and brown) based on their pigmentation. This was the first use of a biochemical criterion in plant systematic. Numerous taxonomic changes were made in the following decades, but only with the relatively recent advent of ultrastructural and molecular systematic data a more detailed
Introduction
12
classification of the multitude of species belonging to this group was started. Feldmann (1963) wrote "algae actually constitute an extensive and heterogeneous branches set very distinct of each other and having between them only a little common characters." This polyphyletic assembly includes at least seven distinct phylogenetic lineages (Lewis & McCourt, 2004).
1.2.1. Chlorophyta
Green algae have the same photosynthetic system of vascular plants, which is dominated by the chlorophylls a and b, usually in association with a pyrenoid. The chlorophylls are the pigments that give this group of algae its green coloration. These pigments absorb red light, which is available in shallow waters, but absent in deeper water. The cell walls usually contain cellulose, and they store carbohydrate in the form of starch located in chloroplasts (Judd et al., 2002). Only about 10% of green algae are marine species (mainly macroalgae), most live in freshwater (mostly microalgae). Thus, green seaweeds live most commonly in the shallow intertidal zone. There are more species of green algae in warm tropical oceans than in cooler temperate seas. Many of them are single-celled, living in freshwater, marine or terestres environment. Some are filaments, branched or not, blades, tubes, cords or crusts. Some others have siphonous structure i.e very large cells without partition (e.g., Bryopsis, Codium).
Reproductive cycles of green macroalgae present alternating sporophytes and gametophytes either similar such as Ulva and Cladophora, or completely different as in Monostroma and Ulothrix. Most gametes and spores are flagellated. They usually live with two or four apical flagella, or, in rare cases, a crown of flagella.
The Chlorophyta comprise an old and taxonomically complex lineage including also land plants (Lewis & McCourt, 2004; McCourt et al., 2004; Hall & Delwiche, 2007; Pröschold & Leliaert, 2007; Becker & Marin, 2009). Their classification has been based mostly on ultrastructure (Norton et al., 1996; Pröschold & Leliaert, 2007) until the introduction of the molecular phylogenetic approach, which allowed to infer their evolutionary history (Leliaert et al., 2012). It is currently recognized the occurrence of two early divergent lineages: the Chlorophyta and Streptophyta (Picket-Heaps & Marchant, 1972; Bremer, 1985; Lemieux et al., 2007). The former includes the majority
Introduction
13
of green algal species, while the latter comprises Charophytes, a paraphyletic assemblage of freshwater algae, and the land plants.
1.2.2. Rhodophyta
The red algae are a distinct monophyletic lineage characterized by a two-membraned plastid that contains the photosynthetic pigments (phycocyanin, phycoerythrin and allophycocyanin), which are organized in phycobilisomes within unstacked thylakoids (Gabrielson et al., 1985; Gabrielson & Garbary, 1986; Gabrielson et al., 1990). They can grow in the intertidal zone and in deeper waters than the other algae thanks to these accessory pigments. Their carbon storage polysaccharide is named “rhodamylon” and it is stocked outside of the plastid. Red algae have peculiar cell-juctions, named pit connections or pit-plugs (Wetherbee & Quirk, 1982; Gabrielson et al., 1985; Gabrielson et al., 1990; Saunders & Hommersand, 2004). Two relevant polysaccharides are found in their cell walls: agar and carrageenan, which are gelling compounds used as an ingredient in food products and scientific applications in microbiology and biotechnology. The red algae are found in a variety of morphologies, including simple and branched filaments, fleshy plants, and sheets, most constituted by simple or complex filamentous aggregations. Some red algae are single celled, while others can reach lengths of 2 or 3 meters.
The division Rhodophyta includes the oldest taxonomically defined eukaryote organism, dated at 1.2 billion years old (Butterfield, 2000) and this marks the onset of a major evolutionary radiation of eukaryotes. The majority of species thrive in marine or brackish environments with a few species found in freshwater (Lobban & Harrison, 1994). More recent studies have divided this phylum into seven classes including: the Rhodellophyceae, Cyanidiophyceae, Compsopogonophyceae, Stylonematophyceae, Porphyridiophyceae, Bangiophyceae and Florideophyceae (Saunders & Hommersand, 2004; Yoo et al., 2006).
The majority of red algae belong to the last class, including marines species exhibiting a complex life history that involves the alternation of three generations, two of which with independent life, gametophytes and tetrasporophytes, and a third, carposporophyte, that can be interpreted as a vegetative multiplication of the zygote. Sporophytes and gametophytes can be morphologically similar (recognizable by their
Introduction
14
reproductive organs) or completely dissimilar. In the latter case, these generations may have received not only separate names but have been classes in different families, before anyone noticing that they were part of the cycle of a single species.
In all red algae reproductive cells always lack flagella and most show amoeboid movements.
Introduction 15
1.3. Classification of algae
The classification of algae is traditionally based on morpho-anatomical characters. This method may cause often frustration in identification of mostly macroalgal species because of two main problems: 1) it fails for the many asexual lineages of algae, as well as for species for which life history patterns are not known; 2) it leads to misidentifications in the case of cryptic species (i.e. with morphologies identical or similar also if they represent different taxa), or of environmentally influenced morphological characters. In particular, the presence of several morphotypes belonging to the same taxon can lead to two possible errors: assignment of different morphotypes to distinct species or misidentification of species actually different. These features are a great hindrance for the development of a more universal, rather than more restrictive, taxonomy of algae. Even for the experienced systematist, accurate seaweeds identification can remain elusive due to their simply morphologies, phenotypic plasticity and convergent evolution (Saunders, 2005). It is thus not surprising that algal systematists have come to rely heavily on molecular approach to obtain informations about the evolutionary history of species independent from the phenotypic characters.
Introduction
16
1.4. Species delimitation by a DNA barcoding approach
DNA barcoding is a taxonomic method for the quick identification of any species based on extracting a DNA sequence from a tiny tissue sample of any organism. It differs from molecular phylogeny in that it aims to recognise an unknown sample basing on a pre-existing classification rather than to resolve relationship (Kress et al., 2005). A DNA barcode is a standardized short sequence of DNA (400 – 800 bp) that can be easily amplified and sequenced for (ideally) all species on earth (Hebert et al.,2003; Savolainen et al., 2005). It was first proposed by Paul Hebert and colleagues and initially applied to animals (Hebert et al., 2003, 2004). The ideal barcode is a highly variable region, useful for species discrimination, flanked by highly conserved regions in order to design PCR primers. Species identification is successful when isolates from a single species group cluster together in distance analyses and the largest intraspecific divergence is less than the smallest interspecific one, this difference named the “barcoding gap” (Hebert et al., 2003a; Meier et al., 2008). Furthermore, the DNA barcode should be short enough (<700 bp) to be sequenced in a single read (Hollingsworth et al., 2009b).
The mitochondrial COI gene encoding the cytochrome c oxidase 1 has been selected for animal phyla (Herbert et al., 2003, 2004), due to uniparental transmission, a high rate of evolution, the absence of introns, large numbers of copies in each cell, and a limited recombination (Galtier et al., 2009). However, the selection of standard DNA barcode loci for other groups of eukaryotes has been more complex.
The barcode of life project seeks the establishment of a reference database useful to assign a species name to unidentified specimens while promoting the discovery of new species (Schindel & Miller, 2005). To coordinate scientific projects, the international initiative CBOL (Consortium for the Barcode life) was created in 2004 to promote and coordinate the project internationally. The cornerstone of this project, the BOLD database (Barcode of Life database) (Ratnasingha & Herbert, 2007) was established with the intent to maintain a strong link between specimens (georeferencing, biological data and conservation site in an accessible collection) and sequences.
Introduction
17
1.4.1. Algae identification using DNA barcoding
The DNA barcoding method has become increasingly common to identify species of marine algae. Several DNA markers of different origin (nuclear, plastid and mitochondrial) have been applied to study phylogenetic relationships at various taxonomic levels. The mitochondrial marker COI initially proposed for the animals was tested in algae to conform to theoretical universality of the barcode marker. In fact, a 650 base pair (bp) segment of the 5’ region of the mitochondrial COI gene is currently used for cataloguing red algal biodiversity, examining intraspecific variation, and resolving differences between closely related species (Saunders, 2005; Sherwood et al., 2010; Le Gall & Saunders, 2010). Moreover, this marker has proven to identify or delimit species in brown algae as well (Lane et al., 2007; Kucera & Saunders, 2008; Mcdevit & Saunders, 2009, 2010; Macaya & Zuccarello, 2010; Mattio & Payri, 2010).
The idea of a universal barcode with a standard gene, applicable to all biodiversity proved to be not feasible, particularly for algae, which belong to several major lines of the tree of eukaryotic life (Hampl et al., 2009). In fact, the COI-5’ does not appear as a good candidate in green algae because of the inability to sequence the gene. Indeed, in this group, this gene can contain multiple introns (e.g., five in Chaetosphaeridium, Turmel etal., 2002) and the position and number of them in the gene are not known for most species.
Several markers have been selected to investigate as potential DNA barcode markers for the marine green macroalgae such as the nuclear internal transcribed spacer region of the ribosomal cistron (ITS), extensively used for investigations of phylogeny, molecular ecology and evolution of marine green macroalgae (Hayden & Waaland, 2004). Besides, the plastid rbcL gene (ribulose-1,5-bisphosphate carboxylase/oxygenase) was employed extensively to resolve taxonomic issues in green algae, for instance in the genus Ulva (e.g., Hayden & Waaland, 2002; Hayden et al., 2003; Hayden & Waaland, 2004). Unfortunately, also rbcL is affected by the presence of introns in some green algae (Hanyuda et al., 2000). A study by Saunders & Kucera (2010) evaluated new markers for barcode approaches in green algae and showed that the plastid elongation factor gene (tufA) was the best candidate for chlorophytes, except for Cladophoraceae where the amplification and sequencing of different markers tested
Introduction
18
remain problematic. Since then, tufA gene has been used largely to discriminate among green algal species (Famà et al., 2002; Zuccarello et al., 2009; Händeler et al., 2010).
1.4.2. DNA Barcoding applications
The case of marine macroalgae is an excellent example of the value and strength of DNA barcoding. Therefore, in a context of impoverishment of taxonomic experts, it proves to be a fast and reliable identification tool within the reach of non-specialists. As a research tool for taxonomists, DNA barcoding assists in identification by expanding the ability to diagnose species by including all life history stages of an organism (e.g., seedlings, juveniles, mature individuals both fertile and sterile), unisexual species, damaged specimens, gut contents, scats and fecal samples. In addition, DNA barcoding has proven as phenomenal tool to aid in the delimitation of cryptic species (organisms morphologically identical but with significant genetic divergence; Bickford et al., 2007) and pseudo-cryptic (organisms with significant genetic divergence but with subtile morphological distinctions), likewise to explore new records for red and brown seaweeds (Saunders, 2005; Robba et al., 2006; Kucera & Saunders, 2008; Saunders, 2008; McDevit & Saunders, 2009; Saunders, 2009; Walker et al., 2009; Le Gall & Saunders, 2010). Furthermore, DNA barcoding can be used to quickly and accurately identify non indigenous species, especially invasive aliens and prompt preventive measures with subsequent regulatory control can be initiated. Finally, besides the fundamental study of biodiversity, DNA barcoding can be used as an important tool for identification, authentication and safety assessment of sea food, particularly for processed products.
However, comparison with type specimens (on which species names are based) or other relevant historical material, typically stored in museum collections, is important. For example, this approach can be fundamental to understand if a new reported alien taxon is the result of a recent introduction or was already present in the environment, but erroneously classified because of its cryptic morphology, or it can be useful to solve some current systematic problems, such as the great number of superfluous and synonymised species names recorded and the use of distinct names for the same species sampled from different regions. Moreover, the comparison between fresh collected and historical samples can be important to compare seaweed biodiversity
Introduction
19
patterns and to summarize the occurrence and the distribution of introduced species (Provan et al., 2008; Lister et al., 2010). The use of these markers also for phylogenetic reconstruction of a particular algal group can be useful to determine which morphological characters are congruent with the molecular data within a specific clade and which not, so that only the ones having a genetic basis will be used for correct species or genus identifications in future studies.
1.4.3. Limitations of barcoding
The identification of vast numbers of unknown organisms using DNA sequences becomes more and more important in ecological and biodiversity studies. In this framework, limits of the DNA barcoding method can result from its single-locus identification system.
In addition, DNA barcoding depends on the assumption that speciation (whatever the species concept in use) is generally accompanied by divergence in the sequence of the barcode marker. However, sequence divergence is stochastic rather than steady and so some closely related species will not be resolved in cases of incomplete lineage sorting (Verbruggenet al., 2009).
Furthermore, the major drawback is the current lacks of universal amplification primers. For examples, the original red-algal primers (Saunders, 2005) are successful in some groups, but show mixed results in other lineages, which may be due to heterogeneity within a species at positions near the 3’ end of the primers (Saunders, 2008). New primers have been developed and the search for the most widely effective ones is still in progress (Saunders & McDevitt, 2012).
Another statistical difficulty is caused by the low number of individuals analyzed per species, which does not allow a precise estimation of the intraspecific variation compared with interspecific variation (Matz & Nielsen, 2005; Nielsen & Matz, 2006). However, the constant increase of data in the BOLD archive is going to correct this last problem.
Another limitation related to many potential DNA barcoding applications that can only be based on degraded DNA. This is the case for most environmental samples where the target is DNA from damaged specimens. It is usually difficult to amplify DNA fragments longer than 150 bp from such samples (Deagle et al., 2006). As a
Introduction
20
consequence, shorter barcoding markers are under evaluation (Hajibabaei et al., 2006; Meusnier et al., 2008; Erickson et al., 2017).
Introduction
21
1.5. Specific biodiversity of marine flora in Tunisia
1.5.1. Geographical position
Tunisia, occupying a central place in the Mediterranean, opens up widely onto the sea, mainly on its eastern and western shores. It has more than 1300 km of coastline that constitute transition area and habitat diversity between the two basins of the Mediterranean. The topography of the Tunisian coast is very varied: rocky or sandy coast, deep gulf, sometimes protruding capes, numerous islands and islets and shoals belt are the most characteristic elements (Azouz, 1966; Ben Mustapha,1966; Poizat, 1970, Azouz, 1973; Ben Othman, 1973; Blanpied, et al., 1979; Pergent & Kempf, 1993). All these specificities allow the existence of a particularly interesting marine and coastal biodiversity especially concerning algal biodiversity. The flora of the northern coast of Tunisia (including the Gulf of Tunis) has some affinities with that of the Western Mediterranean with its rich algal flora (Ben Maiz &Boudouresque, 1986). Conversely, the eastern and southern sides have the properties of the flora of the eastern Mediterranean which considered poor in algal biodiversity compared to that of the countries of the western basin. This reflects the fact that this region, located in the western basin has a very diverse topography.
1.5.2. Inventory
The first records of Tunisian marine algae were published by Piccone (1879, 1884), who reported a limited number of taxa from the northern coasts, while the first inventory was compiled by Debray (1897). After, a few studies were carried out until the valuable works of Ben Maiz (Ben Maiz et al., 1987, Ben Maiz, 1995), which represent the latest inventory available of marine macrophytes from this country.
Subsequently, only papers on specific taxa (Djellouli, 2000, Ben Said & Ksouri, 2002, Ksouri et al., 2002, Langar et al., 2002, Chebil-Ajjabi et al., 2005, Bouafif et al., 2014, Bouafif et al., 2016), on a limited area (Ben Maiz & Shili, 2007, Ben Mustapha & Afli, 2007, Shili et al., 2007), with an ecological aim (Ben Mustapha & Afli, 2007, El Ati-Hellal et al., 2007), dealing with non indigenous species (NIS) (Sghaier et al., 2016) or papers dealing with applicative purposes in which macroalgae are exploited (Ksouri
Introduction
22
et al., 2007, Azaza et al., 2008, Yaich et al., 2011, Kolsi et al., 2015), have been published
However, floristic and taxonomic studies on Tunisian marine flora have been carried on only by means of a classic morpho-anatomic identification approach.
1.5.3. Alien seaweed introduction
Algal biodiversity can be impacted upon negatively (overall reduction and/or shift in composition) by factors such as global warming, increased environmental stress arising from fisheries and aquaculture activities and by accidental introductions of invasive species. The term invasive species typically refers to non indigenous species (NIS) that have a negative impact on the environment or on human activities. In fact, macroalgae represent not only a large component of the globally introduced biota (e.g., Ribera & Boudouresque, 1995; Lewis, 1999; Ribera Siguan, 2002; Schaffelke et al., 2006), but also significant economic and environmental risks for which control and management options are limited (e.g., Ribera & Boudouresque, 1995; Thresher, 1999; McEnnulty et al., 2001; Anderson, 2007; Schaffelke & Hewitt, 2007). In consequence to the recent climate change and temperature increase, they spread in wider regions finding numerous habitats suitable for their growth. Climate-driven invasions could lead to completely transformed ecosystems where alien species dominate for function or richness or both, leading to reduced diversity of native species (Mack et al., 2000; Gritti et al., 2006). We distinguished three categories of invasive species according to Zenetos et al. (2010): cryptogenic species, with no definite evidence of their native or introduced status; established species, known from more than two localities or records; questionable species, with insufficient information. A total of 27 NIS macrophytes were recorded from Tunisia, which is low compared to the 129 species listed for the Mediterranean Sea (Verlaque et al., 2015). However, compared to nearby Mediterranean regions, this number is close to that reported in the Straits of Sicily (18) (Occhipinti-Ambrogi et al., 2011) and Algeria (17) (Verlaque et al., 2015), and higher than those recorded in Malta (12) (Sciberras & Schembri, 2007; Evans et al., 2015a, b; Schembri et al., 2015), and Libya (14) (Bazairi et al., 2013). This number has greatly increased since the late 20th century, with sixteen new NIS reported after 1960.
Introduction
23
1.5.4. Introduction pathways of alien seaweed
1.5.4.1. Natural introduction.
The Mediterranean Sea, transition zone between the Atlantic Ocean (through the Strait of Gibraltar) and the Indian Ocean (via the Suez Canal and the Red Sea), had at the end of the nineteenth and in the twentieth centuries several disturbances of which opening of the Suez Canal. In consequent, composition of flora and fauna has greatly changed. The Tunisian coast, particularly the Gulf of Gabes region, suffer the consequences of this disturbance that has led to modifications in the composition of flora and fauna. Indeed, several animal and plant species have arrived in Tunisia from either the Atlantic or the Indo-Pacific. These species are mainly from the Red Sea (Lessepsian species) and secondarily from the Atlantic. For example, the entrance of invasive species may unbalance the environment and affect native communities, such as the case of Caulerpa taxifolia, which supplants Posidonia oceanica, and the Lessepsian shrimp Trachypenaeus curvirostris, which replaces the royal shrimp Penaeus kerathurus (Bradai, 2000). The identity and abundance of NIS in Tunisian waters could be explained by its southern geographical position located at the crossroads between the eastern and western basins of the Mediterranean Sea.
1.5.4.2. Anthropogenic introduction
Some Tunisian localities such as Bizerte, El Kantaoui, Cap Monastir and Tunis displayed a high number of recorded aliens compared to the average, confirming that hotspots for marine species introduction are coastal lagoons and harbours where human activities such as shipping and fishing activities, recreational marinas and aquaculture affect the health of ecosystems and facilitate the introduction and the secondary dispersal of alien species (Cohen & Carlton, 1998; Verlaque, 2001; Occhipinti-Ambrogi & Savini, 2003; Rilov & Crooks, 2009; Hoffman et al., 2011; Occhipinti-Ambrogi et al., 2011).
Aquaculture represents a source of pollution rarely taken into account, still poorly assessed, but which seems considerable. Non-indigenous species introduced by aquaculture are of two kinds: species introduced intentionally to implement new aquaculture industries, and species introduced accidentally when for example they are fixed to the species deliberately introduced. At present seaweed introductions belong to the latter kind. An example of the first kind of introduction is the case of the oyster
Introduction
24
Crassostrea gigas, from the Northwest Pacific Ocean, introduced in the Mediterranean due to the high mortality of the local species, the Portuguese oyster, C. angulata. The importation of C. gigas allowed the introduction of another species of gastropod mollusc, Crepidula fornicata, now becomes quite intrusive, and of several algal species, such as Undaria pinnatifida. Oyster farming is an important vector of introduction because of the many exchanges occurring between oyster farms. In the Thau lagoon (France, Mediterranean), there are at least 9 species of algae whose introduction is linked to the introduction of oyster spat of Crassostrea gigas (Perez et al.,1981; Riouall, 1985; Riouall et al., 1985; Ben Maiez, et al., 1987; Verlaque & Riouall, 1989). Recently, Manghisi et al. (2010) demonstrated that the red alga Agardhiella subulata, endemic to the Atlantic coast of North America, was introduced to Sicily from the Netherlands as a plantlet growing on a C. Gigas shell. P. morrowii has been reported as an intertidal species and it has been found on a large variety of substrata including rocks, wooden piles, ropes, mussels, crabs and shells, as well as other large algae, such as S. muticum and U. pinnatifida (Kimet al., 1994; Kudo & Masuda, 1992).
Aquaculture in Tunisia is a very old activity dating back to Roman times as evidenced by some mosaics of the Bardo Museum in Tunis. Fisheries and aquaculture play an important role in socio-economic terms and as a source of food. The recent Tunisian aquaculture experience began in the 1960s. Initiated by the private sector, this activity began with growing the Mediterranean mussel Mytilus galloprovincialis and the Pacific cupped oyster Crassostrea gigas on intertidal trestles in Bizerte. The supply of mussels spat is provided locally by capture in the Bizerte Lagoon while the oysters spat was imported from abroad (France, Italy). The main marine aquaculture projects and farms are located, for the moment, within the area situated off the east coast, from the gulf of Hammamet to the beginning of the golf of Gabes. Four shellfish farming projects were established in the Bizerte Lagoon to the north of Pats, and four other Bluefin tuna fish fattening projects on the east coast: two of them in the Sousse Governorate, and two others in the Mahdia Governorate. Another fish farm has just been opened to breed Nile tilapia in Southern Tunisia. Only two species of fish were farmed in the past – European seabass and gilthead seabream –but during the last decade, freshwater fish species (42%), shell-fish (5%), bluefin tuna (16%) and marine fishes (37%) have also been farmed.
Introduction
25
The beautiful green alga Caulerpa taxifoliais frequently used to decorate aquariums. It is through aquariology that this species has been introduced in the Mediterranean. His accidental discharge into the sea following the cleaning of aquariums has been responsible for its introduction and expansion in many localities very fast. On the other hand, other introduced species do have an impact on the indigenous species or communities: this is referred to as biological pollution (Sindermann et al., 1992). The threatening of native species may give rise to alterations in the functioning of the ecosystem.
Aim of the thesis
26
2. Aim of the thesis
Aim of the thesis
27
Algae exhibit simple morphologies, with high phenotypic plasticity and convergence, and in some groups heteromorphic generations alternating in life histories, which are all features making species identification a very challenging task.
Algal taxonomists have solved such difficulties using “the more objective technique of MAAT [molecular assisted alpha-taxonomy], which uses differences in gene sequence data to delineate genetic species groups that are subsequently analysed morphologically and assigned to existing species or established as novel taxa” (Filloramo & Saunders, 2016).
As detailed above, different barcodes have been selected as markers for the different branches of the tree of life, including red and green macroalgae lineages (Saunders & McDevit, 2012). Since its beginning, MAAT using the mitochondrial COI-5’ region showed to be effective and reliable for defining red algal species limits (Saunders, 2005, Manghisi et al., 2010, Le Gall et al., 2015). Differently, for Chlorophyta, the plastid tufA gene resulted as a viable marker with a higher resolution power at species level in comparison to the other molecular markers (Saunders & Kucera, 2010).
To achieve a comprehensive knowledge of the macroalgal flora of a specific area, as well as of a specific taxonomic group, an integrative approach is essential, including morpho-anatomical observations, ecological and biogeographic data together with phylogenetic analyses. However, this approach is time consuming and requires trained specialists. In the aim of carrying on a rapid and effective survey of the macroalgal diversity in a specific area, which allows to uncover cryptic species, very common in macroalgal taxa, to monitor allochthonous introductions and to identify problematic taxa (Manghisi et al., 2010, Kress et al., 2015, Machín-Sánchez et al., 2016, Kogame et al., 2017), DNA barcoding should be the preferred choice.
The aim of the present thesis is to provide a molecular-assisted alpha taxonomy (MAAT) survey of florideophycean algae and Ulva spp. along Tunisian coasts for the compilation of a DNA barcode inventory.
At the best of our knowledge, this is the first study on Tunisian macroalgal flora using DNA barcoding methods, since as already mentioned, up to the present, previous floristic and taxonomic studies have been carried on only by means of a classic morpho-anatomic identification approach.
Materials and Methods
28
Materials and Methods
29
3.1. Specimen collection and preservation
3.1.1. Collecting Locations on the Tunisian Coasts
The Tunisian coastline is approximately 1300 km long. The northern boundary (08°45'00" N lat., 36°57'00" E long.) is 5 km west of the city of Tabarka and the southern boundary (11°34'00" N lat., 33° 10' 00" E long.) is 6 km south of Lake El Bibane. Sixteen sampling sites distributed along the Tunisian coastline were investigated, from February 2014 to March 2016 (Figure 3, Table 1).
Fig. 3. Location of sampling sites in Tunisia. The characteristics of site numbers are
given in the Table 1.
Macroalgae were hand collected between the seashore and 6 m of depth. List of specimens with collection information is reported in Appendix 1. Collection were made from three different types of environment (i) regions within ports and harbors where invasive or exotic species would be most expected to be present due to decades (even
Materials and Methods
30
centuries) of international shipping, (ii) open-coast regions not on shipping routes where truly native species might be expected to have persisted up to the present, and (iii) low-salinity or freshwater habitats in sites unconnected to navigable river systems and where no routes of invasion are apparent.
Tab. 1: Sampling sites in Tunisia.
Locality (North to South Tunisia) Coordinates (Lat. N - Long. E) Date Depth (m) Substrate 1 Tabarka 36.9579-8.7554 30/07/2014 1-3 rock/sand 04/04/2015
2 Sidi Bou Saïd 36.8664-10.3501 25/04/2014 3-4 rock/sand 3 El Kram/Tunis 36.8305-10.3188 01/03/2014 0-1 rock 4 Korbous 36.8279-10.5691 08/04/2015 0-1 rock 5 Sousse 35.8335-10.6417 01/08/2014 0-3 rock/sand 03/09/2014 12/04/2015 13/08/2015 26/03/2016 6 Marina Cap Monastir 35.7788-10.8332 02/08/2014 0-1 rock 7 Monastir 35.7737-10.8377 03/08/2014 1-3 rock/sand 10/04/2015 8 Ksour Essef/Mahdia 35.4190-11.0406 05/02/2014 0-1 muddy sand 9 Chebba Beach 35.2421-11.1392 17/03/2014 1-6 rock/sand
12/04/2014 22/06/2014 04/08/2014 10 Port Of Chebba 35.2308-11.1629 27/04/2014 11 El Kantra/ Kerkennah 34.6622-11.1222 20/04/2014 1-4 rock/sand 01/06/2014 15/08/2015
12 Chaffar Beach/Sfax 34.5334-10.5841 28/06/2014 0-1 muddy sand 13 Corniche Gabes 33.8918-10.1188 10/08/2014 0-1 muddy sand
10/08/2015 14 Port Of
Zarat/Gabes
33.7003-10.3634 15/08/2014 0-1 rock/sand 15 Zarat Beach/Gabes 33.6901-10.3819 12/03/2014 0-1 muddy sand 16 Sidi Kbir Beach/
Zarzis
Materials and Methods
31
For each specimen, notes were taken about collection details, such as where the algae was growing (e.g., location in the intertidal, low to high...), what it was growing on (e.g., rock, other algae, etc.), and any other distinguishing features that may be lost when the specimen is removed from the field (e.g., iridescence).
3.1.2. Preservation
Freshly collected material was placed in plastic bags filled with seawater and transported to the laboratory, where it was rinsed in clean seawater to remove debris and most epiphytes. For each sample, a voucher specimen was prepared by pressing a single individual on an herbarium sheet with a subsample dried in silica gel for molecular analyses. Vouchers are housed in the Phycological Lab Herbarium (PhL) of the University of Messina, Italy (http://grbio.org/institution/phycological-lab-herbarium-university-messina).
Materials and Methods 32
3.2. Molecular techniques
3.2.1. Genomic extraction for Macroalgae
DNA was isolated from silica dried thalli as detailed in Manghisi et al. (2010) from red algal samples, and from green algal samples using a standard CTAB-extraction method (Doyle & Doyle, 1987), with few modifications: 2-mercaptoethanol was excluded from the extraction buffer, while 1% PVP and 0.02% of proteinase K were added; lysis was performed at room temperature for 2 hours on a rotary shaker.
3.2.1.1. DNA extraction protocol for red algae (Wizard ® DNA clean up System, Promega)1
• Defrost 20 mg/ml Proteinase K (stored in the freezer) and keep it on ice.
1. Mark a sets of 2.0 ml microcentrifuge tubes according to the number of samples. Add to each tube 600 µl of DNA extraction buffer (Reds), 60 ul of 10% Tween 20 (both should be at room temperature when used), 6 ul of 20 mg/ml Proteinase K2.
2. Grind small amount (50-100 mg dry weight) of clean tissue in liquid nitrogen. Transfer it in the prepared microcentrifuge tube (or grind directly in the tube and then add the buffer).
3. Mix constantly for 60 (120) min at room temperature (e.g. on rotary shaker). 4. Incubate on ice 10 (20) min.
5. Spin for 10min @ top speed (17000 rpm) at 4°C.
All of the following steps should be done under the hood and wide bore tips should be used for all of transfers until precipitation.
• Move to Wizard ® DNA clean up System (Promega):
6. Move supernatant in a 2,0 ml tube.
7. Mix the resin before use. Add 1ml of Wizard® DNA resin to each tube and and mix by gently inverting several times (invert tubes for 20 seconds; allow to stand for 20 seconds; invert for 5 seconds; allow to stand for 20 seconds).
8. Prepare column by removing the plunger and then screwing a Wizard® minicolumn onto the end of a new syringe. Pipette sample into the top of the syringe.
1See manufacter instructions for further details.
2 Proteinase K is heat sensitive and should be handled with care. Store it in the freezer. Before use, thaw it,
Materials and Methods
33
9. Replace plunger and pump solution through at a rate of about 1 drop per second (into a waste vessel).
10. Remove minicolumn from the syringe and suck up 2ml of newly made 80% isopropanol.
11. Replace minicolumn and pump the isopropanol through the minicolumn at a rate of 1 drop per second (into a waste vessel).
12. Remove minicolumn from the syringe and transfer it to a capless 1.5ml microcentrifuge tube and spin at 14000 rpm for 2 minutes to completely dry the column.
13. Move the minicolumn to a new microtube. Allow to stand for 3 minutes to allow excess isopropanol to evaporate.
14. Add 50 (100) µl of warm (700C) (or at room temperature) ddH2O to the minicolumn.
Allow to stand for 90 seconds. Spin at 14000 rpm for 1 minute. DNA templates can be stored at –20ºC.
DNA extraction recipes Appendix 2.
3.2.1.2. DNA extraction protocol for green algae (CTAB)3
• Defrost 20 mg/ml Proteinase K (stored in the freezer) and keep it on ice. Add 1/10 volume of 10% PVP to CTAB buffer4.
1. Mark a sets of 2.0 ml microcentrifuge tubes according to the number of samples. Add to each tube 600 µl of DNA extraction buffer (2X CTAB, should be at room temperature when used), 6ul of 20mg/ml Proteinase K5.
2. Grind small amount (50-100 mg dry weight) of clean tissue in liquid nitrogen. Transfer it in the prepared microcentrifuge tube (or grind directly in the tube and then add the buffer).
3. Mix constantly for 60 (120) min at room temperature (e.g. on rotary shaker). 4. Spin for 10min @ top speed (17000 rpm).
All of the following steps should be done under the hood and wide bore tips should be used for all of transfers until precipitation.
3Doyle J.J. & Doyle J.L., 1987 - A rapid isolation procedure for small quantities of fresh leaf tissue.
Phytochemical bulletin 19(1): 11-15.
4Add 1% polyvinylpyrrolidone (PVP) to an aliquot of CTAB buffer just prior to starting extraction. Once
it has been added the shelf life of the buffer is only 2-3 days.
5Proteinase K is heat sensitive and should be handled with care. Store it in the freezer. Before use, thaw
Materials and Methods
34
5. Move supernatant in a tube containing 500 µl of chloroform-isoamyl alcohol (24:1) and mix by inverting for 5 min. Solution should form a milky emulsion. Spin for 5 min @ 17000 rpm. Recover supernatant and move to a new tube.6
6. Repeat last step once or more times if supernatant is not clear.
7. Add 1x the sample volume of ice cold isopropanol (stored in the freezer). Mix gently
and incubate for 1h+ (or leave overnight) at 4°C (or on ice).7 8. Spin for 30min @ top speed at 4 °C.
9. Decant supernatant and wash pellet 3 times in 150ul 70% ethanol (stored in the freezer; pellet should go slightly white).
10. Air dry pellet until fully dry (should go pale/translucent). 11. Redissolve in 50 (100) µl of sterile ddH2O.
DNA templates can be stored at –20ºC.
3.2.2. PCR Profiles and Primers
The mithochondrial COI-5’ region was PCR amplified as described in Saunders and McDevitt (2012), as a DNA barcode for red algae. The plastidial tufA gene was PCR amplified as described in Saunders and Kucera (2010), as a DNA barcode for green algae (Table 2).
Tab. 2: List of used PCR primers (from Saunders and McDevit 2012).
Region Primer name Direction Sequence Taxonomic group
COI-5’
GWSFa forward CAAAYCAYAARGATATYGGAAC Halymeniales, Rhodophyta GwsFn forward TCAACAAAYCAYAAAGATATYGG Rhodophyta
GazF1 forward TCAACAAATCATAAAGATATTGG Rhodophyta GazR1 reverse ACTTCTGGATGTCCAAAAAAYCA Rhodophyta GWSRi reverse GGRTGICCRAARAAYCARAA Rhodophyta GWSRx reverse ACTTCTGGRTGICCRAARAAYCA Rhodophyta
tufA tufAR reverse CCTTCNCGAATMGCRAAWCGC Chlorophyta
tufAGF4 forward GGNGCNGCNCAAATGGAYGG Chlorophyta
6Following centrifugation, you should have three layers: top, aqueous phase; middle, debris and
proteins; bottom, chloroform
7 For low DNA concentrations: higher final concentrations of alcohol, longer precipitations (1 hr to
Materials and Methods
35
3.2.2.1. Polymerase Chain Reaction
Always wear gloves while working with PCR reagents. Work on ice bath.
• Wipe down all working surfaces with H2O and then denatured ethanol.
On the pre-PCR bench top:
• Retrieve DNA templates from freezer and let them defrost. DO NOT work with DNA
templates on the PCR bench-top. Prepare DNA dilution if needed.
• Change gloves before working with PCR reagents.
On the PCR bench top:
• Mark 0.2 ml tubes according to the number of samples plus one for control and a
(0.5-1.5-2.0 ml) centrifuge tube for PCR mix.
• Retrieve the 5X PCR Buffer, MgCl2, dNTPs (working aliquots), PCR primers (working
aliquots) and PCR-H2O (sterile ddH2O) from the freezer. Thaw all tubes, flick and spin
them down and then place on ice.
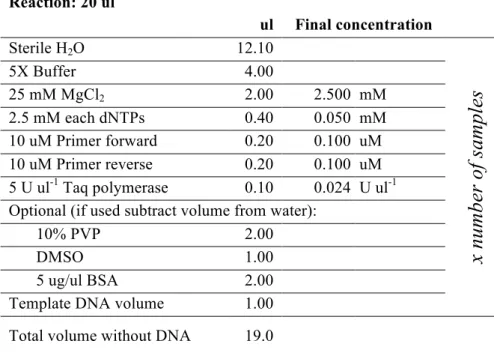
• Prepare PCR mix according to Table 3; retrieve Taq DNA polymerase from freezer just
before use and put it back immediately (note that it does not freeze at -20 °C).
Tab. 3: PCR master mix (Promega).
Reaction: 20 ul ul Final concentration Sterile H2O 12.10
x
nu
m
ber
of
sa
m
pl
es
5X Buffer 4.00 25 mM MgCl2 2.00 2.500 mM 2.5 mM each dNTPs 0.40 0.050 mM 10 uM Primer forward 0.20 0.100 uM 10 uM Primer reverse 0.20 0.100 uM 5 U ul-1 Taq polymerase 0.10 0.024 U ul-1 Optional (if used subtract volume from water):10% PVP 2.00
DMSO 1.00
5 ug/ul BSA 2.00
Template DNA volume 1.00 Total volume without DNA 19.0
Materials and Methods
36
Always add a negative control8. Use positive control only if strictly necessary.
• Flick and spin the mix.
• Pipette 19 ul of the mix into each labelled PCR tube. Close the tubes immediately. • Put back in the freezer all PCR reagents.
On the pre-PCR bench top:
• Flick and spin down DNA templates.
• Add 1 ul of appropriate diluted template to each PCR tube. Spin down any bubbles.
Place tubes into thermo-cycler and start appropriate program (Table 4).
• Return DNA templates to the freezer.
Run diagnostic gel to check quality and quantity of the DNA products. PCR reactions can be stored at –20°C.
Polymerase Chain Reaction recipe Appendix 2.
Tab. 4: PCR cycling protocol used for each marker.
Marker Stage Step Repetitions Hold
COI-5P 1 1. 95° 2’ 1 2 1. 95° 30” 2. 45° 30” 3. 72° 1’ 5 3 1. 95° 30” 2. 46.5° 30” 3. 72° 1’ 35 4 1. 72° 7’ 1 4°C tuf-A 1 1. 94° 4’ 1 2 1. 94° 1’ 2. 45° 30” 3. 72° 1’ 38 4 1. 72° 7’ 1 4°C
3.2.2.2. Agarose gel electrophoresis
Always wear nitrile gloves (not latex!) while working with EtBr.
ü 0.8% agarose gel in TAE, small tray: 0.20 g of agarose
25 ml of TAE 1X (EtBr free)
1 µl of EtBr (stock solution: 10 mg ml-1)
Materials and Methods
37
ü 0.8% agarose gel in TAE, large tray: 0.60 g of agarose
75 ml of TAE 1X (EtBr free)
3 µl of EtBr (stock solution: 10 mg ml-1)
With clean gloves:
• Weight agarose e measure TAE 1X (EtBr free) for gel preparation.
• In a flask combine agarose and buffer (do not touch the flask, it is EtBr
contamined).
• Prepare two stripes of paper tape for the gel tray
With nitrile gloves:
• Close the gel tray with prepared tapes.
• Put the proper comb (check the teeth number in relation to the number of samples) • Melt in a microwave the gel mix in the flask and allow to coolbut not to solidify. • Just before pouring, add 1 µl of EtBr (stock solution: 10 mg ml-1).
• Swirl to completely mix, and pour gel in the tray, sealed with tape and let the gel
harden.
• Put the gel in the electrophoretic chamber, after removing the tape and the comb.
With clean gloves:
• Fill the chamber with TAE 1X9.
• Load DNA sample into gel wells. Always add a line with the proper DNA marker.
With nitrile gloves:
• Connect electrodes and run at 60-80 V10.
• When the run is complete, check it at UV light. Take a picture if needed.
Cathode – DNA – Anode +
Discard gel and running buffer (recycle it a few times before discarding) in EtBr-waste.
9Adding EtBr to the chamber buffer is not necessary; when added, the background fluorescence of the gel
is more uniform.
Materials and Methods
38
Wipe dry UV screen with clean paper tissue11 and discard it in EtBr-waste. Agarose gel electrophoresis recipes Appendix 2.
Sequencing reactions were performed by an external company (Macrogen Europe, The Netherlands).
3.2.3. DNA Barcode Analyses
Specimen data, sequences and used primers were deposited in the Barcode of Life Data Systems (BOLD, http://www.boldsystems.org). Forward and reverse
sequence reads were assembled with the software ChromasPro (v. 1.41, Technelysium Pty Ltd) and multiple sequence alignments were constructed in Seaview (v. 4.3.3, Gouy et al., 2010), including sequences of related taxa downloaded from GenBank (Benson et al., 2017). Sequence alignments were subjected to distance analyses with a Neighbor-Joining algorithm under a K2P model of nucleotide substitution (Kimura, 1980) as performed in PAUP* 4b10 for the Macintosh (Swofford, 2002) to visualize clusters of genetic species.
In addition, COI-5’ sequences were contrasted with BOLD, with the “identify specimen” interface.
A DNA barcoding survey of Ulva in Tunisia
39
4. DNA barcoding shades light on novel records
in the Tunisian red algal flora (submitted
12)
12Submitted to Botanica Marina (IP 1.250)
A DNA barcoding survey of Ulva in Tunisia
120
5. A DNA barcoding survey of Ulva
(Chlorophyta) in Tunisia reveals the presence of
the overlooked alien U. ohnoi (accepted for
publication
13).