This work is licensed under a Creative Commons Attribution – Non-Commercial – No Derivatives 4.0 International License. To view a copy of this license visit http://creativecommons.org/licenses/by-nc-nd/4.0/
Dealing with the vulnerability of the Italian banking system
ELISABETTA MONTANARO andMARIO TONVERONACHI*
The recent crisis has brought heightened attention to non-performing assets. At first it was mainly focused on financial assets, when the crisis was revolving around the pyramid of fictitious liquidity created over a substantially limited amount of US sub-prime mortgage debt. Afterwards, when the financial crisis was followed by the economic one, particularly affecting the weakest EU countries, the rapid increase of non-performing loans (NPLs) took centre stage.
The accumulation and decumulation of the stock of NPLs depends on the relative dynamics of two flows: the velocity with which they are created, net of recoveries, and the velocity of their disposal. The first flow depends on factors that are partly exogenous to the banking system, such as economic growth, and partly endogenous, such as the management of risks. The second flow depends on the magnitude of the losses associated to the management of the NPLs, for which legal, institutional, and tax issues play a significant role, compared to the resources available to banks, linked to their profitability.
The rapid increase of NPLs, due to the long spell of low growth and to a structurally modest and decreasing bank profitability, is an EU-wide phenomenon that particularly affects Italy compared to the other major countries of the euro area. The Italian banking system thus faces the problem of eliminating the legacy of the excess of NPLs, making the ratio of unreserved NPLs to own funds (Net NPL/TC) converge towards a physiological level. Solving this problem is necessary in order to restore the ability of capital to absorb eventual losses and to reduce the negative impact of NPLs on profitability.
* University of Siena, emails: [email protected]; mario.tonveronachi
@unisi.it. Thanks are due to Giuseppe Montesi, two anonymous referees and the editors of the journal for the valuable comments and suggestions on a previous draft of the paper.
Limiting the analysis to the legacy problem would, however, mean to overlook that the accumulation of NPLs comes from bank profitability being increasingly less able to face extraordinary events like the recent crisis. Especially in the Italian case, it shows an inability to deal with the relatively higher structural degree of risk of the reference markets. If we also consider the operational and profitability challenges stemming from technological changes and from the entry of new and keen competitors, ensuring the long-term viability of the European and particularly Italian banks emerges as a crucial issue for bankers and regulatory and supervisory authorities.
Since the main causes, effects, and solutions of NPLs continue to be of a predominantly national character, due to the heterogeneity of the EU banking systems and the incomplete Banking Union, the analysis should focus on single countries.
In what follows, the Italian case is analysed. We start by considering the EU and some peer countries of the euro area as references for a preliminary comparative assessment of the Italian aggregate banking sector; the significance of such assessment is made more pronounced by comparing the EU averages with those of the USA (section 1). The justification for this type of analysis comes from the need to understand if, for crucial aspects, the Italian system has been and continues to be a marked outlier with respect to the EU average, and if the latter is in turn a conspicuous outlier with respect to the best international standards. If aggregate data would confirm this hypothesis, the possible variability hidden by those system averages would hardly justify a soft supervisory approach to the Italian problems. The international comparison confirms that the Italian system presents relevant negative anomalies, which can be ascribed to the impact that the economic, institutional and managerial factors mentioned above have exerted and continue to exert on bank profitability and capitalisation.
In order to go beyond what aggregate data suggest, and to verify if they reflect either the performance of few bad apples or more widespread problems, we have built a large sample of 410 Italian domestic credit institutions, banks groups and independent banks,
and submitted them to two exercises, a stress test devoted to the convergence of Net NPL/TC towards the EU average (section 2), and a viability test (section 3) aimed at ascertaining whether only solving the NPL overhang would leave relevant fragilities unresolved. The results of the two tests confirm that the NPL legacy and the viability problems are widespread phenomena. More importantly, they show that solving the first does not overcome the unviability of the current bank business models, characterised by wide operational inefficiencies. The solution to both problems requires a systemic approach, timely interventions, and significant changes in the current regulatory and supervisory approach (section 4). The article concludes with a synthetic summing up of our results, after briefly comparing our proposal with contributions recently put forward on the NPL overhang.
1. A comparative assessment of the vulnerability of the Italian banking system
The international debate concerning the vulnerability of Italian banks, and its impact on the credibility of the Banking Union and its rules, has seen a rapid escalation in recent years s (Gros and de Groen, 2016; Véron, 2016a and 2016b; Beck, 2017; Dombret, 2017). The policy and supervisory stance adopted when applying the new rules on crisis management and state aid to Italian banks is considered responsible for the difficulties to solve the NPL problem, to the extent that Italian banks might become a systemic risk for the entire euro area. A different narrative is proposed by the Italian supervisors. Although being the product of the gravest recession that the country experienced since the Second World War, the NPLs legacy problem seriously affects only a reduced number of banks; solving their excess of toxic assets would leave the system free of their threat. Furthermore, such solution had been rendered more difficult by the rigidity with which the new recovery and resolution procedures were applied, especially inside the banking union. “Italy is paying the
highest price because it has been cornered by the new approach -no more bail-outs, only bail-in – just when its banks’ NPLs were piling up owing the gravity of the double-digit recession, heightened in some case by mismanagement and even outright criminal behaviour” (Rossi, 2017, p. 4).
However, both positions fail to recognize that the vulnerability of the Italian banking sector precedes the recent crisis and that it is caused not only by cyclical factors, but predominantly by structural ones, which risk being underestimated by focusing on NPLs and the legacy of the crisis.
The comparison between aggregate data of Italian and EU banks helps understand the scale and nature of the specific fragilities of the former. Two important caveats must be borne in mind. First, the aggregate analysis does not detect the variability within the banking sector of each country, which might be significant despite common macroeconomic and institutional conditions. For Italy, the disaggregated analysis presented in sections 2 and 3 permits to overcome this limit. Second, we must ascertain that the comparison with Europe allows to detect the effective divergence of the Italian banking system with respect to the best international standards.1
Almost ten years after the outbreak of the crisis, EU banks still present significant fragilities and their low profitability remains a source of concern for public authorities and markets (IMF, 2017a; EBA, 2016; ESRB, 2016). It follows that if, as we shall see, Italy is an outlier with respect to the EU, its convergence towards the EU average would certainly be a significant progress, although not enough to move close to the best international standards.
As shown in figure 1, the comparison of the post-crisis EU and US profitability paths is enlightening.2
1 Following the IMF’s Financial Soundness Indicators, we select the United States as the
representative country for the best international standards.
2 The following identities and definitions referred to the main components of ROA and
ROE are presented in order to clarify the terminology utilised in the present work. Total assets = TA; Net interest margin/TA + Net non-interest margin/TA = Operating revenues/TA; Pre-provision operating profit/TA = PPOP/TA = Operating
Figure 1 – Determinants of ROE in the EU and US
Note: from now on, data always refer to consolidated financial statements of domestic banks. Sources: for the EU, European Central Bank (ECB), Statistical Data Warehouse; for the USA, Federal Deposit Insurance Corporation (FDIC), All Insured Banks.
Although the effects of the crisis have been more immediate and violent for the US banks, their profitability soon began to increase regaining pre-crisis levels within few years. Instead, due to a ROA roughly one fifth of that of US banks, the EU banking system is not still able to generate a ROE in line with what markets require, despite an average leverage level more than two times that of US banks (Constâncio, 2016). The decrease of income streams in the post-crisis period, due to the shrinking of the more profitable loans, low interest rates and the flattening of the yield curve, has not been adequately compensated by the reduction of operational costs.
The low bank profitability also explains why Europe encountered more difficulties in adopting effective strategies for the timely solution
revenues/TA – Total operating expenses/TA; ROA = Profit/TA = PPOP/TA – Provisions/TA – Tax expenses/TA; Leverage = L = TA/Total equity; ROE = ROA * L.
of the huge weight of bad loans inherited from the crisis. At the end of 2016, NPLs amounted to over a trillion euro, around 6.7% of EU nominal GDP, with the average ratio of NPLs to gross loans (NPL ratio) at 5.1%, roughly three times higher than that of the USA. However, the average value of the NPL ratio does not give a faithful picture of the problem because of the large variation across EU countries, ranging from 1% to 46% (EBA, 2017c). In the six currently most affected euro countries,3 among which Italy stands as the sole major one, the NPL
ratio is higher than 10% and shows a slow downward adjustment with respect to the 2014 peak. For this aspect, too, the comparison between the EU and US is interesting (figure 2).
From 2007 to 2009, the NPL ratio increased in both areas. The trends began to diverge starting from 2010, with a rapid decrease in the US while EU banks continued to accumulate NPLs.4 Much of this
divergence is due to the stricter rules that US supervisors impose on banks for promptly recognising loan losses by writing-off uncollectable bad loans after six months (Aiyar et al., 2016, p. 83).5
This requirement limits the banks’ managerial discretion, imposing higher costs of provisioning directed at matching the increase of the NPL ratio with the increase of loan loss reserves. The result has been to accelerate the cleaning up of the balance sheets of US banks, removing the incentives to delay the restructuration or liquidation of impaired loans. However, it is easier to impose such harsh measures where, as in the US, banks start with a high coverage ratio (loan loss reserves/gross impaired loans) and good profitability. On the contrary,
3 Cyprus, Greece, Ireland, Italy, Portugal, and Slovenia (see EBA, 2017c).
4 The NPL ratio of US banks, calculated from FDIC data, underestimates the real
dimension of credit deterioration produced by the 2008 crisis. In particular, FDIC data do not include the large share of family mortgage in delinquency status held by the two government sponsored enterprises Fannie Mae and Freddy Mac, which in 2008 owned or guaranteed about 40% of all US mortgages.
5 According to Aiyar et al. (2016, p. 57), both the average write-off rates and
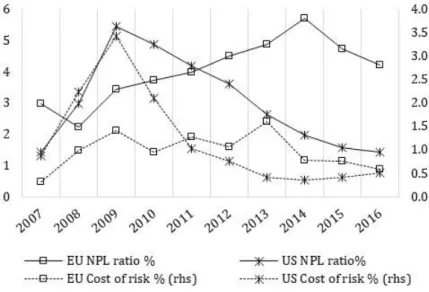
Figure 2 – NPL ratio and cost of risk in the EU and US (%)6
Note: the missing 2014 value is estimated by the ECB.
Sources: for EU banks, ECB, Statistical Data Warehouse; for the USA, FDIC, All Insured Banks. in Europe the low profitability has restricted banks’ ability to cover the higher cost of risk with higher provisioning and to timely recognise the loss with appropriate write-offs.7 Fear of the unsustainability of a
more conservative provisioning has held back sharper supervisory interventions just in countries with more serious legacy problems (Véron, 2016a).8 The EU under-provisioning is highlighted by the very
6 The EU for NPL ratio are approximated by the ratio of Gross non-performing debt
instruments to Total gross debt instruments. In the years under investigation, the EU indicator underestimates the NPL ratio. The cost of risk is the ratio of Provisions for loan losses/Total loans.
7 In many European countries, limits to tax deductibility of loan loss provisions and
write-offs are other relevant obstacles to the resolution of NPLs.
8 According to a study produced by the ECB (2017a), the majority of supervisors in EU
countries with high NPLs did not issue binding rules on write-offs, or, in general, on adequate provisioning. EU banks’ provisioning practices follow the International Accounting Standards Board approach, which “could result in insufficient and delayed provisioning and could therefore be an obstacle to adequate NPL measurement within
low correlation between the NPL ratio and the cost of provisioning (0.16), especially when compared with the US one (0.76) (see figure 2). This largely explains why the EU NPL problem has become chronic and difficult to solve.9
The main fragilities exhibited by the above comparison of the European and US banking systems are accentuated in the Italian case, thus reinforcing their influence and constraints on the effectiveness of regulation and supervision and on the viability of the banking business models. One unquestionable explanation of the greater weaknesses of the Italian banking system is the fact that the Italian economy was, among the major EU countries, the hardest hit by the recent long recession, especially in the period 2009-2013. Nevertheless, the impact of the crisis has been amplified by elements of structural vulnerability rooted in the past. This is particularly true for the two main profiles from which the solvency and profitability gaps with respect to the EU average derives: the overhang of NPLs and high operating costs.
loan portfolios” (ibid. p. 8). The recent ECB (2017b) proposed addendum to the NPL guidelines marks a relevant change in the direction advocated in the present paper, even if adopting long terms - the write-off of unsecured NPLs within two years and within seven years of secured ones – and applying the rule to loans that become non-performing starting from January 2018.
9 Only in 2017, when the goal of reducing the high levels of NPLs held by European
banks became a political priority, the European authorities recognised that European banks have less regulatory incentives to deal proactively with NPLs compared to US banks. While the CRD IV (Directive 2013/36/EU, Article 104) and the Single Supervisory Mechanism (SSM) Regulation (Article 16) explicitly confer to supervisors the powers to require institutions to adopt adequate provisioning policies, the European framework of accounting standards does not allow supervisors to intervene on accounting rules, thus limiting the usability of those powers. The Report of the Subgroup on Non-Performing Loans of the Council’s Financial Services Committee (Council of the European Union 2017) has proposed different options for addressing “the possible disconnect between the accounting and the desired prudential outcomes”, among which empowering supervisors with the capacity to “enforce accounting adjustments as regards NPL recognition, provisioning and write-offs” (§ 186, p. 52; § 197-201, pp. 55-56). See also the previous footnote 8 on ECB interventions in the sphere of the SSM.
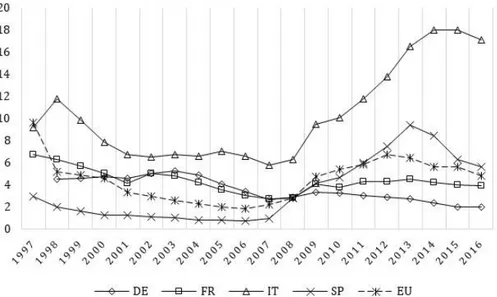
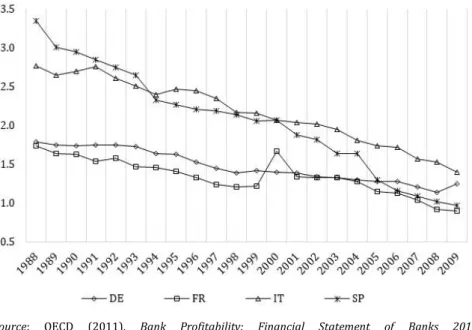
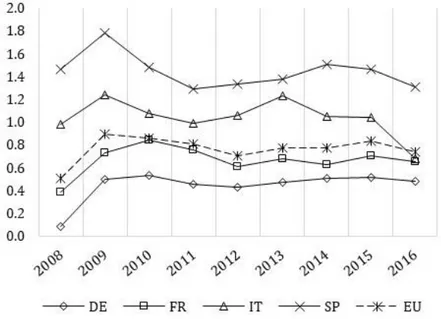
The heavy load of the NPL legacy, about 21% of nominal GDP in 2016 (IMF, 2017b, p. 4), is strongly connected to dependence of Italian banks on retail credit, which constitutes their prevalent business model, and on the fragility of the Italian economy (Lusignani and Onado, 2014). The small size of non-financial firms, their excessive leverage and the underdevelopment of its capital market have contributed to maintain the quantitative centrality of banks in financing the economy. This largely explains why Italian recessions are characterized by the strong growth of the NPL ratio and by the worsening of bank profitability (Albertazzi et al., 2016). Figure 3 shows that NPLs have always been a more significant problem for the Italian banks than for the banks of the other main EU countries.10
The post-crisis dynamics of the NPL ratio is also significantly due to the lengthy and inefficient Italian judicial system to resolve insolvency and to enforce the repossession of collaterals. In addition, up to 2015 the taxation system disincentivized banks from operating adequate provisioning and write-offs (Jassaud and Kang, 2015).11 However,
despite the increasing competitive pressure (Ciocca, 2005, p. 22 ff.) and the relevant restructuring and consolidation started in the mid- 1990s (Focarelli et al., 2004; Montanaro and Tonveronachi, 2006), Italian banks did not improve their risk management, at least not to the extent that was required for decreasing their vulnerability with respect to structural and cyclical factors. Starting in 2009, when the recession and the decline in the supply of credit began their course, the divergence of the NPL ratio between Italy and the EU average has been dramatically expanding.
10 Caution is necessary when comparing NPL ratios at the international level because
NPLs are not homogeneously defined. Only recently, the BCBS (2017) issued the harmonised definition of non-performing exposures and forbearance.
11 The reforms adopted in Italy in 2015 and 2016 should accelerate the timing for
recovery of credit and facilitate the processes of foreclosure, although their full effects will be felt only in the medium-long term (Marcucci et al.,2015). Thanks to 2015 tax reform, Italian banks are now allowed to fully deduct loan losses provisions from taxable income in the year for which they are accounted for, instead of having to spread deductions over five years (it was eighteen years until 2013).
Figure 3 – NPL ratio (%)
Source: World Bank, World Development Indicators.
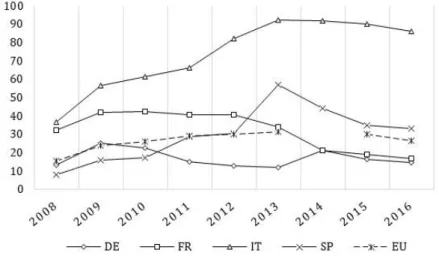
A positive signal is coming from the recent decrease of the NPL ratio, resulting from both the lower inflow of impaired loans due to the economic recovery, and to the higher outflow in the form of sales to the market made possible by the higher coverage ratios (Bank of Italy, 2017a; Panetta, 2017). Nevertheless, to perceive the effective dimension of the bank vulnerability due to the NPL dynamics, more significant than the NPL ratio is the ratio of net NPLs on supervisory capital (Net NPL/TC), which measures the risk that eventual losses on uncovered NPL will erode the capital.12 Figure 4 shows the dramatic
12 This indicator is akin to the Texas ratio, which compares gross NPLs to the resources
available to cover losses, i.e. capital and reserves. Even if part of the losses could be also covered by the guarantees, which represent a further cushion of safety, these guarantees normally lose value in periods of crisis for loans to non-financial firms, which produce the highest share of NPL in Italy. In addition, in Italy the difficulty to rapidly enforce and liquidate the guarantees is still particularly high in comparison to most EU countries (Angeloni, 2016).
divergence of Italy with respect to the EU average and some peer countries for this indicator.13
Figure 4 – Net non-performing debt instruments/total capital (%)
Note: For the EU, the 2014 value is missing. Source: ECB, Statistical Data Warehouse.
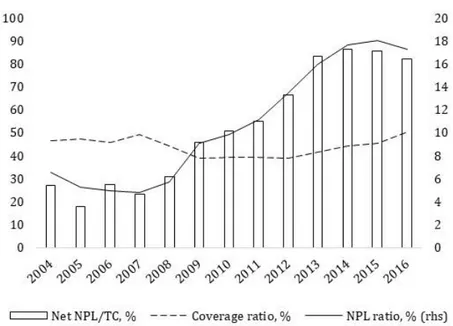
In Italy, the share of own funds in excess of unexpected losses on NPLs was, in 2016, lower than 15%, compared to a EU average of 75%. As it emerges with more detail from figure 5, the higher vulnerability is the result not only of an NPL ratio higher than the EU average, but also of the practice of under-provisioning adopted by Italian banks during the worst years of the crisis as a consequence of their low profitability and capitalisation.14 The coverage ratio begins to increase
only in 2013, in view of the ECB asset quality review of the subsequent
13 As already explained in footnote 4, the ECB statistics include in the indicator
non-performing debt instruments, not just loans. Furthermore, they cover only a sample of domestic banks. Therefore, these values are not perfectly comparable with those of figure 5, built on NPL data from the Bank of Italy.
14 The correlation between the coverage ratio and the NPL ratio is negative and not
year, hence thanks to a more determined, although late, action by supervisory authorities.15
Figure 5 – Italy: NPLs and capital vulnerability
Source: Bank of Italy, Annual Relations.
Even if the coverage ratio has reached in recent years levels somewhat higher than the EU average (Panetta, 2017), the Italian vulnerability gap with the EU, due to NPLs, did not decrease significantly because during the same period its rate of growth of capitalisation was lower than the EU average. This partly derives from having benefited from limited public aid, while domestic banks of
15 At least since 2013 the IMF informed that the coverage ratio of the Italian banks was
inadequate and that the necessary substantial increase of provisioning was a difficult challenge “given the continuing deterioration of asset quality and the Italian banks’ low profitability” (IMF, 2013, pp. 13-14).
other EU countries received more massive aid in the period 2008-2015.16 The lower capital ratios of the Italian banks also reflect the
higher RWA density17 due to the high weight of NPLs and, more
recently, the large losses suffered when pre-provision operating profits were not enough to cover provisions.
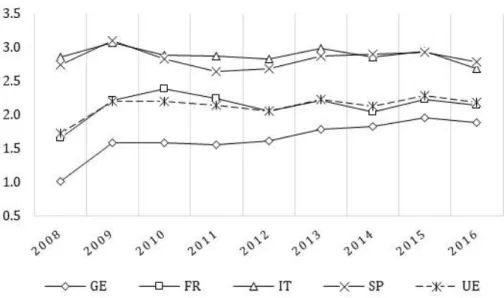
An explanation of the causes responsible of the deficient profitability of the Italian banking system is then necessary. The positive gap of the Italian operating revenues/TA in comparison to the averages of the EU and less risky countries, such as Germany and France, remained more or less stable during the post crisis period (figure 6).
The almost constant Italian unitary operating revenues are, however, the result of the opposite paths of its two components, unitary interest and non-interest margins. Starting from 2008, the net advantage of Italian banks for the interest margin, which was the main component of its profitability, has progressively decreased in comparison with the other main EU countries, mainly due to the strong decrease of the spread between the return on loans and the cost of funding (Albertazzi et al., 2015). This trend is theoretically unexpected because it occurred in a period of increased risks on loans. Plausible explanations of the widespread under-pricing of risk are an excess of price-competition and/or the preference for credit rationing with respect to rate increases, which would have further worsened the
16 In the period 2008-2015 EU banks received 654.2 billion euro of state aid for
recapitalization and impaired asset measures, of which 144 billion in Germany, 140 billion in the UK, 94.7 billion in Spain (European Commission 2016). In Italy, public intervention has been much lower, equal to 11.8 billion. According to Bank of Italy, at the end of 2011, when the NPL ratio was reaching 12%, “[…] ‘a system wide’ intervention […], involving substantial public funds along the lines of what occurred in other countries, appeared neither justified nor feasible. The increase in bad loans was not concentrated in any specific sector of the economy; the macroeconomic predictions made in the course of 2012 were much more favourable than results actually achieved. As the sovereign debt market strains grew more acute, government intervention on non-performing loans appeared incompatible with the state of public finance” (Bank of Italy, 2017a, p. 12).
financial conditions of borrowers and consequently the volume of NPLs. The low profitability of lending explains the increasing reliance of Italian banks on fees and commissions. The revenues diversification strategy, which often supervisors suggest as the most effective to strengthen profitability (Constâncio, 2017a; Dombret, 2017b),18 was
aggressively adopted by the Italian banks, managing in this way to compensate the contraction of the interest margin.
Figure 6 – Operating revenues/TA (%)
Source: ECB, Statistical Data Warehouse.
However, the stable advantage for operative revenues was in the same period contrasted by the efficiency deficit, which, as shown by
18 Experience shows that this strategy does not protect from ample fluctuations with
changing macroeconomic scenarios (Kok et al., 2016). The sharp contraction of non-interest income of Italian banks in 2016 in comparison to the 2015 peak is an example.
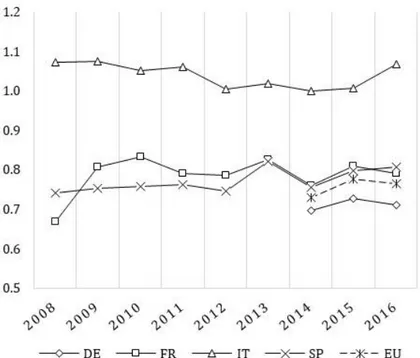
figure 7 has heavily affected the structural fragility of the Italian banking system for a long time.19
Figure 7 – Total operating expenses/TA (%)
Source: OECD (2011), Bank Profitability: Financial Statement of Banks 2010,
http://dx.doi.org/10.1787/bank_fin-2010-en-fr
In the absence of an increase in revenues, the generation of a profitability capable of hedging the recent increase of the costs of risk would have required of Italian banks to substantially reduce unitary operating expenses by improving the productivity of labour and of the branch network. As shown by figures 8 and 9, this did not happen and, on the contrary, the gap with respect to the EU and other main countries recently widened.
19 OCDE data on operative expenses are not perfectly comparable with those of the
ECB utilized in figure 8. For Italy, in particular, OCDE data refer to non-consolidated balance sheets of domestic and foreign banks, while ECB data refer to consolidated balance sheets for a sample of domestic banks.
Figure 8 – Staff expenditure/TA (%)
Note: Data of Staff expenditure/TA for Germany prior to 2014 are patently anomalous (they
would range from 0.25 to 0.32 in the period 2008-2013, while they range from 0.69 to 0.72 in the remaining period). Given that this anomaly strongly affects the EU average, for Germany and the EU both indicators are shown only since 2014.
Source: ECB, Statistical Data Warehouse.
The rationalisation of the branch network and the decrease of employees that started in 2008, often in conjunction with deleveraging processes and the reduction of non-core assets, do not yet show significant effects on unitary costs, probably because they are not associated with a rise in productivity. If productivity does not increase for lack of professionality and technological investments, a reduction in the number of employees may lead to a reduction of total assets more accentuated than the reduction of staff expenditure. A similar argument applies to the branch network. In general, beyond
Figure 9 – Total operating expenses/TA (%)
Source: ECB, Statistical Data Warehouse.
beyond not being immediate, efficiency gains coming from restructuring measures require changes in operating models, improvements in multichannel distribution structures and in information technology, which normally entail additional short-term costs. While the recent widening of the Italian gap with respect to the EU might come from the more severe effects of the recent crisis, the permanence of the observed structural gap would limit the ability of the Italian banks to adapt their business models, making them more vulnerable to risks and to the competitive challenges of the new financial environment. The increase of regulatory costs in the post-crisis period, which penalises smaller banks because largely size-invariant, have made even more relevant the problems of structural inefficiency and the pressure exercised by the shadow banking and the
innovative intermediation circuits, such as Fintech firms, on revenues per unit of assets.
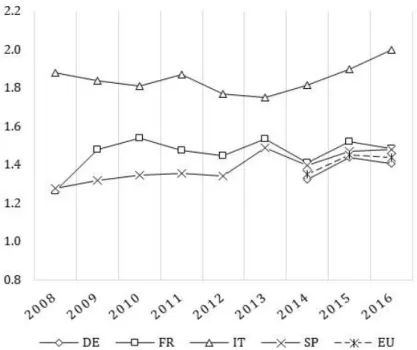
The efficiency gap has then eroded the advantages coming from unitary revenues that traditionally benefited the Italian banking system. With operating revenues/TA in line with Spain, the highest unitary operating expenses of the Italian system among the countries of our sample have increasingly pushed its PPOP/TA significantly closer to much less risky countries (figure 10).20
Figure 10 – Pre-provision operating profit/TA (%)
Note: The EU 2014 value is an ECB estimation. Source: ECB, Statistical Data Warehouse.
20 According to the Bank of Italy (2017c, p. 170), the sharp 2016 decline of PPOP/TA
is imputable to non-recurring provisions incurred by the largest banks for costs related to voluntary redundancy incentive plans (Bank of Italy, 2017c, p. 170). This might explain the significant 2016 increase of staff expenditure/TA of figure 8, but hardly the upward trend of total operating expenditure/TA experienced since 2014 as shown in figure 9.
The long-term comparatively higher Italian NPL ratio shown in figure 3 suggests that Italian banks suffer from a structural deficit of PPOP/TA when considered in relation to the risk of their reference market. The considerable increase of credit losses produced by the recent crisis has highlighted this deficit and the resulting vicious loop between the increase of NPLs and the decrease of PPOP/TA, which was aggravated by the concurrent worsening of costs. The level of PPOP/TA should cover the unitary cost of risk and a ROA capable of generating a capital return in line with what the market requires, given regulatory and operative limit to leverage. Figure 11 shows that starting from 2011, PPOP could not even just cover charges for impairment and provision, thus producing capital losses and the rapid increase of Net NPL/TC (figure 5).
Figure 11 – Pre-provision operating profit/provisions
Note: The EU 2014 value is missing. For Germany, the values for the period 2008-2014 refer only
to impairments and the value for 2011 (11.86) is omitted because patently anomalous.
As a consequence, in the years that followed the outbreak of the crisis the Italian ROA was almost always in negative territory, even without a manifest systemic crisis as, for example, happened in Spain (figure 12).
The dynamics of ROA manifestly reflects the structural inability of the Italian banking system to face the comparatively higher risk of their market. To a large extent this also explains the difficulty of more incisive interventions by banks and their supervisors to clean banks’ balance sheet from the excess of NPLs.
Figure 12 – ROA (%)
2. Dealing with the legacy problem
In the previous section we focused on two indicators of bank’s fragility. The first, the ratio of net NPLs on own funds (Net NPL/TC), mainly refers to the legacy of the recent crisis. However, the ability to quickly adjust this fragility indicator to a normal level also measures the ability to withstand new future crises. The second, the ratio of pre-provision operating profit on total asset (PPOP/TA), refers to the long-term viability of banks, being the amount of resources that are available for internal growth once the cost of risks and the cost of capital are met. On both accounts, EU banks suffer from a much higher structural fragility than the US ones, which have shown the ability to quickly absorb the effects of the crisis and go back to their less fragile configuration.
In managing ex ante and ex post credit risks, Italian banks are among the more serious outliers in the EU context, not being able to price risks consistently with a riskier environment than that of their peers. The recent crisis has just exposed a pre-existing long-term problem, that is the weakness of the Italian banks to cope with the weaknesses of their domestic market.
This is what the aggregate data of the previous section have shown. The above suggestion of structural problems pervading the Italian banking system excludes that its performance is due to just few bad apples. A proprietary database that includes a large sample of Italian banks helps to verify our hypothesis. The sample covers the 90% of 2016 Bank of Italy’s data for domestic banks’ total assets. The coverage for bank typology is shown in table 1.21
21 Based on Bureau van Dijk (BVD) Orbis Bank Focus, the database includes
consolidated information on 410 domestic banking groups and independent banks, which do not include subsidiaries and branches of foreign banks. This exclusion is justified by our attention to recapitalisation processes potentially in charge of the Italian government. In any case, their introduction into the sample would not change the substance of the results presented in the present and next sections. We have excluded from the sample Banca Monte dei Paschi, Banca Popolare di Vicenza and Veneto Banca, whose crisis has been recently dealt with and about which we do not
Table 1 – Sample’s coverage according to bank typology
Bank typology Number the sector’s TA as % of
total Joint stock companies and Banche popolari,
all termed OBs 94 89.6
BCCs (cooperative banks) 271
95.5 Raiffeisen banks, RBs (cooperative banks) 45
Figure 13 shows how the banks in the sample are positioned with respect to the EU averages for Net NPL/TC and PPOP/TA for the year 2016.22
Figure 13 confirms that the overwhelming majority of Italian banks face a serious legacy problem. Furthermore, the banks positioned in the NW quadrant add deficiency of PPOP/TA to the legacy problem. The seriousness of the conditions of Italian banks is accentuated if we consider that the two EU averages significantly diverge from the US ones, amounting to 0.59% for Net NPL/TC and to 1.74% for PPOP/TA.
Figure 14, which substitutes the EU averages of figure 13 with the US ones, shows that most Italian banks are placed in the NW quadrant, while several banks without an appreciable legacy problem show a profitability gap.
have enough updated information to perform our tests. The entire list of banks included in the sample is available on request.
22 The EU averages for the aggregate of domestic banks are respectively 26% and
Figure 13 – Percentage deviations of Net NPL/TC and PPOP/TA from
EU averages, 2016
Sources: BVD, Orbis Bank Focus and ECB, Statistical Data Warehouse.
From the previous figures, we also deduce that something deeply wrong lies at the heart of the Basel methods for measuring risk-sensitive capital requirements. No banks, even those with Net NPL/TC higher than 100%, show regulatory capital deficiency under Pillar 1.
Measuring, as we have done, the profitability-viability based on the data of just one year could seem inappropriate. We will go back to this issue in the next section. However, it is clear from the past trend that the majority of Italian banks lack the perspective cash flow necessary to deal with their NPL problem in a reasonable time horizon. This means that a shock therapy rather than a gradual approach is needed.
Figure 14 – Percentage deviations of Net NPLs/TC and PPOP/TA from
US averages, 2016
Sources: BVD, Orbis Bank Focus and FDIC.
The Net NPL/TC and PPOP/TA ratios are the two critical vulnerability variables on which we build the two exercises. Postponing the viability test based on PPOP/TA to the next section, in the present section we propose a stress test aimed at exploring the consequences of instantly adjusting banks’ balance-sheet applying two EU standards related to NPLs. In accordance with the provisions of Basel Core Principles23 and EU supervisory rules (CRD IV and SSM
23 The Basel Core Principles for Effective Banking Supervision (BCBS, 2012, p. 45,
footnote 59) explicitly point out that “[i]n assessing the adequacy of a bank’s capital levels in light of its risk profile, the supervisor critically focuses, among other things, on […] the adequacy of provisions and reserves to cover losses expected on its exposures […]”. Therefore, “[t]he supervisors determines that banks have appropriate policies and processes to ensure that provisions and write-offs are timely and reflect realistic repayment and recovery expectations, taking into account market and macroeconomic conditions” (ibid., Principle 18, Essential criteria 4, p. 48).
regulation), the rationale of the proposal is that supervisors should be empowered to enforce accounting adjustments regarding NPL write-offs in order to avoid overstatements of bank’s own funds and the risks for financial stability arising from a large number of banks overburdened by toxic assets. The above mentioned new stance of the ECB (2017b) confirms that, if willing, supervisors are empowered with this instrument.
The entire sample of domestic banks is divided in three sectors, including joint stock banks and Banche Popolari (OBs), credit cooperative banks (BCCs), and Raiffeisen banks (RBs), which are cooperative banks whose reference territory are the autonomous provinces of Bolzano and Trento.24 The two subsets of cooperative
banks need special attention. A recent reform25 obliges cooperative
banks to consolidate in a group, with a central institution as the parent company. BCCs are entitled to choose between ICCREA Banca or Cassa Centrale Banca; RBs may select either Cassa Centrale Raiffeisen of Alto Adige or one of the other two groups.26 Differently from traditional
banking groups, where the holding company own the subsidiaries, in the cooperative group the affiliated banks own the central institution. One of the most relevant feature of the reform is the relationship between the parent company and the affiliated banks. Linked by the so-called “cohesion contract”, the parent company and the consolidated banks are committed to provide reciprocal guarantee for each other’s liabilities. This implies that if an affiliated bank must be
24 From the BCC and RB sectors the three central institutions are excluded for the
reasons specified below and in footnote 28.
25 See law no. 49/2016 and the secondary regulation issued by the Bank of Italy on 2
November 2016 (“Gruppo Bancario Cooperativo”). For a synthetic analysis of the reform, see Bank of Italy (2016, pp. 44-45).
26 BCCs with assets higher than 2 billion euro could have chosen to become joint stock
companies. Being this option very costly, only BCC Cambiano decided to utilise it, changing into Banca Cambiano S.p.A. The Central Institutions that will be authorized to become the parent company of a cooperative banking group will be incorporated as joint stock companies in order to improve the access of cooperative banks to the capital market. However, the majority of voting rights must be held by the affiliated banks.
recapitalised, the parent company is authorised to utilise the capital surplus of the other member banks under a proportionality criterion. If the required funds exceed this surplus, the parent company can tap the market for additional resources. Thanks to the intrusive power on strategic direction and risk management conferred to the parent company, the consolidation of cooperative banks is intended not only to remedy possible under-capitalization problems, but also to improve the efficiency and structural rigidities of these small and micro-banks, reducing the role of local vested interests and enhancing their governance (Weber, 2017).27 Not yet being available the lists of the
membership of the parent companies, table 2 groups the cooperative banks into the BCC and RB sectors.28
Table 2 – Indicators for the sample and the three sectors, 2016
Indicators Sample OBs BCCs RBs
Number of banks 410 94 271 45
Total assets (billion euro) 2,713 2,505 194 14
TA as % of TA of the sample 100 92.3 7.2 0.5 Net NPL/TC (%) 64.8 65.0 67.3 24.1 NPL ratio (%) 15.9 15.6 19.1 8.4 Coverage ratio (%) 54.0 54.4 50.4 42.0 CET1 ratio (%) 11.7 11.2 16.6 17.9 Tier 1 ratio (%) 12.3 11.8 16.7 17.9 TC ratio (%) 14.5 14.3 17.0 18.1
Source: BVD, Orbis Bank Focus.
27 This explains why the Banche popolari are considered into the OB sector: not yet
transformed into joint stock companies, they remain a special sort of mutual banks with a central institution lacking the functions conferred to the new cooperative groups.
28 Due to the incoming process that is profoundly changing the nature, operations, and
balance sheets of the three central institutions, they are excluded from the data of the respective sectors. In any case, no need of recapitalisation appears when applying our exercise to their current configuration.
Table 2 shows that although it has decreased with respect to the 2014 peak, the Net NPL/TC ratio remains at alarmingly high levels, especially for OBs and BCCs. At a first glance, it is already evident that adjusting that ratio to less risky prudential levels would strongly affect their capitalisation. The final target of the NPL stress test exercise, which is fully reached with the viability test presented in the next section, is to make Net NPL/TC converge towards the 26% level, which represents the EU average as measured by the ECB for a large sample of EU banks.
The NPL stress test exercise that we propose is a two stages process. The first stage is the immediate adjustment of the balance sheet adopting the two adjustment factors shown in the table 3, whose levels come from the EU 2016 averages.29
Table 3 – Target, adjustment factors and constraints of
the NPL stress test
% Final target Adjustment
factors Regulatory constraints Net NPL/TC ≤ 26 NPL ratio 4.5 Coverage ratio 44 CET1 ratio 6.5 Tier 1 ratio 8 TC ratio 10
Although the adjustment is made with an NPL ratio roughly a fourth of the 2016 Italian ratio, its level is significantly higher than the best international standards (see previous section). The new coverage
29 The value of the NPL ratio is the EU average (5.1%) net of countries with a ratio
above 10%. Given that the NPL adjustment factor is applied to ex ante values, its post-test level does not exactly coincide with the reference 4.5% because the amount of gross loans is modified as a consequence of the adjustment. This is not relevant for our analysis which focuses on the level of Net NPL/TC as the final target.
ratio is six percentage points below the Italian one, and much lower than its international standard.
Furthermore, the two immediate adjustment factors constitute a weaker constraint than the final target. As we shall see below, one of the results of the NPL exercise is that several banks present a post-test level of Net NPL/TC higher than the 26% final target, especially for those that fail the test and need to be recapitalised. As we explain in the next section, the second stage of the NPL test forms part of the viability test, which includes five years of full convergence to the final 26% target level of Net NPL/TC. In other words, to be admitted to the recapitalisation, the banks that fail the stress test must show to be viable also by incorporating the costs of this convergence.
Although the adjustment due to the NPL ratio may appear drastic, the two adjustment factors fall well short of international standards. A more severe intervention would have required higher additions of capital, private and public, rendered rather problematic by economic and political reasons. Furthermore, as we will see in the next section, the second leg of our proposal is a more rigid viability test focused on the generation of internal resources as the crucial factor for reaching long-term systemic resilience.
The adjustment process is formally described in Appendix 1. The purpose of the exercise is to compute, for each bank of the sample, the supervisory capital ratios resulting from adjusting its NPL ratio and coverage ratio to the values indicated in table 3. If the post-adjustment capitalisation is lower than the regulatory constraints specified in the same table, we compute the amount of the capital shortfall. First, we compute the new level of NPLs applying the NPL adjustment ratio equal to 4.5%, and its difference with respect to the current level. The excess of NPLs is divided in two parts. A 75% slice is written off30 and
30 Worth to note, the write-off of NPLs does not have to be preceded by the exhaustion
of legal insolvency proceedings and by giving up contractual rights on these loans. A write-off “does not mean that the loan has absolutely no recovery or salvage value, but rather that is not practical or desirable to defer writing off this essentially worthless asset even though partial recovery may be realized in the future.” (Gaston and Song, 2014, p. 29)
the remaining 25% goes to constitute what we call the capital bonus. The rationale of this criterion is that the excess of NPLs has a potential level of recovery that should not be eliminated from the evaluation of asset, hence of the capital. The larger share subject to the write-off would be mainly composed of bad loan and unrecoverable, unsecured vintage substandard loans. The smaller share, constituting the capital bonus, would include NPLs with high probability of full recovery.31
Each bank would manage the 75% share as it finds convenient (internally or by selling it to the market); the remaining share would be managed internally and the supervisory authority would accept to add it to CET1 for no more than five years, hence the term capital bonus. Therefore, while the adjustment using the selected EU averages is immediate, banks have a grace period for recovering the best part of their NPLs.
Second, we compute the excess of loan loss reserves, if any, at the new 44% coverage ratio and at the new, lower, level of NPLs. The loss is then the difference between the 75% slice of NPLs and the excess reserves. To arrive at the effect of the loss on regulatory capital ratios, we then compute the new level of risk weighted assets (RWA) assuming an average risk weight of 100% for the excess of NPL net of the excess reserves.32 The difference between the loss and the capital
31 The capital bonus measures the amount of (potential) gross losses that supervisors
accept not to subtract from the current CET1 because of their high probability of being recovered, and are therefore added to CET1 after the capital adjustment described in the text. The percentage of 25% is quite conservative because, according to analysis of Bank of Italy (Panetta, 2017), of the 173 billion euro of the 2016 net NPLs, 92 billion are loans with high probability of going back to the performing status, especially with the expected consolidation of the economic recovery. If the evaluation by the Bank of Italy is correct, the rate of recovery from the whole excess of NPLs would exceed 25%, thus helping banks that should be recapitalised to pay back the funds received from the government. One of the objectives of the temporary nature of the capital bonus is to incentivize banks to utilise the new out-of-court restructuring tools introduced in Italy with the 2015 reforms, whose aim is promoting early solutions of borrowers’ financial difficulties and preventing their irreversible insolvency (Marcucci et al., 2015).
32 Due to the lack of data necessary to compute the changes of RWA for the banks that
bonus, both divided for RWA, is added to the existing regulatory capital ratios. If the resulting new capital ratios do not comply with the regulatory constraints shown in table 3.3, the stress test is failed and corrective recapitalisation should be forced on the bank. We compute the amount of capital shortfall as the higher of the three possible shortfalls. It is worth noting that the capitalisation thresholds that we propose for the stress test are higher than the minima dictated by Pillar 1, and higher than the minimum adopted by EBA for CET1 in its 2014 stress test. This is because we have added a 2% to each of the three basic levels to take into account that the stress test only concerns NPLs.
Banks passing the stress test might adopt their own strategy for reducing NPLs consistently with the expectations of supervisors. Under Pillar 2, one option for incentivising these banks to cleaning up their balance sheets could be to consider the capital add-on ‘suggested’ by the capital guidance as the amount coming from the massive write-offs of the proposed stress test; the cost in term of capital should be partially offset by the capital bonus and the further benefits coming from the higher market evaluation due to the cleansing of the balance-sheet. Anyway, as we will explain in the next section, also banks not presenting post-test capital deficits should be forced by supervisors to converge within five years towards the EU average of the Net NPL/TC. In any case, the post-test results that we present below are computed extending the post-test to all banks, with the obvious exception of those already complying with the two adjustment factors.
The results of the NPL stress test for the three sectors are shown in tables 4, 5 and 6.
in most cases prescribes a risk weight of 100% for “past-due loans” (the regulatory term for NPLs), net of specific provisions and write-off.
Table 6 – Pre- and post-test indicators for the RB sector
Entire RB sector Compliant banks
Banks with adjustment, but not needing recapitalisation Number of banks 45 28 17 TA as % of sample’s TA 0.50 0.24 0.26
Pre-test Post-test Pre-test Pre-test Post-test
CET1 ratio (%) 17.9 17.1 19.9 16.1 14.3
Tier 1 ratio (%) 17.9 17.1 19.9 16.1 14.3
TC ratio (%) 18.1 17.2 20.0 16.3 14.6
Net NPL/TC (%) 24.1 19.9 13.3 36.5 16.4
The Raiffeisen sector comes out of the stress test unscathed. No RB needs to be recapitalised. RBs present the highest capitalisation and the least weight of NPLs. To be fair, their performance is significantly due to the fact that the province of Bolzano did not suffer the deep recession that hit the rest of the country.
On the contrary, 78 banks of the other two sectors, representing around 20% of the asset of the sample, should be recapitalised.
T able 4 – Pr a nd p ost -tes t ind icato rs fo r the O B sec to r Ent ir e O B sec to r Comp lia nt ba nk s Ba n ks wi th ad ju st me nt , bu t no t nee d ing reca p it al isa tio n Ba n ks wi th ad ju st me nt nee d ing reca p it al isa tio n N umb er o f b an ks 94 34 34 26 TA a s % of s ampl e’ s TA 92.3 10.3 63.9 18.1 Pr e-te st Post -te st Pr e-te st Pr e-te st Post -te st Pr e-te st Post -te st R eq ui re d re ca pit al isa tion * – 9, 941 – – – – 9, 941 CE T1 ra tio ( % ) 11.2 9.8 13.6 10.4 9.6 11.8 8.1 Ti er 1 r atio ( % ) 11.8 10.5 13.6 11.4 10.6 11.9 8.3 TC r atio ( % ) 14.3 13.0 15.3 14.1 13.4 14.1 10.5 N et N PL /TC ( % ) 65.0 27.7 3.50 56.1 25.7 124.5 36.3 * In m ill io n EU R .
Tab le 5 – Pr a nd p ost -tes t ind icato rs fo r the B CC sec to r Ent ir e BC C sect or Comp lia nt ba nk s Ba n ks wi th ad ju st me nt , bu t no t nee d ing reca p it al isa tio n Ba n ks wi th ad ju st me nt nee d ing reca p it al isa tio n N umb er o f b an ks 271 52 167 52 TA a s % of s ampl e’ s TA 7.2 0.6 4.8 1.7 Pr e-te st Post -te st Pr e-te st Pr e-te st Post -te st Pr e-te st Post -te st R eq ui re d re ca pit al isa tion * – 1,017 – – – – 1,017 Ca pit al b uff er on mi nimum TC* – 4,162 1,205 – 2,957 – 0 CE T1 ra tio ( %) 16.6 14.0 25.7 17.1 14.4 12.4 9.2 Ti er 1 r atio ( %) 16.7 14.1 25.7 17.2 14.4 12.4 9.2 TC r atio ( %) 17.0 14.5 25.8 17.4 14.6 13.4 10.2 N et N PL /TC (%) 67.3 26.4 15.5 58.8 21.4 129.0 31.7 * In m ill io n EU R .
Given the cohesion contract, the BCC sector could deal with the capital shortfall with internal resources.33 Its post-test indicators are
positioned between the other two sectors, showing a still high level of the Net NPL/TC ratio for banks needing recapitalisation.34 The
supervisory authorities should monitor that the two parent companies use their power to force their weaker members to undertake a more general overhaul of their business model.
The OB sector presents the worst result for both the percentage of banks needing recapitalisation (28% against 19% of the BCC sector) and post-test indicators. Hardly, a significant amount of the funds required, around 10 billion euros, will come from the market, and judging from experience it would not be complemented with the right strings.
If we consider that the banks in the sample are all Basel compliant, the proposed adjustment should be considered as a stress test based on NPLs, alternative to the ones currently done based on uncertain scenarios. The goal would be the same, that is to render individual banks more resilient with respect to eventual shocks. However, the approach would differ due to the systemic nature of our results. Given that many banks need capital injections as the result of the NPL adjustment, the intervention should be systemic and follow the approach of the prompt corrective action that supervisors are required to adopt to avoid banks going from a troubled to a failing state. Since the capital shortfall of the OB sector is the consequence of
33 Worth noting is that Italian supervisors may not have yet finalized their programme
of on-site inspection for the less significant banks, mainly BCCs, from which we might eventually expect the emergence of higher NPLs and under-provisioning. However, the ECB will take the supervisory control of the two major cooperative groups and will undertake a further asset quality review of the parent companies and, at least, of the largest affiliated BCCs. The significant positive difference between the capital buffer and the capital shortfall of table 4 should be enough to cover a possible higher capital shortfall.
34 A clarification concerning the three sectors is that even if a sector presents a
post-test average lower than 26%, several banks not needing recapitalisation exceed that level and must then adopt thefurther adjustment outlined before, connected to the viability test and which the next section is devoted to.
a stress test, the Italian authorities should be allowed to use public funds as precautionary capitalisation, thus avoiding entering resolution and bail-in procedures for senior creditors.35 In some cases,
as it already happened in other EU countries, nationalisation could be the more efficient solution. In any case, public intervention should come with part of the conditionality of EU state aid rules, the ones that we referred to above as the right strings. First among them is to allow public intervention only for viable banks; hence, supervisors should question the viability of the banks needing recapitalisation.
For both the OB and BCC sectors, 78 among the banks starting with high level of Net NPL/TC do not comply with the final 26% target after the adjustment and the consequent recapitalisation. Let us remember that the latter was established at abundantly higher levels than international standards. Computing the post-test deviations with respect to US (0.59%, 1.74%) and EU (26%, 0.75%) averages, figure 15 shows that, despite the strong improvement with respect to the initial condition (figure 14), almost all banks should plan to progressively adjust to a much lower Net NPL/TC, although with different intensity.
35 The injection of public funds under precautionary recapitalization can cover capital
shortfall of solvent banks deriving from unlikely losses in an adverse scenario of a stress test or an asset quality review, i.e. in our case adopting the EU averages of the NPL and coverage ratios as stress variables. The acceptability of the precautionary motive for our recapitalization seems to follow from what already happened with other Italian and Greek banks which failed previous asset quality review and stress tests. Moreover, it is also in line with other proposals aimed at solving the legacy problem (Enria, 2017a; 2017b). However, strictly speaking, it could be argued that the capital shortfall arising from forced supervisory write-offs would cover losses in excess of those anticipated by normal provisions, which should not be considered “unlikely”, at least from a supervisory perspective. According to Hellwig (2017, p. 22), the condition that the BRRD (“Bank Recovery and Resolution Directive”, Directive 2014/59/EU) imposes on precautionary recapitalization, i.e. that it must not be used to offset losses that have occurred or are likely to occur in the immediate future, is “unrealistic [because] capital shortfalls in an asset quality review are the result of losses resulting from a revaluation of assets, e.g. loans where the review is more pessimistic about the prospect of recovery”. Along a similar line, Véron (2017, p. 10) notes that the condition that losses should be “unlikely” in the near future is rendered difficult to evaluate by the uncertainty on the quality of public auditing and the uneven implementation of accounting standards across EU countries.
Figure 15 – Post-test deviations of Net NPL/TC and PPOP/TA from US
and EU averages
Source: BVD, Orbis Bank Focus.
Figure 15 shows the residual weakness affecting many banks after the adjustment and recapitalisation, even with reference to the weaker EU averages. The curious irrelevance of PPOP/TA with respect to the level of Net NPL/TC suggests that several banks with more internal resources to devote to cover the cost of risk (those positioned to the right of the EU and US average for PPOP/TA) have utilised the extra resources in other ways, a sign of the lack of the right strings. More serious is that most banks appear to lack enough internal resources to devote to a further adjustment towards the best EU and international standards.
This leads to the issue which the next section is devoted to, that of the long-term viability of banks, defined as the ability of producing enough internal resources for further converging towards safer international standards and to sustain the financing of the economic growth of the country.
3. Testing viability
When some decades ago it was decided, through the privatisation and the liberalisation of the banking sector, that banks, apart from a more intrusive regulation and supervision, are like any other firm, one of the argument in favour of such a move was to subject banks to the market discipline, meaning that they too must pass the market test of profitability and viability. However, given the opacity of bank balance-sheets, the regulatory prudential framework, which has since then substituted previous structural interventions, recognises that the control exercised by the market (the third Pillar of the Basel framework) requires that supervisors attest the viability of each bank by verifying the continuous compliance with the rules of the first Pillar and the additional requirements coming from the second Pillar’s supervisory review and evaluation process (SREP). This is a demanding task for supervisors, but this is the system that was chosen and supervisory authorities should be endowed with appropriate resources and methodologies.
As Minsky made it clear fifty years ago (Minsky 1967 and 1975), the viability exercise requires a forward-looking approach, in which banks, like any other firm, are evaluated according to their perspective ability to generate and distribute profits. The primary focus of supervision should then be the assessment of this type of viability. Existing capital is a short-term buffer against unexpected losses, but, even if abundant, it is quickly depleted by a relatively long string of losses. Firms’ long-term viability depends on their ability to generate positive net cash flows in future periods. Banks must, in addition, comply with regulatory minimum capital requirements, which means that they must generate enough internal resources for dynamically accompanying the growth of the economy. Their return on equity (ROE) potentially measures their capacity to grow and is normally split between the addition to current capital and the payment of dividends. Hence the level of ROE should be high enough to permit its retained share to serve the growth of the economy. This, at least, should be the physiology pursued by supervisors: banks must
accompany the growth of the economy and must generate and retain enough resources to do it. The viability test that we propose in this section is then based on a target ROE, hence on the required flow of internal resources.36
The NPL stress test of the previous section and the viability test should be considered in conjunction and become the dominant features of supervisors’ action under Basel’s Pillar 2.
The purpose of the stress test was to check the viability of Italian banks with respect to the burden of NPLs inherited from the recent crisis. We have seen in sections 1 and 2 that Italian banks had not enough stock and flow resources to keep that burden within acceptable limits. Hence the need to tackle the NPL legacy problem resorting to external resources. We proposed in section 2 a stock adjustment concerning NPLs and reserves, an adjustment requiring the recapitalisation of a large share of the banking system and a temporary supervisory forbearance in the form of the capital bonus. However, since the Basel methodology on ex ante risk metrics does not seem to be able on its own to keep risks and NPLs from accumulating, supervisors’ action under Pillar 2 should add the obligation to keep Net NPLoans/TC, and more in general NPDebts/TC, below a certain threshold. With banks so constrained on ex ante and ex post risks, criticisms on metrics, such as our viability test, based on ROE because of its non-risk sensitivity should lose weight.
36 According to EBA’s Guidelines (2014, p. 40), central to the SREP is (or should be)
the assessment of the viability of a bank’s business model, defined as the ability of the institution “to generate acceptable returns”, measured by ROE or other metrics, such as ROA or risk-adjusted return on capital (RAROC). Similarly, when deciding whether to approve the feasibility of state aid and the restructuring plan of a bank needing public support, a key element of the European Commission’s evaluation is the assessment of its long-term viability, which is achieved if the bank “is able to cover all its costs including depreciation and financial charges and provide an appropriate return on equity, taking into account the risk profile of the bank” (European Commission, 2015, p. 2).
Table 7 shows the value of the reference parameters of the viability test that we propose.37 We have chosen a lower level of the
target ROE for BCCs and RBs due to their mutualistic character that favours serving the local economy to profit distribution.
Table 7 – Reference parameters (%)
Target
ROE Leverage Target ROA Provisions/TA PPOP/TA
OBs 13.5 15 0.9 0.59 1.49
BCCs 10.5 15 0.7 0.59 1.29
RBs 10.5 15 0.7 0.59 1.29
As we have seen in the previous section, the post-test Net NPL/TC value is higher than the 26% final target level for several of the banks examined. For this reason, we add to the target PPOP/TA (table 7) a factor specific to each bank that represents the annual percentage addition to capital necessary to converge to the 26% level in five years.38
For several reasons, hardly banks will regain the pre-crisis level of PPOP/TA. Even supposing an optimistic recovery scenario for the Italian economy, competitive pressure will be felt on income generation, pushing margins to converge towards the lower EU
37 The level of target ROE after tax is taken from the median of the responses given to
the last Risk Assessment Questionnaire conducted by the EBA (2017a). See also Constâncio (2017a). The gross level is computed assuming a 25% income tax rate. The level of leverage corresponds to the 2016 EU average for domestic banks (ECB, Statistical Data Warehouse). The cost of risk is the pre-crisis Italian historical average (0.48%) increased by 22% in order to take into account the increase in the IFRS 9 (International Financial Reporting Standard 9) provisioning as estimated by most banks in the EBA sample (EBA, 2017b). Particularly for the viability test, our exercises must be considered more from a methodological than from a quantitative perspective. With more granular information, supervisors might tailor the tests to the specific conditions of each bank.
38 The five years period deliberately coincides with the grace period that we propose
average level (Weber, 2017). Italian supervisors and bankers agree that the time is over for high revenue margins allowing both large and small banks to be profitable adopting the traditional expensive business model (ABI, 2017; Visco, 2017). Optimistically, we can compare the target PPOP/TA to the 2015 level, a generally higher level than the one of the distressed 2016 year. Cleaning balance sheets from excessive NPLs should help in this direction. As figure 13 already suggested, even in these conditions not many banks would comply with the minimum of PPOP/TA of table 7. The reason of the insufficiency of PPOP/TA lies in the generally high level of unitary operating expenses (Op. Exp./TA) that we have discussed in section 1. To see whether a higher attainable operating efficiency would change the result, we compare for each bank the deviation of the 2015 PPOP/TA from its target value with the deviation of the 2016 Op. Exp./TA from the respective EU average (1.44%).
For OBs, the result the of test is shown in figure 16.
Banks lying above the 45° line are or may become viable because they have potential unitary cost savings higher than the PPOP/TA shortfall. For banks that fail the NPL stress test, actual or potential viability is the necessary condition for being recapitalised. Of the 26 OBs needing recapitalisation, 14 fail the viability test. Supervisory authorities should then evaluate either the necessity to resolve or liquidate them, or whether the specificity of their business model justifies deviating from our averages. However, other 27 OBs fail the test, some with small deficits that could be eliminated given that the reference to an average does not exclude minor margins of forbearance. In any case, given that 71 of the 94 banks of the sector would not comply with the more severe PPOP/TA constraint, the efficiency gap is clearly a widespread phenomenon; the failure of tackling inefficiencies would endanger the OB’s sector long-term viability.
Figure 16 – Potential viability: OBs
The result of the viability test for the BCCs is shown in figure 17. Of the 68 BCCs that fail the viability test, 20 are in a critical condition needing recapitalisation. Many BCCs fail the test by just few basis points. Notwithstanding the lower ROE threshold, 162 of the 271 BCCs fail the PPOP/TA constraint, showing that the efficiency gap is a widespread phenomenon for this sector too.