Assessment of Serum UCH-L1 and
GFAP in Acute Stroke Patients
Changhong Ren
1,2,3, Firas Kobeissy
4,5, Ali Alawieh
6, Na Li
1, Ning Li
1, Kazem Zibara
7,8,
Susie Zoltewicz
9, Joy Guingab-Cagmat
9, Stephen F. Larner
9, Yuchuan Ding
10,
Ronald L. Hayes
9, Xunming Ji
1,2,3& Stefania Mondello
11A rapid and reliable diagnostic test to distinguish ischemic from hemorrhagic stroke in patients presenting with stroke-like symptoms is essential to optimize management and triage for thrombolytic therapy. The present study measured serum concentrations of ubiquitin C-terminal hydrolase
(UCH-L1) and glial fibrillary astrocytic protein (GFAP) in acute stroke patients and healthy controls and investigated their relation to stroke severity and patient characteristics. We also assessed the diagnostic performance of these markers for the differentiation of intracerebral hemorrhage (ICH) from ischemic stroke (IS). Both UCH-L1 and GFAP concentrations were significantly greater in ICH patients than in controls (p < 0.0001). However, exclusively GFAP differed in ICH compared with IS (p < 0.0001). GFAP yielded an AUC of 0.86 for differentiating between ICH and IS within 4.5hrs of symptom onset with a sensitivity of 61% and a specificity of 96% using a cut-off of 0.34ng/ml. Higher GFAP levels were associated with stroke severity and history of prior stroke. Our results demonstrate that blood UCH-L1 and GFAP are increased early after stroke and distinct biomarker-specific release profiles are associated with stroke characteristics and type. We also confirmed the potential of GFAP as a tool for early rule-in of ICH, while UCH-L1 was not clinically useful.
Stroke is the third most common cause of morbidity and disability worldwide1. Although extensive effort in
clin-ical and translational research has been directed at developing new therapies for stroke, the intravenous recom-binant tissue-plasminogen activator (rtPA) remains the only FDA approved pharmacological therapy with a very narrow therapeutic window (3–5 hours) after onset of ischemic stroke (IS). Consequently, in patients with a sus-pected stroke it is critical to establish a rapid and accurate diagnosis and reliably distinguish IS from intracerebral hemorrhage (ICH) and stroke mimics, to optimize triage for thrombolytic therapy, avoid unnecessary medica-tions or procedures and, ultimately, improve patient outcome2,3.
To date, brain imaging remains the gold standard for differentiating patients with IS and ICH and is routinely conducted in the initial assessment of stroke. However, there are some associated limitations, particularly within the first hours after a stroke. Computerized tomography (CT) accurately identifies cases of ICH, but is relatively insensitive in detecting acute and small IS. On the other hand, although magnetic resonance imaging (MRI) and in particular diffusion-weighted imaging (DWI) has emerged to undoubtedly improve stroke detection (~95%), some infarcts may not appear for several days, and some may never become visible4,5. In addition, MRI with
diffusion may not be feasible in patients unstable or with contraindications, and the availability of this expensive equipment and technology is limited to specialized hospitals with experienced neuroradiologists.
Similar to other diseases including myocardial infarction in which blood biomarkers have been widely integrated into clinical management a blood biomarker-test associated with ischemic or hemorrhagic stroke
1Institute of Hypoxia Medicine, Xuanwu Hospital, Capital Medical University, Beijing, 100053, China. 2Beijing Key
Laboratory of Hypoxia Conditioning Translational Medicine, Beijing, 100053, China. 3Center of Stroke, Beijing
Institute for Brain Disorder, Beijing 100069, China. 4Department of Psychiatry, Center for Neuroproteomics
and Biomarkers Research, University of Florida, Gainesville, Florida, USA. 5Department of Biochemistry and
MolecularGenetics, Faculty of Medicine, American University of Beirut Medical Center, Beirut, Lebanon.
6Department of Microbiology and Immunology, Medical University of South Carolina, Charleston, SC 29425, USA. 7Faculty of Medicine, American University of Beirut Medical Center, Beirut, Lebanon. 8Biology Department, Faculty
of Sciences, Lebanese University, Beirut, Lebanon. 9Banyan Labs, Banyan Biomarkers Inc., Alachua, FL, USA. 10Department of Neurosurgery, Wayne State University, School of Medicine, Detroit, 48201, MI, USA. 11Department
of Biomedical, Dental and Morphological and Functional Imaging Sciences, University of Messina, Messina, Italy. Correspondence and requests for materials should be addressed to X.J. (email: [email protected]) or S.M. (email: [email protected])
received: 06 November 2015 Accepted: 01 April 2016 Published: 14 April 2016
OPEN
may represent a valuable adjunct to current routinely available diagnostic methods and provide an objective cost-effective and rapid tool approach for early diagnosis, triage, and prognosis of stroke patients6, and ultimately
for guiding specific pathobiology-based therapeutic interventions. An ideal diagnostic marker of stroke should exhibit the following features: 1. brain specificity; 2. diagnostic accuracy; 3. reproducibility; 4. being rapidly meas-urable early after injury in blood samples at a reasonable cost; and 5. offering unique powerful complementary information to guide medical decision making (clinical utility)7.
Identification of reliable biomarkers for stroke is under intensive investigation in preclinical and clinical stud-ies. Among the several candidates that have been proposed glial fibrillary acidic protein (GFAP) and ubiquitin C-terminal hydrolase L1 (UCH-L1) hold significant promise.
GFAP is a brain-specific astrocytic intermediate filament protein found almost exclusively in the central nerv-ous system (CNS)8. A number of clinical studies have explored the use of serum GFAP as a tool for diagnosis
and prognosis in traumatic brain injury (TBI) and stroke9–11 UCH-L1 is a cytoplasmic deubiquitinating enzyme
of neurons, highly enriched in CNS12, that has been associated with synaptic plasticity and homeostasis and to
the brain’s self-repair mechanisms after injury13,14. Like GFAP, numerous experimental and clinical studies have
shown increased UCH-L1 levels in cerebrospinal fluid (CSF) and blood of patients following TBI and stroke. In addition, significant correlations with disease severity and outcome have been observed15–17.
Importantly, because of their own distinct features and cellular origins UCH-L1 and GFAP allow to assess and explore cell-type–specific injury patterns and different pathophysiological mechanisms in brain injury18,19. In
addition, their dual combination is under an extensive analytical and clinical validation16,20–22 and holds the most
promise for point-of-care (POC) application that can entails a very rapid transferability to the clinical practice. Given the potential of these 2 markers to unveil important aspects of stroke pathophysiology, the paucity of available data in the literature and the likely availability of information to physicians at the bedside in a very near future, we decided in the present study to investigate the simultaneous assessment of GFAP and UCH-L1 in patients presenting with stroke-like symptoms and their relation to initial stroke severity and patient charac-teristics. We also evaluated the diagnostic performance of these biomarkers alone and in combination for the differentiation between IS and ICH.
Results
Population.
The study population included a total of 45 ICH, 79 IS, 5 subarachnoid hemorrhage (SAH) and 3 transient ischemic attack (TIA) patients and 57 controls. Baseline demographic and clinical character-istics of patients and controls are listed in Table 1, showing that they were well matched with regard to all key characteristics.Serum Concentrations of UCH-L1 and GFAP.
The median serum concentrations of UCH-L1 and GFAP for patients (stroke or TIA) and controls are shown in Table 2. Serum UCH-L1 was significantly higher in patients with ICH compared to controls (p < 0.001) (Fig. 1) and tended to be higher in SAH and IS patients. Serum GFAP concentrations were significantly higher in patients with ICH, IS and SAH compared to controls, but concen-trations were similar when comparing TIA patients with controls. GFAP concenconcen-trations were also found to be significantly elevated in patients with ICH compared to IS patients (Table 2 and Fig. 1). UCH-L1 concentrations were weakly correlated with GFAP in IS patients (r = 0.36, p = 0.001), and strongly correlated in SAH patients (r = 1.00, p = 0.017) (Fig. 2). No similar correlations were found in ICH or TIA cases. No correlation between time to sample withdrawal and biomarker level was found.Correlation of UCH-L1/GFAP levels and NIHSS in stroke patients.
In IS patients, individual GFAP values correlated with the corresponding NIHSS score (r = 0.30, p = 0.007), but no other correlations were found. Based on the NIHSS score on admission, patients were classified as mild (NIHSS ≤ 7) or moderate to severe stroke patients (NIHSS > 7), as previously described23. In ICH patients there were no differences in UCH-L1 andGFAP levels between mild and moderate-severe stroke patients (data not shown). IS patients with mild stroke had significantly lower levels of GFAP than patients with moderate to severe stroke (0.015 vs 0.07 ng/ml, p = 0.009), while UCH-L1 did not differ between the two subpopulations.
Healthy Volunteers
(n = 57) ICH (n = 45) IS (n = 79) SAH (n = 5) TIA (n = 3) P value
Age, years, mean (SD) 58.93 (9.82) 58.91 (12.18) 61.1 (13.33) 63.08 (10.55) 46.67 (6.51) 0.171 Gender, n (%)
Female 27 (47.37) 9 (45) 30 (37.98) 2 (40) 1 (33.33) 0.46
Male 30 (52.63) 36 (80) 49 (62.02) 3 (60) 2 (66.67)
NIHSS on admission, median (interquartile range) NA 7 (4–11) 4 (1–8) 0 (0–2) 0 *0.008 Time to sampling from symptom onset, h, median
(interquartile range) NA 7 (3–24) 10 (4–24) 12 (3–24) 24 (3–24) 0.81
Patients with hyperlipidemia, n (%) 19 (33.33) 10 (22.22) 24 (30.38) 1 (20) 1 (33.33) 0.76 Patients with diabetes, n (%) 9 (15.79) 5 (11.11) 17 (21.52) 1 (20) 1 (33.33) 0.41 History of Previous Stroke, n (%) 7 (12.28) 13 (28.89) 23 (29.11) 0 0 0.07 Table 1. Baseline characteristics of healthy volunteers and patients with stroke or TIA. NA, not applicable.
Healthy Volunteers
(n = 57) ICH (n = 45) IS (n = 79) SAH (n = 5) TIA (n = 3) P valuea
UCH-L1 0.05 (0.02–0.13) 0.17 (0.09–0.35) 0.13 (0.05–0.21) 0.21 (0.09–0.28) 0.02 (0.02–0.24) < 0.0001 GFAP 0.004 (0.004–0.02) 0.81 (0.18–3.31) 0.02 (0.004–0.08) 1.33 (0.02–3.21) 0.004 (0.004–0.09) < 0.0001 Table 2. Median serum concentrations of UCH-L1 and GFAP in patients (stroke or TIA) at the time of hospital admission and in controls. Data are given as median (interquartile range). aKruskall-Wallis test.
Figure 1. Box-and-whisker plots demonstrating UCH-L1 and GFAP concentrations within 24 hours of symptom onset. Serum UCH-L1 (A) and GFAP concentrations (B) in patients with stroke or TIA and controls.
The horizontal line in each box represents the median, with the boxes representing the interquartile range. Significant differences are indicated (Kruskal-Wallis test). The reference line (red line) represents the median of estimated normal values.
Figure 2. Correlations of logged serum GFAP and UCH-L1 concentrations in patients with IS and SAH (r = 0.36 and r = 1.00, respectively, test based on the Spearman’s rank correlation).
UCH-L1/GFAP levels in relation to history of stroke.
The median serum UCH-L1 in ICH patients was higher in patients with no history of stroke compared to those who had a previous stroke (0.26 vs 0.13 ng/ml, respectively, p = 0.008); however, GFAP concentrations did not differ between these two subpopulations. On the other hand, in IS patients, the median serum GFAP level was significantly lower in subjects with no history of stroke compared to those with a previous stroke (0.015 vs 0.07 ng/ml, respectively, p = 0.004), while there was no difference in the levels of UCH-L1 between these 2 subgroups.ROC curve analyses.
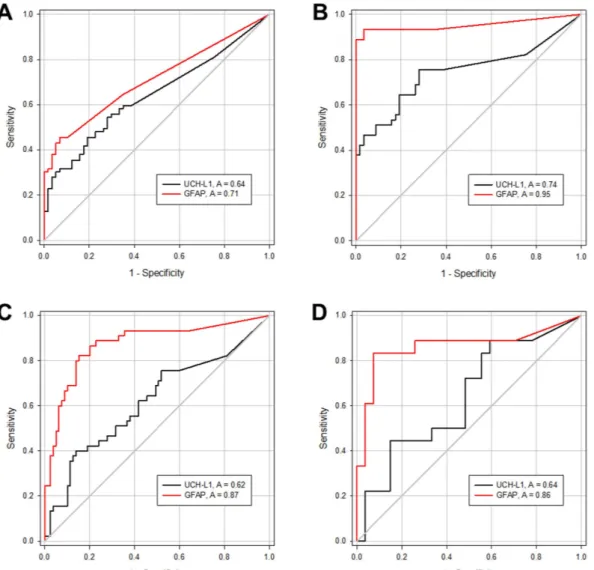
ROC curve analyses was performed and demonstrated that UCH-L1 and GFAP levels were able to distinguish patients with IS from controls, with an area under the curve of 0.64 (95% CI 0.55 to 0.73) and 0.71 (95% CI 0.63 to 0.79) (Fig. 3A), respectively. Furthermore, UCH-L1 and GFAP levels were able to distin-guish patients with ICH from controls, with an area under the curve of 0.74 (95% CI 0.64 to 0.85) and 0.95 (95% CI 0.90 to 1.00) (Fig. 3B), respectively.The area under the curve of UCH-L1 and GFAP for discriminating between IS and ICH patients were 0.62 (95% CI 0.51 to 0.72) and 0.87 (95% CI 0.80 to 0.94), respectively. There was a significant difference in diagnostic accuracy between these markers (p < 0.001, test based on the Mann-Whitney statistic) (Fig. 3C). More specifi-cally, using a cut-off point of 0.34 ng/ml GFAP was able to differentiate patients with IS from those with ICH with a sensitivity of 0.67 and a specificity of 0.91. The combination of UCH-L1 and GFAP did not improve diagnostic accuracy (AUC 0.875) compared with GFAP alone.
Additionally, as we were specifically interested in using neuronal and glial markers in serum as a tool to rule out ICH in patients with ischemic stroke who are eligible for acute thrombolytic therapy, we evaluated the diag-nostic accuracy of UCH-L1 and GFAP measurement within 4.5 hours of symptom onset. Diagdiag-nostic accuracy was essentially similar to that calculated using the entire dataset (UCH-L1, AUC 0.64 [95% CI 0.47 to 0.81]; GFAP,
Figure 3. ROC curves for UCH-L1 (black line) and GFAP (red line) in serum for distinguishing patients with IS (A) and ICH (B) from controls, and for differentiating between patients with IS and patients with ICH at various time points (C) and within 4.5 hours of symptom onset (D). The area under the curves is
AUC 0.86 [95% CI 0.73 to 0.99]) (Fig. 3D). Using a cut-off point of 0.34 ng/ml GFAP was able to differentiate patients with IS from those with ICH with a slightly improved specificity (sensitivity 0.61, specificity 0.96).
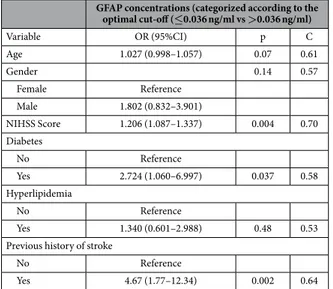
Multiple logistic regression analyses for GFAP concentrations.
Univariate binary logistic regression analysis showed that several characteristics were strongly associated with higher GFAP concentrations following acute stroke (Table 3). Multivariate logistic regression analysis of patients with stroke, including all significant variables, only identified ‘previous history of stroke’ and ‘NIHSS’ as independent predictors of higher GFAP concentrations (Table 4). Consistently, multivariate logistic regression analysis revealed that previous history of stroke and NIHSS were found to independently contribute to the probability of having higher GFAP concen-trations when only patients with ischemic stroke were considered (Table 4). Conversely, these variables did not appear to independently influence GFAP concentrations in patients with ICH.Discussion
The major finding of this study is that acute ICH patients had significantly higher serum levels of both GFAP and UCH-L1 as compared to matched healthy controls, and that serum GFAP but not UCH-L1 was significantly lower in patients with IS compared with those with ICH. Importantly, we also showed for the first time that higher GFAP levels were associated with history of previous episode of stroke. Furthermore, our data provide additional
GFAP concentrations (categorized according to the optimal cut-off (≤0.036 ng/ml vs >0.036 ng/ml) Variable OR (95%CI) p C Age 1.027 (0.998–1.057) 0.07 0.61 Gender 0.14 0.57 Female Reference Male 1.802 (0.832–3.901) NIHSS Score 1.206 (1.087–1.337) 0.004 0.70 Diabetes No Reference Yes 2.724 (1.060–6.997) 0.037 0.58 Hyperlipidemia No Reference Yes 1.340 (0.601–2.988) 0.48 0.53
Previous history of stroke
No Reference
Yes 4.67 (1.77–12.34) 0.002 0.64
Table 3. Crude OR with 95% confidence intervals of clinical and demographic variables for higher GFAP concentrations (dichotomized according to the identified optimal cut-off value), using univariate logistic regression. C = The area under an ROC curve (also known as c-statistic) provides an overall measure
of diagnostic accuracy, with the value of one representing perfect accuracy. OR = odds ratios; GFAP = glial fibrillary acidic protein; NIHSS = NIH Stroke Scale/Score.
GFAP concentrations (categorized according to the optimal cut-off (≤0.036 ng/ml vs >0.036 ng/ml)
Variable OR (95%CI) C
All patients with stroke (ICH and IS)
NIHSS Score 1.204 (1.082–1.339)†
0.77 Previous history of stroke
No Reference
Yes 4.845 (1.701–13. 805)‡ Patients with IS
NIHSS Score 1.143 (1.015–1.287)*
0.79 Previous history of stroke
No Reference
Yes 8.261 (2.494–27.367)†
Table 4. Crude OR with 95% confidence intervals of clinical and demographic variables for higher GFAP concentrations (dichotomized according to the identified optimal cut-off value), using univariate logistic regression. C = The area under an ROC curve (also known as c-statistic) provides an overall measure
of diagnostic accuracy, with the value of one representing perfect accuracy. *p < 0.05, ‡p < 0.01, †p < 0.001.
evidence that circulating GFAP has high discriminatory power for the clinically relevant differential diagnosis of ICH versus IS, while UCH-L1 does not appear to be clinically useful in this context.
In this controlled prospective study, we explored two candidate biomarkers for early diagnosis of stroke, namely UCH-L1 and GFAP, which are abundantly expressed in neuronal and glial cell respectively. These two protein biomarkers have not been simultaneously assessed in prior studies on human stroke subjects evaluating and comparing their diagnostic performance. In particular, we found that UCH-L1 was substantially higher in ICH cases than in healthy volunteers, distinguishing patients with ICH from controls, with an accuracy of 0.74; while there was no significant difference between IS patients and healthy controls. This finding probably reflects a more sudden and instantaneous necrotic neuronal death and disruption of the BBB that occurs following ICH. However, Liu et al. reported that serum UCH-L1 level was also significantly elevated in experimental ischemic stroke model7. In line with this investigation, our previous study has demonstrated that UCH-L1 was elevated
after an ischemic but not hemorrhagic stroke in rats15. The discrepancy between human and animal studies is
unclear, but it may reflect differences between rodents and humans in the release kinetics of brain injury biomark-ers, regulation of blood circulation and clearance or ability to repair the BBB following ischemia7.
A number of clinical research studies explored the use of serum GFAP as a tool for the diagnosis and prog-nosis prediction in TBI and stroke patients24. Our results confirmed that levels of GFAP from patients with acute
ICH were significantly elevated compared to those with IS and that GFAP can reliably distinguish ICH from IS with a high specificity indicating the potential utility of this test to accurately rule-in ICH particularly very early after symptom onset. This ability of GFAP to rule-in ICH can be especially valuable in the pre-hospital setting when specific interventions such as lowering of increased blood pressure or the rapid reversal of anticoagulation can be applied and be most effective25. Our findings are in accordance with previously published studies9,10,26,27
showing that GFAP is an effective biomarker for acute stroke differential diagnosis and reporting similar diag-nostic accuracy. Nonetheless, there is a large variation in the thresholds used for diagnosis (from 0.11 to 4 ng/ml) across studies, which may generate concern about a clinical use. Many reasons may explain this variability includ-ing characteristics of the patients, differences in sample type (plasma vs. serum) and time points as well as lack of standardization, analytical factors (batch-to-batch variations of the ELISA kits, laboratory equipment and proce-dures) and absence of validated reference methods. Future rigorous and standardized quality control studies are required for identification and harmonization of optimum cutoff values.
Another aim for this work was to evaluate the use of GFAP in combination with UCH-L1 for the differential diagnosis of ICH and IS. Surprisingly, the diagnostic accuracy of GFAP was not increased when combined with UCH-L1. However, Unden et al. reported that the sensitivity of GFAP is increased once combined with activated protein C-protein inhibitor complex27. Several studies have shown that inflammatory mediators and acute-phase
response markers (C-reactive protein [CRP], interleukin 6 [IL-6], tumor necrosis factor alpha [TNF-α ], matrix metalloproteinase 9 [MMP-9])28, components of the coagulation system and hemostasis (thrombomodulin,
D-dimer, fibrinogen, and von Willebrand factor [vWF])29–32, markers of lipid peroxidation (malondialdehyde
[MDA])33 and adipocyte fatty acid-binding protein (A-FABP)34 appear to identify the ischemic nature of stroke.
Therefore, a multimarker approach based on the combination of GFAP and these biomarkers that are differently altered across ischemic and hemorrhagic stroke might prove to be of clinical value providing complementary and incremental information and might better distinguish the disease entities and increase sensitivity and specificity compared with individual markers. Future studies are warranted to identify and validate a blood-based biomarker panel for the diagnosis, characterization and stratification of stroke patient population for routine use in clinical practice.
Noteworthy, the levels of both UCH-L1 and GFAP were not found elevated in the TIA group. This finding might be explained by the fact that TIA triggers a cascade of molecular mechanisms and neurometabolic events that not necessarily result in evident structural changes and parenchymal damage to the brain and therefore may not be detectable using glial or neuronal proteins in serum. Other markers of microvascular damage, thrombosis and neurotoxicity may more appropriately capture pathophysiological mechanisms underlying TIA and are cur-rently under extensive investigation as surrogate markers for TIA diagnosis35,36.
In addition to the difference in biomarker levels across the patients groups, we showed that UCH-L1 concen-trations correlated with GFAP level in patients with IS and SAH, but no other correlations were found. This may be attributable to the different cell origin and protein characteristics (e.g. molecular weights [UCH-L1 25 kDa and GFAP ~50 kDa]) as well as the distinctive pathophysiology and tissue damage associated with different types of strokes which may affect the temporal dynamics and passage across the blood brain barrier (BBB) thereby resulting in distinct biomarker-specific release patterns. Previous experimental and human studies of biomarker kinetics from our group support this hypothesis37,38. More recently, we also demonstrated variability in biomarker
profiles (UCH-L1 and GFAP) across different experimental TBI models and provided clear evidence that bio-marker levels and time course are associated to the overall magnitude of injury and BBB disruption severity as well as different types of injuries and locations39. Further studies are urgently needed to determine potential
stroke-signature patterns of brain damage biomarkers.
In this study, we also investigated the correlation of UCH-L1 and GFAP levels with patient characteristics including age, gender, diabetes, hyperlipidemia and having a previous history of stroke. An intriguing observation arising from these analyses is that ‘history of previous stroke’ was independently associated with higher GFAP concentrations after acute ischemic stroke. This finding fits in well with a seminal study from Dietrich’s group demonstrating that a first initial cerebrovascular event induces a state of brain vulnerability which predisposes the brain to more severe extensive damage after a second ischemic insult40. This increased vulnerability appears to be
likely a consequence of persistent pathophysiological processes including vascular disturbances, long-term alter-ation of BBB permeability and damage to the brain parenchyma itself triggered by the initial stroke. For clinical practice, it would be extremely helpful if GFAP may serve as a marker for risk stratification in patient with stroke
by characterizing and quantifying the ongoing chronic damage and possibly helping to determine a temporal window of brain vulnerability occurring after the initial insult. Future studies are warranted.
Although no significant differences in the serum levels of GFAP and UCH-L1 in SAH samples compared with IC and ICH were observed, GFAP levels after SAH were higher compared to controls, which is consistent with previous clinical studies41. Nonetheless, because of the limited available data, more investigation is needed before
drawing any conclusions on whether GFAP may be used in the diagnosis and as a guide for medical decisions in SAH patients.
In this study, we focused on analysis of two biomarkers reflecting different types of structural damage and pathophysiological mechanisms thereby providing complementary information. However, due to the complex pathophysiology of stroke and the vast spectrum of molecular events triggered by the initial insult, UCH-L1 and GFAP cannot be sufficient and it will be necessary to broaden our arsenal to cover other significant pathophysio-logical mechanisms that come into play including inflammation, oxidative stress, axonal injury and remodeling and molecular reorganisation of membrane and extracellular-matrix proteins. This is likely to the most successful strategy that will lay the foundation of personalized therapeutic approach in stroke. However, the two biomarkers investigated in this study can be of critical value in subsequent studies that combine these biomarkers to other potential candidates with the ultimate aim of providing a reliable, rapid and accurate panel of blood biomarkers to stratify and predict outcome of stroke patients.
Some limitations of this study should be acknowledged. The main limitation is the relatively modest sample size which may affect the reproducibility of our results42. Future large multi-center studies are necessary to
con-firm our findings and determine the true clinical utility of these biomarkers in the management of patient with a suspected stroke. Further, we did not assess differences in the level of UCH-L1 and GFAP based on stroke loca-tion. It is likely that biomarker concentrations will differ based on the ischemic location in the human brain (e.g. cortical vs. subcortical infarct), as suggested by previous studies23. This will be an important avenue for future
investigation. Another limitation of the study was the lack of outcome information, which would have helped to elucidate the relationships of initial biomarker levels and recovery patterns. However, in the present study, we were especially interested in characterizing the diagnostic value of UCH-L1 and GFAP and their potential in the acute care setting.
In summary, we demonstrated elevation of blood UCH-L1 and GFAP early after acute stroke and distinct biomarker-specific release patterns associated with stroke type and characteristics contributing to the current knowledge on the pathophysiology and the role of brain damage markers in acute stroke. Finally, our data also provide important additional evidence that serum GFAP shows promising diagnostic value for detecting ICH in acute stroke patients.
Methods
Subjects.
This study was reviewed and approved by the Xuanwu Hospital, Capital Medical University Institutional Review Board, and a written informed consent was obtained from patients or legal representatives. The study was carried out in accordance with the approved guidelines.One hundred seventy-seven patients admitted with acute stroke or transient ischemic attack to the Emergency Department of Xuanwu Hospital, Capital Medical University and Department of Neurology of Beijing Renhe Hospital, China, were enrolled in this study. Inclusion criteria were sudden occurrence of a focal neurological deficit secondary to ICH, SAH, IS or TIA, admission within 24 hours of symptom onset, presence of neurological symptoms at the time of admission, and adequate access to patient information. Standard definitions of TIA and stroke in accordance with guidelines were used43. All patients underwent standard neurological and general
med-ical evaluation and assessment using the National Institutes of Health Stroke Scale (NIHSS). Past medmed-ical history and medication history were obtained. History of prior strokes was based upon medical record documentation, and findings on imaging studies. ICH, SAH or IS were diagnosed using initial or consecutive brain imaging ( CT or MRI).
Controls consisting of healthy volunteers who did not have any focal neurological deficit and antecedents of central nervous system disease were enrolled from the Medical Examination Center of Xuanwu Hospital, Capital Medical University, China.
Blood sample collection and processing.
At hospital admission, 2mL of blood was collected from each subject by venipuncture into gel-separator tubes for serum (BD Company). Blood tubes were rapidly transported to the laboratory facility of the hospitals and centrifuged at 1500 g for 10 minutes within 10 to 60 minutes after blood collection. Serum was then separated in 0.5 ml aliquots and stored at −80°C. The samples were shipped on dry ice to Banyan Biomarkers Inc.Enzyme-linked immunosorbent assay.
Serum samples were processed by board-certified laboratory technicians who were blinded to clinical information. Proprietary sandwich enzyme-linked immunosorbent assays (ELISAs) were used to determine the concentrations and temporal profiles of UCH-L1 and GFAP in the serum samples. The employed GFAP assay is able to detect full-length as well as GFAP break down products (BDPs). Banyan has successfully used these sensitive biomarker assays in a series of previously published studies in adults with TBI and neurodegenerative diseases21,44. Briefly, both mouse monoclonal rabbit polyclonal antibodyagainst recombinant UCH-L1 full length and partial protein, were produced in-house at Banyan Biomarkers, Inc. Similarly, a proprietary mouse monoclonal antibody for solid phase immobilization and a polyclonal rabbit detec-tion antibody were used for ELISA, to detect the levels of intact GFAP and its BDPs. This approach allows a more sensitive detection of GFAP in patients’ blood21,22. Standard curves using recombinant proteins were generated
for each assay and quantitative determination of the biomarker levels in the de-identified samples were based on four-parameter non-linear regression analyses using SigmaPlot version 11 (Systat, Chicago, IL, USA).
Statistical Analyses.
Data normality was assessed using the Kolmogorov–Smirnov test. Results are pre-sented as mean (± SD) or median (interquartile range) as appropriate. The Mann–Whitney U-test was used to assess differences in biomarker concentration between 2 groups and the Kruskal-Wallis test was used to assess the overall differences in biomarker concentration across three or more groups. For age, the only normally distributed continuous variable, the one-way analysis of variance (ANOVA) was used. Correlation analyses between bio-marker serum concentrations and quantitative variables were performed using the nonparametric Spearman rank correlation test. The association between categorical variables was investigated using the chi-square or Fisher’s exact test, as appropriate.Receiver operating characteristic (ROC) curve analysis was used to calculate diagnostic accuracy of biomark-ers for distinguishing between stroke and controls and between ICH and IS and to determine the optimal cutoff with optimized sensitivity and specificity for the identification of ICH. The overall measure of diagnostic accuracy of the models was assessed using the area under the receiver operating characteristic curve (AUC). The AUC is a measure of predictive discrimination with the value of one representing perfect accuracy and 0.5 representing a random guess.
Univariate logistic regression was applied to determine whether demographic and clinical characteristics of stroke patients (age, sex, diabetes mellitus, hyperlipidemia, previous history of stroke, NIHSS Score) inde-pendently influenced GFAP concentrations. GFAP as the dependent variable was categorized according to the optimal identified cutoff. Variables associated with outcome in the univariate analysis (p < 0.05) were included in additional multivariable logistic regression models to determine factors that could be considered independent risk factors for increased GFAP concentrations. Adjusted odds ratios are reported with their respective 95% CIs. We evaluated several models due to collinearity of candidate variables.
Data were analyzed according to the pre-specified statistical analysis plan. Two-sided tests were used and a p-value < 0.05 was considered significant. Statistical analysis was performed using the SAS software version 9.2 (SAS Institute Inc., Cary, NC, USA).
References
1. Murray, C. J. et al. Disability-adjusted life years (DALYs) for 291 diseases and injuries in 21 regions, 1990–2010: a systematic analysis for the Global Burden of Disease Study 2010. Lancet 380, 2197–2223 (2012).
2. Whiteley, W. Identifying blood biomarkers to improve the diagnosis of stroke. J R Coll Physicians Edinb 41, 152–154 (2011). 3. Mouhieddine, T. H. et al. Nanotheragnostic applications for ischemic and hemorrhagic strokes: improved delivery for a better
prognosis. Curr Neurol Neurosci Rep 15, 505 (2015).
4. Chalela, J. A. et al. Magnetic resonance imaging and computed tomography in emergency assessment of patients with suspected acute stroke: a prospective comparison. Lancet 369, 293–298 (2007).
5. Jauch, E. C. et al. Guidelines for the early management of patients with acute ischemic stroke: a guideline for healthcare professionals from the American Heart Association/American Stroke Association. Stroke 44, 870–947 (2013).
6. Foerch, C., Montaner, J., Furie, K. L., Ning, M. M. & Lo, E. H. Invited article: searching for oracles? Blood biomarkers in acute stroke. Neurology 73, 393–399 (2009).
7. Liu, M. C. et al. Ubiquitin C-terminal hydrolase-L1 as a biomarker for ischemic and traumatic brain injury in rats. Eur J Neurosci 31, 722–732 (2010).
8. Eng, L. F., Ghirnikar, R. S. & Lee, Y. L. Glial fibrillary acidic protein: GFAP-thirty-one years (1969–2000). Neurochem Res 25, 1439–1451 (2000).
9. Foerch, C. et al. Serum glial fibrillary acidic protein as a biomarker for intracerebral haemorrhage in patients with acute stroke. J Neurol Neurosurg Psychiatry 77, 181–184 (2006).
10. Foerch, C. et al. Diagnostic accuracy of plasma glial fibrillary acidic protein for differentiating intracerebral hemorrhage and cerebral ischemia in patients with symptoms of acute stroke. Clin Chem 58, 237–245 (2012).
11. Mondello, S. et al. The challenge of mild traumatic brain injury: role of biochemical markers in diagnosis of brain damage. Med Res Rev 34, 503–531 (2014).
12. Jackson, P. & Thompson, R. J. The demonstration of new human brain-specific proteins by high-resolution two-dimensional polyacrylamide gel electrophoresis. J Neurol Sci 49, 429–438 (1981).
13. Papa, L. et al. Ubiquitin C-terminal hydrolase is a novel biomarker in humans for severe traumatic brain injury. Crit Care Med 38, 138–144 (2010).
14. Rojo, D. R. et al. Influence of stochastic gene expression on the cell survival rheostat after traumatic brain injury. Plos One 6, e23111 (2011).
15. Ren, C. et al. Different expression of ubiquitin C-terminal hydrolase-L1 and alphaII-spectrin in ischemic and hemorrhagic stroke: Potential biomarkers in diagnosis. Brain Res 1540, 84–91 (2013).
16. Papa, L. et al. Serum levels of ubiquitin C-terminal hydrolase distinguish mild traumatic brain injury from trauma controls and are elevated in mild and moderate traumatic brain injury patients with intracranial lesions and neurosurgical intervention. J Trauma Acute Care Surg 72, 1335–1344 (2012).
17. Mondello, S. et al. Clinical Utility of Serum Levels of Ubiquitin C-Terminal Hydrolase as a Biomarker for Severe Traumatic Brain Injury. Neurosurgery 70, 666–675 (2012).
18. Mondello, S. et al. Neuronal and glial markers are differently associated with computed tomography findings and outcome in patients with severe traumatic brain injury: a case control study. Crit Care 15, R156 (2011).
19. Mondello, S. et al. Glial neuronal ratio: a novel index for differentiating injury type in patients with severe traumatic brain injury. J Neurotrauma 29, 1096–1104 (2012).
20. Kou, Z. et al. The Role of Advanced MR Imaging Findings as Biomarkers of Traumatic Brain Injury. J Head Trauma Rehabil 25, 267–282 (2010).
21. Papa, L. et al. Elevated levels of serum glial fibrillary acidic protein breakdown products in mild and moderate traumatic brain injury are associated with intracranial lesions and neurosurgical intervention. Ann Emerg Med 59, 471–483 (2012).
22. Diaz-Arrastia, R. et al. Acute biomarkers of traumatic brain injury: relationship between plasma levels of ubiquitin C-terminal hydrolase-L1 and glial fibrillary acidic protein. J Neurotrauma 31, 19–25 (2014).
23. Brouns, R. et al. Neurobiochemical markers of brain damage in cerebrospinal fluid of acute ischemic stroke patients. Clin Chem 56, 451–458 (2010).
24. Schiff, L., Hadker, N., Weiser, S. & Rausch, C. A literature review of the feasibility of glial fibrillary acidic protein as a biomarker for stroke and traumatic brain injury. Mol Diagn Ther 16, 79–92 (2012).
25. Broderick, J. et al. Guidelines for the management of spontaneous intracerebral hemorrhage in adults: 2007 update: a guideline from the American Heart Association/American Stroke Association Stroke Council, High Blood Pressure Research Council, and the Quality of Care and Outcomes in Research Interdisciplinary Working Group. Stroke 38, 2001–2023 (2007).
26. Dvorak, F., Haberer, I., Sitzer, M. & Foerch, C. Characterisation of the diagnostic window of serum glial fibrillary acidic protein for the differentiation of intracerebral haemorrhage and ischaemic stroke. Cerebrovasc Dis 27, 37–41 (2009).
27. Unden, J. et al. Explorative investigation of biomarkers of brain damage and coagulation system activation in clinical stroke differentiation. J Neurol 256, 72–77 (2009).
28. Rodriguez-Yanez, M. & Castillo, J. Role of inflammatory markers in brain ischemia. Curr Opin Neurol 21, 353–357 (2008). 29. Olivot, J. M., Labreuche, J., Aiach, M., Amarenco, P. & Investigators, G. Soluble thrombomodulin and brain infarction: case-control
and prospective study. Stroke 35, 1946–1951 (2004).
30. Barber, M., Langhorne, P., Rumley, A., Lowe, G. D. & Stott, D. J. Hemostatic function and progressing ischemic stroke: D-dimer predicts early clinical progression. Stroke 35, 1421–1425 (2004).
31. Tombul, T., Atbas, C. & Anlar, O. Hemostatic markers and platelet aggregation factors as predictive markers for type of stroke and neurological disability following cerebral infarction. J Clin Neurosci 12, 429–434 (2005).
32. Sato, M., Suzuki, A., Nagata, K. & Uchiyama, S. Increased von Willebrand factor in acute stroke patients with atrial fibrillation. J Stroke Cerebrovasc Dis 15, 1–7 (2006).
33. Cano, C. P. et al. Increased serum malondialdehyde and decreased nitric oxide within 24 hours of thrombotic stroke onset. Am J Ther
10, 473–476 (2003).
34. Tso, A. W. et al. Serum adipocyte fatty acid-binding protein associated with ischemic stroke and early death. Neurology 76, 1968–1975 (2011).
35. George, P. M. et al. Novel TIA biomarkers identified by mass spectrometry-based proteomics. Int J Stroke 10, 1204–1211 (2015). 36. Dambinova, S. A., Khounteev, G. A. & Skoromets, A. A. Multiple panel of biomarkers for TIA/stroke evaluation. Stroke 33,
1181–1182 (2002).
37. Brophy, G. M. et al. Biokinetic analysis of ubiquitin C-terminal hydrolase-L1 (UCH-L1) in severe traumatic brain injury patient biofluids. J Neurotrauma 28, 861–870 (2011).
38. Zoltewicz, J. S. et al. Biomarkers Track Damage Following Graded Injury Severity in a Rat Model of Penetrating Brain Injury. J Neurotrauma 30, 1161–1169 (2013).
39. Mondello, S. et al. Insight into Pre-Clinical Models of Traumatic Brain Injury Using Circulating Brain Damage Biomarkers: Operation Brain Trauma Therapy. J Neurotrauma 33, 595–605 (2016).
40. Danton, G. H., Prado, R., Watson, B. D. & Dietrich, W. D. Temporal profile of enhanced vulnerability of the postthrombotic brain to secondary embolic events. Stroke 33, 1113–1119 (2002).
41. Vos, P. E., van Gils, M., Beems, T., Zimmerman, C. & Verbeek, M. M. Increased GFAP and S100beta but not NSE serum levels after subarachnoid haemorrhage are associated with clinical severity. Eur J Neurol 13, 632–638 (2006).
42. Button, K. S. et al. Power failure: why small sample size undermines the reliability of neuroscience. Nat Rev Neurosci 14, 365–376 (2013).
43. Furie, K. L. et al. Guidelines for the prevention of stroke in patients with stroke or transient ischemic attack: a guideline for healthcare professionals from the american heart association/american stroke association. Stroke 42, 227–276 (2011).
44. Mondello, S. et al. CSF alpha-synuclein and UCH-L1 levels in Parkinson’s disease and atypical parkinsonian disorders. Parkinsonism Relat Disord 20, 382–387 (2014).
Acknowledgements
This work was partially supported by the program of Natural Science Foundation of China (No. 81573867), Scientific Special Funding of Capital Health Development (No. 2011-1001-03), China National Funds for Distinguished Youth Scientist (No. 81325007, Distinguished Professor of cheung kong scholars programme (No, T2014251) and The 12th Five Year Plan of National Science and Technology (No, 2013BAI07B00).
Author Contributions
C.R. contributed to the design of the study and interpretation of the results, and drafted the manuscript. S.M. performed data analysis, contributed to interpretation of the results and participated in manuscript preparation. F.K. contributed to interpretation of the results and participated in manuscript preparation. A.A. and K.Z. participated in manuscript preparation. Na L. and Ning L. performed clinical work and contributed to the interpretation of the results. S.Z., J.G.-C. and S.F.L. participated in the laboratory work and in the interpretation of the analytical results. Y.D., R.L.H. and X.J. contributed to the design of the study and participated in the interpretation of the results and in manuscript preparation. All authors contributed substantially to the revision of the manuscript and have approved the article for publication.
Additional Information
Competing financial interests: Dr. Hayes owns stock, receives royalties and salaries from, and is officer of
Banyan Biomarkers Inc. Drs. Kobeissy, Zoltewicz, Guingab-Cagmat, Larner and Mondello were employees and received salaries from Banyan Biomarkers, Inc. The other authors declare no competing financial interests.
How to cite this article: Ren, C. et al. Assessment of Serum UCH-L1 and GFAP in Acute Stroke Patients. Sci.
Rep. 6, 24588; doi: 10.1038/srep24588 (2016).
This work is licensed under a Creative Commons Attribution 4.0 International License. The images or other third party material in this article are included in the article’s Creative Commons license, unless indicated otherwise in the credit line; if the material is not included under the Creative Commons license, users will need to obtain permission from the license holder to reproduce the material. To view a copy of this license, visit http://creativecommons.org/licenses/by/4.0/