The midbody interactome reveals unexpected roles
for PP1 phosphatases in cytokinesis
Luisa Capalbo
1
, Zuni I. Bassi
1
, Marco Geymonat
2
, So
fia Todesca
1
, Liviu Copoiu
1,10
, Anton J. Enright
1
,
Giuliano Callaini
3
, Maria Giovanna Riparbelli
4
, Lu Yu
5,11
, Jyoti S. Choudhary
5,11
, Enrico Ferrero
2,6,12
,
Sally Wheatley
7
, Max E. Douglas
8,13
, Masanori Mishima
8,9
& Pier Paolo D
’Avino
1
*
The midbody is an organelle assembled at the intercellular bridge between the two daughter
cells at the end of mitosis. It controls the
final separation of the daughter cells and has been
involved in cell fate, polarity, tissue organization, and cilium and lumen formation. Here, we
report the characterization of the intricate midbody protein-protein interaction network
(interactome), which identi
fies many previously unknown interactions and provides an
extremely valuable resource for dissecting the multiple roles of the midbody. Initial analysis of
this interactome revealed that PP1
β-MYPT1 phosphatase regulates microtubule dynamics in
late cytokinesis and de-phosphorylates the kinesin component MKLP1/KIF23 of the
cen-tralspindlin complex. This de-phosphorylation antagonizes Aurora B kinase to modify the
functions and interactions of centralspindlin in late cytokinesis. Our
findings expand
the repertoire of PP1 functions during mitosis and indicate that spatiotemporal changes in the
distribution of kinases and counteracting phosphatases
finely tune the activity of cytokinesis
proteins.
https://doi.org/10.1038/s41467-019-12507-9
OPEN
1Department of Pathology, University of Cambridge, Tennis Court Road, Cambridge CB2 1QP, UK.2Department of Genetics, University of Cambridge,
Downing Street, Cambridge CB2 3EH, UK.3Department of Medical Biotechnologies, University of Siena, Via A. Moro 4, 53100 Siena, Italy.4Department of Life Sciences, University of Siena, Via A. Moro 4, 53100 Siena, Italy.5The Wellcome Trust Sanger Institute, Wellcome Genome Campus, Hinxton CB10 1SA, UK.6Cambridge Systems Biology Centre, University of Cambridge, Tennis Court Road, Cambridge CB2 1QR, UK.7School of Life Sciences, University of Nottingham, Nottingham NG7 2UH, UK.8Wellcome Trust/Cancer Research UK Gurdon Institute, Cambridge CB2 1QN, UK.9Centre for Mechanochemical Cell Biology and Division of Biomedical Sciences, Warwick Medical School, University of Warwick, Coventry CV4 7AL, UK.10Present address: Department of Biochemistry, University of Cambridge, Cambridge, UK.11Present address: The Institute of Cancer Research, 123 Old Brompton Road, London SW7 3RP, UK. 12Present address: Autoimmunity, Transplantation and In
flammation Bioninfomatics, Novartis Institutes for BioMedical Research, 4056 Basel, Switzerland. 13Present address: Chromosome Replication Laboratory, The Francis Crick Institute, 1 Midland Road, London NW1 1AT, UK. *email:[email protected]
123456789
G
rowth, development, and reproduction in multicellular
organisms depend on the faithful segregation of genomic
and cytoplasmic material that occurs during cell division.
Errors during this process are responsible for many human
dis-eases, including cancer. In the
final step of cell division, the
mother cell divides into two daughter cells during the process of
cytokinesis. This major cell shape change requires the assembly
and coordinated activity of two cytoskeletal structures: the
acto-myosin contractile ring, which assembles at the equatorial cortex
and drives the ingression of the cleavage furrow; and the central
spindle, an array of anti-parallel and interdigitating microtubules,
which is essential for positioning the cleavage furrow, keeping the
dividing genomes apart, and for the
final separation, i.e.,
abscis-sion, of the daughter cells
1. The contractile ring and the central
spindle are composed of several proteins and protein complexes
that act as structural and regulatory factors that control the
for-mation, dynamics and stability of these cytoskeletal structures
throughout cytokinesis
1,2. Like in many other processes during
cell division, the functions and interactions of these proteins are
often regulated by reversible posttranslational modifications,
including phosphorylation/dephosphorylation mostly mediated
by serine/threonine kinases and their counteracting
phospha-tases
3. During furrow ingression, the contractile ring compacts
the central spindle and, after completion of furrow ingression, the
two daughter cells remain connected by an intercellular bridge,
which contains at its center an organelle, the midbody, composed
of a multitude of proteins that have diverse functions. Some
midbody proteins are former components of the contractile ring
and central spindle, while others are specifically recruited during
the slow midbody maturation process that ultimately leads to the
abscission of the two daughter cells
4,5. All these proteins are
arranged in a very precise and stereotyped spatial pattern along
the midbody
6, which can be divided in approximately three major
regions: the midbody ring, containing mostly former contractile
ring components like Anillin and Citron kinase; the midbody
central core marked by central spindle proteins such as the
centralspindlin complex; and the midbody arms that
flank the
midbody core and where the chromosomal passenger complex
(CPC) and the kinesin KIF20A accumulate
4. The proper
locali-zation, regulation and interactions of all these proteins are
essential for the execution of abscission and for preventing
incorrect genome segregation
5. Furthermore, recent evidence
indicates that the midbody is also involved in many other
pro-cesses besides cell division, including cell fate, pluripotency,
apical-basal polarity, tissue organization, and cilium and lumen
formation
7,8. Therefore, the characterization of the intricate
midbody protein interaction networks (i.e., interactome) and
their regulation is essential for understanding how this organelle
executes its multiple functions.
In this study, we report the characterization of the midbody
interactome identified by affinity purifications coupled with mass
spectrometry (AP-MS) of ten key midbody components. This
valuable resource provides a molecular blueprint of the intricate
connections amongst midbody components that will be pivotal in
dissecting the multiple functions of this organelle. In support of
this, our initial analysis of the midbody interactome already
revealed a plethora of previously unidentified interactions and
highlighted a role of the PP1β-MYPT1 phosphatase in regulating
the dynamics of central spindle microtubules by antagonizing
Aurora B phosphorylation of the centralspindlin component
MKLP1 in late cytokinesis.
Results
CIT-K interactions increase speci
fically during cytokinesis.
Citron kinase (CIT-K) is a contractile ring component that acts
as a major midbody organizer by interacting with several
mid-body components, including the CPC and centralspindlin,
and by maintaining their correct localization and orderly
arrangement
9,10. As a
first step toward the characterization of the
midbody interactome, we used a human HeLa cell line stably
expressing CIT-K tagged with GFP
11to identify the CIT-K
interactomes at different cell cycle stages—S phase, metaphase,
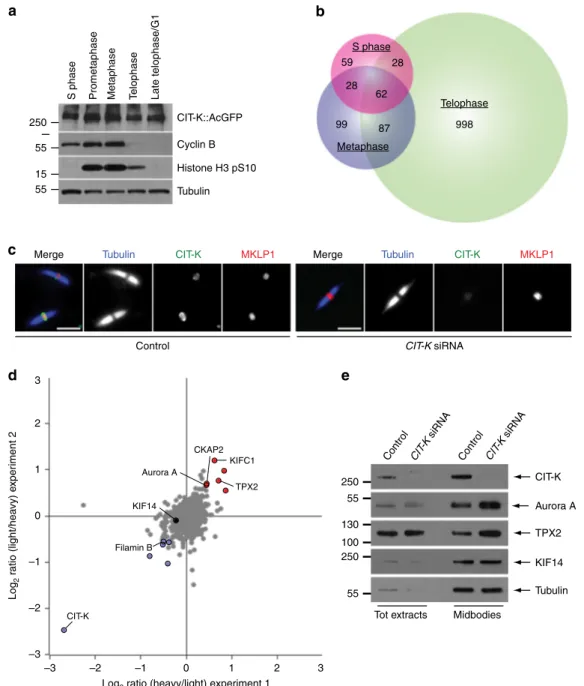
and telophase—by AP-MS (Fig.
1
a, b and Supplementary Data 1).
We found that the number of CIT-K interactors consistently
increased in telophase in three separate replicates, confirming the
important role of this kinase in cytokinesis (Fig.
1
b). Notably,
only 62 proteins, including the bait CIT-K and two of its known
partners, the contractile ring component Anillin and the kinesin
KIF14
12,13, were common to all three mitotic stages (Fig.
1
b and
Supplementary Data 1), indicating that our AP-MS methodology
identifies specific interactions and generates little noise.
To assess whether CIT-K was required for recruiting some of
these interactors to the midbody, we used SILAC-based
quantitative MS to characterize and compare the proteomes of
midbodies purified from telophase HeLa cells treated with either
CIT-K or control siRNAs (Fig.
1
c, Supplementary Fig. 1, and
Supplementary Data 2). Only minor differences in the levels of a
few midbody proteins were identified, including Filamin B, the
kinesin KIFC1, Aurora A kinase and its interactor TPX2 (Fig.
1
d,
Supplementary Table 1 and Supplementary Data 2). Although
some of these differences were significant and validated by
western blot (Fig.
1
e and Supplementary Table 1), overall our
results did not indicate a major role for CIT-K in recruiting
midbody proteins and reinforced the evidence that CIT-K has a
very specific function in the organization of this organelle.
Finally, it is important to point out that our midbody proteome
contains a significant higher number of proteins than a previous
study
14. This most likely reflects the considerable advancements
in MS technology in recent years rather than a difference in the
midbody purification protocols.
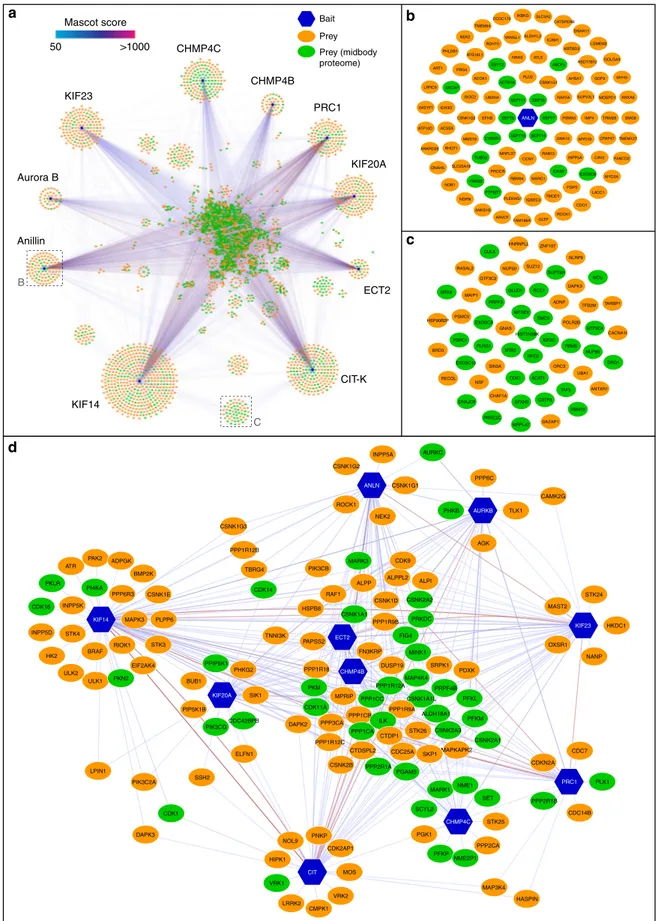
The midbody interactome has common and specific networks.
To further our knowledge of the interaction networks within the
midbody, we expanded our AP-MS experiments to include nine
additional baits, all proteins that are well known to play key roles
in midbody assembly and cytokinesis and display specific and
distinct localization patterns (Table
1
). AP-MS analysis of the
interactions of these ten baits in telophase revealed a complex
midbody interactome comprising almost 3000 proteins
(Supple-mentary Data 3, 4), which included the majority of midbody
proteome components and showed a Gene Ontology (GO)
enrichment profile very similar to the midbody proteome
char-acterized in our SILAC experiments (Fig.
2
and Supplementary
Data 4, 5). The overlap and similarity between the two datasets is
highly significant considering that they were obtained using two
completely different experimental procedures (see Methods). The
midbody interactome contains complex networks shared by
several baits as well as networks specific for each bait or for just a
few baits (Fig.
3
a–d). Interestingly, even proteins strictly related,
like the two ESCRT-III paralogs CHMP4B and CHMP4C,
showed distinct specific networks (Fig.
3
a). Analysis of the
interactome networks further confirmed the specificity and
selectivity of our AP-MS methodology. For example, the
con-tractile ring component Anillin presents a specific interaction
network that includes the vast majority of septin proteins
(Fig.
3
b), which are known to be recruited by Anillin to
midbody
15,16. Similarly, the mitotic kinase Polo-like kinase 1
(Plk1) was only identified with the bait PRC1 (Fig.
3
d), which
directly binds to and recruits Plk1 to the central spindle and
Our midbody interactome revealed a plethora of interactions
that can lead to the discovery of important structural and
regulatory networks present within this organelle. For example,
in the network specifically shared by CIT-K and its partner
KIF14, we identified the cyclin-dependent kinase 1 (Cdk1) and
the
microtubule
depolymerizing
kinesin
KIF2C/MCAK
(Fig.
3
c), both also found in the midbody proteome
(Supplementary Data 2 and 4). KIF2C regulates microtubule
dynamics during mitotic spindle assembly
19, but it has not
been implicated in cytokinesis. Cdk1, in complex with cyclin B,
is well known to promote mitotic entry and to regulate
multiple mitotic events until anaphase, when most of the
complex is inactivated through degradation of cyclin B.
However, a pool of Cdk1/cyclin B has been described to
accumulate at the midbody where it appears to promote
abscission
20. Our data not only indicate a potential role for
KIF2C in cytokinesis and confirm the presence and function of
Cdk1/cyclin B at the midbody, but also suggest that the
S phase Prometaphase Metaphase Telophase Late telophase/G1Histone H3 pS10 Tubulin Cyclin B CIT-K::AcGFP 15 55 250 55
a
c
b
d
250 55 100 130 250 55 CIT-K Aurora A TPX2 KIF14 Tubulin Control CIT -K siRNA Control CIT -K siRNATot extracts Midbodies
Merge Tubulin CIT-K MKLP1
Control CIT-K siRNA
Merge Tubulin CIT-K MKLP1
e
Log 2 r a tio (light/hea vy) e x per iment 2Log2 ratio (heavy/light) experiment 1
–3 –2 –1 0 1 2 3 Aurora A CKAP2 KIFC1 TPX2 KIF14 Filamin B CIT-K S phase Telophase Metaphase 62 998 59 99 28 87 28 –3 –2 –1 0 1 2 3
Fig. 1 CIT-K specifically interacts with a multitude of proteins in cytokinesis. a Western blot analysis of protein extracts from HeLa cells stably expressing a CIT-K::AcGFP transgene synchronized at different stages of the cell cycle. The blots were probed with antibodies against the proteins indicated to the right. Numbers on the left indicate the size, in kDa, of the protein ladder.b Proportional Venn diagram showing the number of proteins identified at each cell cycle stage by AP-MS using CIT-K::AcGFP as bait.c Midbodies purified from HeLa S3 cells treated with siRNAs directed against either a random sequence (control) orCIT-K were fixed and stained to detect tubulin, CIT-K, and MKLP1. Scale bars, 5 µm. d Logarithmic normalized protein ratios from two independent SILAC experiments were plotted against each other. Each point represents a single protein identified. Gray dots correspond to proteins that did not show any significant difference in abundance between control and CIT-K siRNA midbodies. Red and blue dots represent proteins that were either significantly enriched or less abundant after CIT-K depletion in both biological replicates (p value < 0.01; significance B test corrected by Benjamini-Hochberg method).e Western blot analysis of total protein extracts and midbodies purified from telophase HeLa S3 cells treated with siRNAs directed against either a random sequence (control) orCIT-K. The blots were probed with antibodies against the proteins indicated to the right. Numbers on the left indicate the size, in kDa, of the protein ladder. Source data for Fig.1a and e are provided as a Source Datafile
association with CIT-K and KIF14 might be important for their
localization and/or function.
PP1
β-MYPT1 controls microtubule dynamics in late
cytokin-esis. Cell division is regulated by posttranslational modifications,
including phosphorylation mostly mediated by serine/threonine
kinases and counteracting phosphatases. Although most kinases
involved in cytokinesis are known, the identity and function of
their opposing phosphatases is just emerging
4,21. To address this
nescience, we generated a midbody interactome serine/threonine
phosphorylation sub-network by extracting from the entire
interactome dataset proteins whose full names (Uniprot
field:
protein names) contained the terms kinase and phosphatase but
excluded those containing tyrosine (Fig.
3
d). The most frequent
and abundant phosphatases belong to the PP1 family
(Supple-mentary Table 2), and the top scores include the three PP1
cat-alytic subunits—α, β, and γ—and the PPP1R12A regulatory
subunit, also known as myosin phosphatase target subunit 1,
MYPT1. PP1γ was described to accumulate at the cleavage site
22and we found that all four PP1 phosphatases localized to the
midbody ring in late cytokinesis, and PP1β and MYPT1 also
accumulated at the cleavage furrow in early telophase (Fig.
4
a–d).
The signals detected by these antibodies are specific because they
were strongly reduced after siRNA treatments in both
immuno-fluorescence and western blot analyses (Fig.
4
a–e). We then
investigated if siRNA-mediated depletion of these phosphatases
caused cytokinesis failure. siRNA of PP1β and MYPT1 caused the
highest increases in multinucleation (a readout of cytokinesis
failure), 4.2- and 7.2-fold, respectively (Fig.
4
g, h). PP1α depletion
did not result in an increase of multinucleated cells and only a
very modest increase (1.6-fold) was observed after PP1γ siRNA
(Fig.
4
h). However, combined depletion of these two closely
related catalytic subunits resulted in a 2.8-fold increase in
multi-nucleated cells (Fig.
4
h), suggesting that they could act
redun-dantly and/or synergistically in cytokinesis. In sum, our results
indicated that, of all four phosphatases, PP1β and MYPT1 were
the two most strongly required for cytokinesis (Fig.
4
e, g, h),
which is consistent with the evidence that MYPT1 is a known
PP1β regulatory subunit
23. MYPT1 was reported to antagonize
Plk1 during mitotic spindle assembly and to be required for
cytokinesis
24, but its exact role in cytokinesis was not investigated,
probably assuming that it was required to de-phosphorylate the
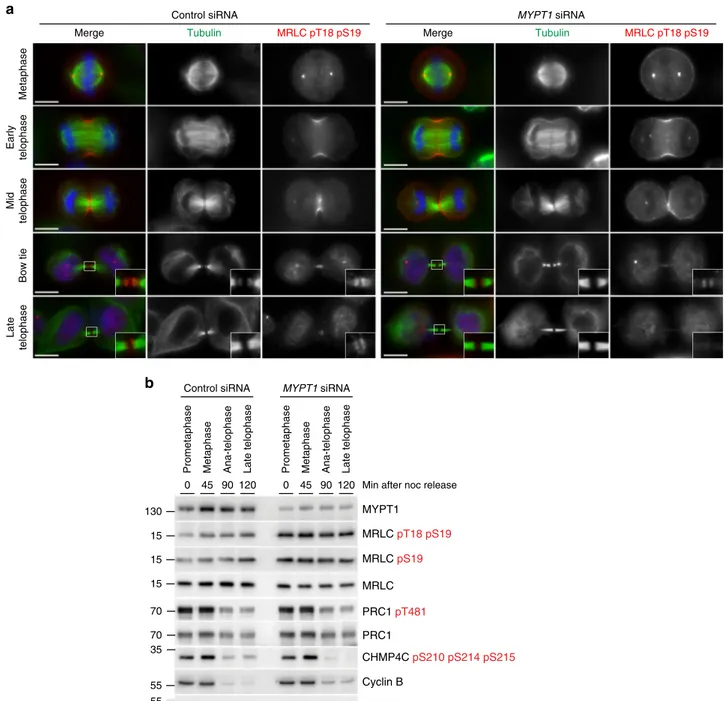
myosin regulatory light chain (MRLC) at the contractile ring. We
found that, indeed, the levels of both mono(pS19)- and di(pT18
pS19)-phosphorylated MRLC levels were elevated in MYPT1
depleted cells (Fig.
5
a, b), which had also an abnormal
cytoske-leton and numerous cortical blebs (Fig.
4
f). However, mitotic exit
was not affected after MYPT1 siRNA, as cyclin B levels dropped in
anaphase and dephosphorylation of two phospho-epitopes, PRC1
pT481
25and tri-phospho CHMP4C
26,27, known to occur upon
mitotic exit, was not affected (Fig.
5
b). MYPT1 siRNA cells could
successfully complete furrowing, although the central spindle
appeared longer and bent upwards in late cytokinesis (Fig.
5
a and
Supplementary Movies 1–4). Time-lapse analysis of chromosome
and microtubule dynamics during cell division revealed that
MYPT1 siRNA caused abnormal cortical contractility that did not
prevent furrow formation and ingression, albeit furrowing was
faster than in control cells (Fig.
6
a–c, and Supplementary
Movies 5–8), likely because of hyper-phosphorylated MRLC.
Notably, after completion of furrow ingression, MYPT1 siRNA
cells failed to maintain a robust central spindle, which became
very thin, bent and long, and sometime snapped (Fig.
6
a–h, and
Supplementary Movie 6). Consistent with these phenotypes, in the
majority of MYPT1 siRNA cells abscission either failed or did not
occur during the period of
filming (Fig.
6
b and Supplementary
Movie 7). Even when MYPT1 siRNA cells could successfully
separate, abscission was significantly delayed (Fig.
6
c).
Further-more, in MYPT1 depleted cells, the midbody was not properly
assembled as many of its components were stretched along the
central spindle and lost their precise arrangement: Aurora B
kinase spread from the midbody arms into the midbody core
(Fig.
6
d), the kinesin MKLP1 and the microtubule bundling
protein PRC1 failed to localize as two juxtaposed disks (Figs.
6
e–g
and
7
a), and CIT-K assembled into misshapen rings that often
collapsed (Fig.
6
e, h). Electron microscopy analysis showed that
MYPT1 siRNA midbodies contained fewer microtubules and an
abnormal midbody matrix compared with control cells (Fig.
6
i).
These central spindle and midbody defects are not linked to
abnormal cortical contractions or adhesion problems because they
were also observed in less adherent HeLa S3 cells, which do not
form cortical blebs after MYPT1 depletion (Supplementary Fig. 2).
Furthermore, very similar results were obtained in immortalized,
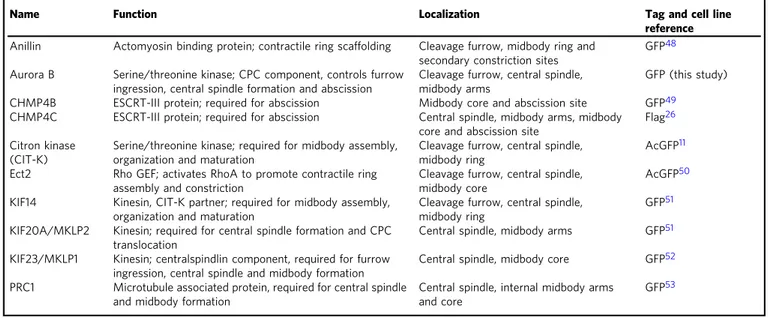
Table 1 Baits used in the AP-MS experiments for the characterization of the midbody interactome
Name Function Localization Tag and cell line
reference Anillin Actomyosin binding protein; contractile ring scaffolding Cleavage furrow, midbody ring and
secondary constriction sites
GFP48
Aurora B Serine/threonine kinase; CPC component, controls furrow ingression, central spindle formation and abscission
Cleavage furrow, central spindle, midbody arms
GFP (this study)
CHMP4B ESCRT-III protein; required for abscission Midbody core and abscission site GFP49
CHMP4C ESCRT-III protein; required for abscission Central spindle, midbody arms, midbody core and abscission site
Flag26
Citron kinase (CIT-K)
Serine/threonine kinase; required for midbody assembly, organization and maturation
Cleavage furrow, central spindle, midbody ring
AcGFP11
Ect2 Rho GEF; activates RhoA to promote contractile ring assembly and constriction
Cleavage furrow, central spindle, midbody core
AcGFP50
KIF14 Kinesin, CIT-K partner; required for midbody assembly, organization and maturation
Cleavage furrow, central spindle, midbody ring
GFP51
KIF20A/MKLP2 Kinesin; required for central spindle formation and CPC translocation
Central spindle, midbody arms GFP51
KIF23/MKLP1 Kinesin; centralspindlin component, required for furrow ingression, central spindle and midbody formation
Central spindle, midbody core GFP52
PRC1 Microtubule associated protein, required for central spindle and midbody formation
Central spindle, internal midbody arms and core
Midbody proteome Midbody interactome 726 1230 1735
a
b
0 1 2 3 Fold enrichment 4 5 6 Proteome InteractomeFig. 2 The midbody proteome and interactome share many proteins and have similar GO enrichment profiles. a Proportional Venn diagram showing the number of proteins identified in the midbody proteome and interactome. The majority of midbody proteome proteins (62.9%) are contained in the midbody interactome.b Heat map showing the GO annotation enrichment profiles of the midbody proteome and of the midbody interactome. GO enrichment profiles were analyzed using PANTHER under the category GO-slim biological process. Overrepresented GO terms are shown in shades of red while underrepresented GO terms are shown in shades of blue, according to their fold enrichment as indicated in the color scale bar at the right. Only Bonferroni-corrected results forp < 0.05 were considered (see Supplementary Data 5)
RFC2 KIF2C SMC3 HIST1H2BK MTA2 MTREX GNAS GTF3C2 NLRP9 NUP50 RASAL2 ZNF107 SUPT5H SUZ12 HNRNPLL CUL3 MCU PRPF3 DAPK3 RCC1 GLUD1 TFB2M ADNP MAIP1 MTA3 TARBP1 ANTXR1 POLR2B GTF3C4 CACNA1I UBA1 DRG1 NUP88 RBM5 TAF5 ORC3 PSPC1 BRD3 PSMC5 EXOSC10 SIN3A HSP90B2P EXOSC3 PLRG1 MRPL47 RBM10 PRRC2C DAZAP1 CHAF1A SFXN3 CSTF3 DNAJC9 RECQL NSF CDK1 ACAT1 FAM186A ARVCF PLEKHG1 ANKS1B NGRN PTPMT1 ANKRD26 ACSS3 ATP10D IDH3G SRCAP RHOT1 GIGYF1 LRRC9 ESYT2 ACTR1A ACOX1 PRG4 ART1 NEK2 ATG16L1 NRAS RDH10 IKBKG TMEM64 PHLDB1 CCDC170 VANGL1 CSNK1G2 MRPL37 UBXN4 CYB5R1 TUBG2 SEPT11 EFHB SEPT10 MMS19 SEPT8 ISOC2 DNAH5 SLC25A18 NOB1 FARSB PROCR RBM34 ABCF2 PLD2 MYH3 CSNK1G1 ATL3 AHSA1 HSD17B12 GOLGA3 GDF9 ANXA6 CFAP47 FANCD2 SMG8 TRIM26 TMEM127 MOSPD1 LSMEM2 SLC5A2 CATSPERB ICAM1 ALDH1L2 DNAH11 KBTBD3 ANLN IMP4 RAP2A PSMA5 SUPV3L1 SEPT6 SEPT7 ROCK1 GLTP IQSEC3 IDH3B FSIP2 CDO1 MYO3A LACC1 TMOD1 EXOSC6 MARC1 CAV2 CCNY GNA12 SEPT14 MYO10 INPP5A RAB15 KIF14 CIT-K KIF20A PRC1 KIF23 Aurora B Anillin CHMP4C CHMP4B ECT2
a
c
b
Bait Prey Prey (midbody proteome)d
STK4 ULK2 INPP5D CDK16 ATR PKLR HK2 INPP5K ULK1 BRAF PI4KA KIF14 PAK2 CSNK1E ADPGK RIOK1 BMP2K MAPK3 EIF2AK4 STK3 PLPP6 PKN2 PPP6R3 PPP1R12B PHKG2 KIF20A BUB1 PIP5K1B TBRG4 PPIP5K1 SIK1 CSNK1G3 TNNI3K CDK14 CHMP4B PPP1R18 PIK3CB ECT2 PKM RAF1 PAPSS2 HSPB8 PRPF4B SRPK1 MAP4K4 DUSP19 PPP1R12A PDXK MPRIP CDK11A PPP1CC PPP1CB CSNK1A1L ALDH18A1 PPP1R9A PFKL PPP2R1B CDKN2A PRC1 PLK1 CDC14B CDC7 ELFN1 PPP1R12C PIK3CGCDC42BPB DAPK2 PPP3CAPFKP PPP2CA MAP3K4 STK25 PGK1 NME2P1 CHMP4C SCYL2 HASPIN MAPKAPK2 MARK1 CSNK2A1 NME1 SET CSNK2A3 PFKM VRK1 VRK2 PNKP LRRK2 CIT MOS CDK2AP1 HIPK1 NOL9 CMPK1 LPIN1 SSH2 CDK1 DAPK3 PIK3C2A CSNK2B PPP1CA PPP2R1A PGAM5 CDC25A ILK STK26 CTDP1 CTDSPL2 SKP1 AURKB TLK1 CAMK2G AGK PPP6C CSNK1G1 PHKB ANLN AURKC INPP5A ROCK1 NEK2 CSNK1G2 HKDC1 OXSR1 KIF23 STK24 MAST2 NANP FIG4 FN3KRP PRKDC MINK1 PPP1R9B CSNK1A1 ALPI CSNK1D ALPP ALPPL2 CSNK2A2 CDK9 MARK3 Mascot score 50 >1000 B C
Fig. 3 The midbody interactome comprises common and specific networks. a Diagram illustrating the entire midbody interactome. Baits are indicated with blue hexagons, while preys are represented as ovals, either in green, if they were also found in the midbody proteome, or in orange. The edges connecting the network nodes are colored according to their Mascot scores as indicated in the color scale bar at the top left. Preys shared by multiple baits are clustered in the center.b Enlargement of the Anillin-specific sub-network shown in the corresponding inset in a. c Enlargement of the baits shared specifically by CIT-K and KIF4 shown in the corresponding inset in a. d Diagram representing the phosphorylation sub-network. All nodes are labeled with their primary gene names according to the UniProt database (https://www.uniprot.org)
non-transformed RPE-1 cells (Supplementary Fig. 3), indicating a
general requirement for MYPT1 in cytokinesis in different cell
types. Finally, almost identical phenotypes were observed after
PP1β siRNA (Fig.
4
b and Supplementary Fig. 4), further
sup-porting that MYPT1 is acting as a regulatory subunit for PP1β in
late cytokinesis.
PP1
β dephosphorylates the centralspindlin component
MKLP1. Central spindle assembly depends on various
micro-tubule associated proteins (MAPs)
2, including two key protein
complexes: centralspindlin, a hetero-tetramer composed of two
MKLP1 and two RacGAP1 subunits, and the PRC1-KIF4A
complex. These MAPs have been shown to interact and cooperate
a
b
d
c
Merge PP1α Tubulin Merge PP1β Tubulin
Merge PP1γ Tubulin Merge MYPT1 Tubulin
Merge Tubulin DNA
Control siRNA
MYPT1
siRNA
f
g
h
e
Merge Tubulin MRLC pT18 pS19 DNAControl siRNA MYPT1 siRNA Tubulin 55 130 MYPT1 Control MYPT1 siRNA Control PP1 α PP1 β PP1 γ siRNA Tubulin PP1γ PP1α PP1β 55 25 25 25 PP1 α siRNA Early telophase Abscission Mid telophase Late telophase Control PP1 β siRNA Early telophase Abscission Mid telophase Late telophase Control MYPT1 siRNA Early telophase Abscission Mid telophase Late telophase Control PP1 γ siRNA Early telophase Abscission Mid telophase Late telophase Control % Multinucleate cells MYPT1 PP1α Control PP1β PP1γ siRNA 20 15 10 5 0 PP1α+γ * * ** ns ns p = 0.8 p = 0.2 p = 0.01 p = 0.004 p = 0.01
to increase the robustness of the central spindle
28. To understand
the molecular mechanisms underpinning the phenotypes
observed after MYPT1-PP1β depletion, we investigated whether
centralspindlin could be one of the substrates of this phosphatase.
Centralspindlin clustering at the central spindle midzone is
necessary for its localization and function and requires
phos-phorylation of the evolutionarily conserved MKLP1 S708 residue
by Aurora B
29. MYPT1 depletion caused a significant increase in
MKLP1 S708 phosphorylation at the midbody (Fig.
7
a, b),
reduced the association of this kinesin with its RacGAP1 partner
and almost completely abolished its interaction with PRC1 and
PP1β, but only mildly affected the association with CIT-K
(Fig.
7
c). MKLP1 contains a highly conserved VQF motif 80
amino acids downstream of S708 (aa 786–788; Fig.
7
d and
Sup-plementary Fig. 5a) that partially matches the RVxF consensus
binding site for PP1 catalytic subunits
30. We found that full
length MKLP1 and PP1β interacted when co-expressed in yeast
(Fig.
7
e) and that the MKLP1 C-terminal region (aa 620–858)
purified from bacteria was also able to pull down PP1β in vitro
(Supplementary Fig. 5b-d), indicating that PP1β directly binds to
the MKLP1 C-terminus. MKLP1
620–858was dephosphorylated at
S708 by PP1β in vitro (Fig.
7
f, g) and when the VQF residues
were mutated to AQA the binding of MKLP1 to PP1β was
reduced (Fig.
7
e and Supplementary Fig. 5b-d) and MKLP1
620–858dephosphorylation by PP1β in vitro was less efficient (Fig.
7
f, g).
To assess the role of MKLP1 dephosphorylation by PP1β in vivo,
we generated cell lines stably expressing GFP-tagged versions of
either wild type MKLP1 or of the mutant containing the AQA
mutation at residues 786–788. Silencing MKLP1 by using an
siRNA directed against its 3′UTR that is absent in the GFP-tagged
transgenes severely impaired central spindle assembly and
clea-vage furrow ingression (Fig.
7
h, top panels). The very few MKLP1
siRNA cells that managed to complete furrowing had very thin
central spindles and abnormal PRC1 localization (Fig.
7
h),
resembling MYPT1 siRNA cells (Fig.
6
). The MKLP1
AQAmutant
rescued cytokinesis failure after depletion of endogenous MKLP1
much less efficiently than the wild-type counterpart (Fig.
7
h, i).
Importantly, MKLP1
AQAcould successfully rescue the initial
stages of cytokinesis, but in late telophase central spindles
appeared thin and PRC1 spread along central spindle
micro-tubules (Fig.
7
h, bottom panels), again similar to MYPT1 siRNA
cells (Fig.
6
). Together, these results indicate that PP1β
depho-sphorylates MKLP1 at S708 in late cytokinesis via association
with the VQF motif and that this dephosphorylation is important
for MKLP1 function in late cytokinesis.
Discussion
Our characterization of the midbody interactome and proteome
represents a significant advance in understanding the complex
and intricate protein–protein interactions of this organelle. Our
interactome is derived from experimental data and provides a
much more realistic and accurate picture than a previous
bioin-formatics study
31. The overlap and highly similar GO enrichment
profiles of the interactome and proteome datasets (Fig.
2
) strongly
support the validity of our approach and methodology. As
expected, both datasets are enriched in proteins involved in
mitosis and cytokinesis, but they also show a significant
enrich-ment in proteins involved in chromatin assembly and mRNA
processing and translation (Fig.
2
and Supplementary Data 4, 5).
Although unpredicted, these
findings are consistent with the
identification of histones at the midbody
32and the evidence that
the RNA-binding protein ATX-2 is involved in
posttranscrip-tional regulation of PAR-5 levels at the midbody
33. They also
highlight the possibility that the midbody may function as a
translational hub, which could indicate a mechanism by which
asymmetric inheritance of the midbody imparts genetic
infor-mation in cell fate and carcinogenesis
34,35. The identification of
common and specific networks of midbody proteins could serve
to dissect main regulatory mechanisms and pathways for
mid-body function as well as to identify specific roles for each of the
ten baits used in our study. Together, these specific and common
interaction networks will undoubtedly provide an extremely
valuable resource for understanding the emerging multifaceted
biological roles of this organelle. However, our interactome
analysis is limited to one cell type and it is possible that different
proteins and protein–protein interactions exist in midbodies of
different cell types. Nevertheless, our study provides a molecular
blueprint of the interaction networks in the midbody, which can
serve to identify major nodes, hubs and pathways that may
facilitate the analysis and comparison of midbodies in other
cellular and developmental contexts.
The most abundant and frequent phosphatases identified in
our midbody interactome are members of the PP1 family (Fig.
3
d
and Supplementary Table 2). This was somehow unexpected as
only PP2A phosphatases had been previously implicated in the
regulation of cytokinesis
36,37and just very recently a role in
abscission was described for PP1γ and its targeting co-factor
RIF1
38, which was also identified in both our midbody
inter-actome and proteome (Supplementary Data 4). Therefore, our
results expand the repertoire of PP1 functions during mitotic exit
and indicate that MYPT1-PP1β is required to regulate the pace of
cleavage furrow ingression and to form strong and stable central
spindles and midbodies in late cytokinesis (Fig.
6
a–c). Cytokinesis
failure after MYPT1 siRNA occurs predominantly at a late stage,
after completion of furrow ingression (Fig.
6
b), highlighting an
unanticipated role of MYPT1 in this phase of cell division. Our
results indicate that MYPT1-PP1β regulates the dynamics of the
two major cytokinetic structures, the actomyosin contractile ring
and the central spindle, by de-phosphorylating different
Fig. 4 PP1 phosphatases localize to the midbody and depletion of PP1β and MYPT1 causes cytokinesis failure. a–d HeLa cells were fixed and stained to detect to detect DNA (blue in the merged panels), tubulin, and PP1α (a), PP1β (b), PP1γ (c), and MYPT1 (d). For RNAi depletions, HeLa cells were treated with siRNAs directed against each of the three PP1 catalytic subunits or MYPT1 and after 48 h werefixed and stained to detect the same epitopes as described above. DNA condensation and shape and thickness of microtubule bundles at the intercellular bridge were used as criteria to stage telophase cells. Insets show a 3× magnification of the midbody. Scale bars, 10 µm. e HeLa Kyoto cells were treated with siRNAs directed against either a random sequence (control) or each of the three PP1 catalytic subunits (left) or MYPT1 (right) and after 48 h proteins were extracted and analyzed by western blot to detect the indicated proteins. The numbers on the left indicate the sizes in kDa of the molecular mass marker.f HeLa cells were treated with siRNAs directed against either a random sequence (control) orMYPT1 and after 48 h were fixed and stained to detect DNA, tubulin, and di-phosphorylated MRLC. Note thatMYPT1 siRNA cells show abnormal cell and nuclear shape, cortical blebs (arrowheads) and disorganized microtubule and actomyosin cytoskeletalfilaments. Scale bars, 10 µm. g HeLa cells were treated with siRNAs directed against either a random sequence (control) or MYPT1 and after 48 h werefixed and stained to detect DNA and tubulin. The arrows indicate multinucleate cells. Scale bars, 10 µm. h Quantification of multinucleate cells obtained after siRNA of the three PP1 catalytic subunits or MYPT1. More than 500 cells were counted inn ≥ 3 independent experiments. Bars indicate standard errors. *p < 0.05, **p < 0.01 (Mann–Whitney U test). Source data for Fig.4e and h are provided as a Source Datafilesubstrates. In line with its established role, our data indicate that
MYPT1-PP1β dephosphorylates MRLC to control the
con-tractility of the actomyosin ring during furrow ingression (Fig.
5
),
but also unexpectedly reveal that MYPT1-PP1β controls the
dynamics of central spindle microtubules in late cytokinesis
(Fig.
6
). Our results suggest that the latter could be mediated, at
least in part, through dephosphorylation of MKLP1, and most
likely of other MAPs, in order to antagonize Aurora B and
possibly other mitotic kinases, like Plk1 and CIT-K, in late
cytokinesis (Figs.
6
and
7
). We surmise that MKLP1
dephosphorylation by PP1β modulates centralspindlin clustering
in order to promote different functions of this complex in late
cytokinesis, like its close association with other midbody proteins
such as PRC1. This, in combination with dephosphorylation of
additional midbody components, would contribute to
MYPT1-PP1β-mediated regulation of central spindle microtubule
dynamics and midbody architecture in late cytokinesis. In sum,
our
findings indicate that temporal changes in the spatial
dis-tribution of kinases and counteracting phosphatases during
cytokinesis control the phosphorylation status, and consequently
Mid
telophase
Bow tie
Early
telophase
Control siRNA MYPT1 siRNA
Late
telophase
Metaphase
Merge Tubulin MRLC pT18 pS19 Merge Tubulin MRLC pT18 pS19
a
b
Tubulin Cyclin B 55 55Min after noc release
Control siRNA MYPT1 siRNA
130 MYPT1
15
15 MRLC pT18 pS19
MRLC pS19 15
Prometaphase Metaphase Ana-telophase Late telophase
0 45 90 120
PRC1 PRC1 pT481 Prometaphase Metaphase Ana-telophase Late telophase
0 45 90 120 70 70 MRLC 35 CHMP4C pS210 pS214 pS215
Fig. 5MYPT1 siRNA increases the levels of phosphorylated MRLC, but does not impair furrowing and dephosphorylation during mitotic exit. a HeLa cells were treated with siRNAs directed against either a random sequence (control) orMYPT1 and after 48 h were fixed and stained to detect DNA (blue in the merged panels), tubulin, and di-phosphorylated MRLC pT18 pS19. DNA condensation and the shape and thickness of microtubule bundles at the intercellular bridge were used as criteria to stage telophase cells. Insets show a 3× magnification of the midbody. Scale bars, 10 µm. b Time course analysis of protein expression and phosphorylation during mitotic exit after MYPT1 depletion. HeLa cells were treated with siRNAs directed against either a random sequence (control) orMYPT1 and after 24 h synchronized by thymidine/nocodazole block. Cells were collected at the indicate time points after nocodazole (noc) release and proteins extracted and used in western blot analysis to identify the proteins and phospho-epitopes indicated to the right. The numbers on the left indicate the sizes of the molecular mass marker. Source data for Fig.5b are provided as a Source Datafile
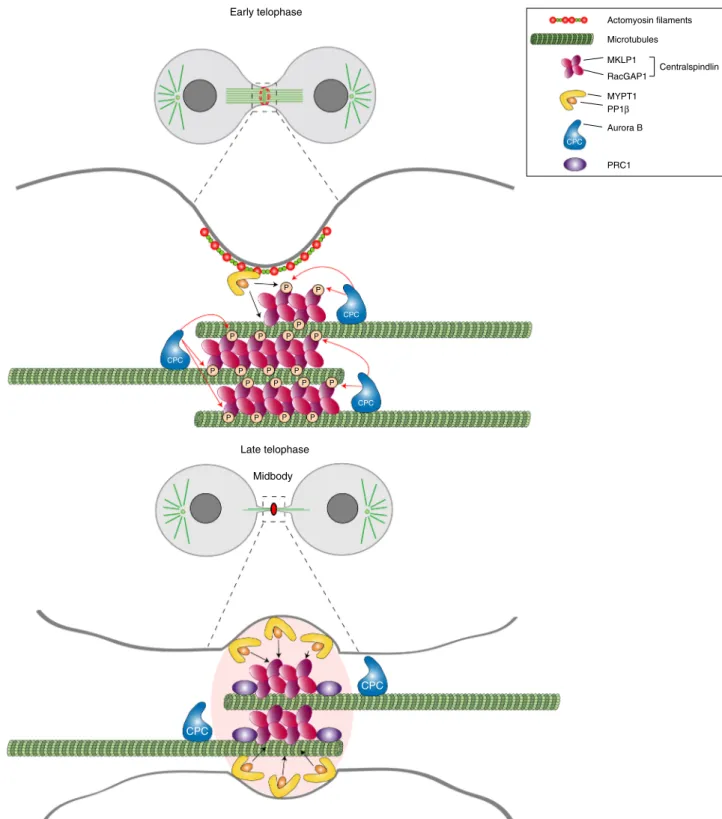
the activity, of cytokinesis proteins as illustrated in Fig.
8
. In early
telophase MYPT1-PP1β localizes to the cortex of the ingressing
furrow (see Fig.
4
) where it can de-phosphorylate MRLC to
antagonize Rho kinase, but has no or little access to the
cen-tralspindlin pool that accumulate at the central spindle midzone,
which is instead highly phosphorylated by Aurora B and can
therefore form clusters. However, after completion of furrow
ingression, MYPT1-PP1β accumulates at the midbody ring
whereas Aurora B is slowly degraded and accumulates at the
midbody arms. This allows dephosphorylation of MKLP1 at S708,
which could strengthen the association of centralspindlin with
other midbody proteins, in particular PRC1. This change in the
phosphorylation status of MKLP1, and most likely of other
midbody components, is important for maintaining a robust
central spindle and for establishing proper midbody architecture.
Finally, our data show that MYPT1 is required for the
asso-ciation of MKLP1 and PP1β in telophase cells (Fig.
7
c) and that
PP1β requires the VQF sub-optimal binding motif of MKLP1 to
select its target S708 residue (Fig.
7
). However, our current
knowledge of PP1 function indicates that PP1β cannot
simulta-neously interact with both MYPT1 and MKLP1 through their (R)
VxF motifs. One possible explanation could be that MYPT1 is
Control
MYPT1
siRNA
Merge Tubulin CIT-K
Late telophase Merge CIT-K MKLP1 Control MYPT1 siRNA Merge Aurora B Late telophase Control MYPT1 siRNA Late telophase
a
b
c
d
e
Late telophase Control MYPT1 siRNA Late telophase Control MYPT1 siRNA Merge Tubulin Tubulin PRC1f
g
h
Merge MKLP1 PRC1i
Control n = 23 n = 14 n = 11 MYPT1 siRNA MM Control n = 59 MYPT1 siRNA n = 52 40% 50% 30% 20% 10% 0% 60% 70% 80% 90% 100% Complete No abscission Early failure Broken central spindle Control MYPT1 siRNA 0 5 10 15 20 25Furrow completion (min)
**** Control MYPT1 siRNA 0 50 100 150 200 Abscission (min) * Control MYPT1 siRNA Tubulin DNA 0 6 10 30 90 120 144 144 34 10 6 –2 –2 0
necessary to initially bring PP1β in proximity of MKLP1, but then
a pool of PP1β could dissociate from MYPT1 to interact with
MKLP1 through its less efficient VQF site to de-phosphorylate
S708. Future studies can clarify whether such a two-step
mechanism of action does indeed exist and how widely it is
employed by PP1 catalytic subunits.
Methods
Molecular biology. The coding sequence for PP1β was amplified by PCR using the Addgene plasmid 31677 as a template to create an entry clone in pDONR221 using Gateway technology according to manufacturer’s instruction (ThermoFisher). The plasmid pEGFP-C1::MKLP1 was previously described29. The QuikChange Light-ning Site-Directed Mutagenesis Kit (Agilent) was used to generate the PP1β phosphatase dead mutant (harboring the mutations D94N and H124N) and the pEGFP-C1::MKLP1AQAplasmid containing two substitutions in the VQF
786–788 binding site for PP1β. The sequence of all DNA constructs were verified by sequencing (Source BioScience). All oligonucleotides used in this study are listed in Supplementary Table 3.
Cell culture and treatments. HeLa Kyoto (kind gift from Ina Poser, Max Planck Institute of Molecular Cell Biology and Genetics) were maintained in DMEM (Sigma) containing 10% fetal bovine serum (Sigma) and 1% pennicillin/strepto-mycin (Invitrogen) at 37 °C and 5% CO2. HeLa cell lines stably expressing GFP or Flag-tagged transgenes (listed in Table S2) were cultured in the same medium with the addition of appropriate selection antibiotics (puromycin and/or G418). The HeLa Kyoto cell line stably expressing GFP::tubulin and H2B::mCherry was described39. hTERT RPE-1 cells (ATCC) were cultured in DMEM/F12 (Sigma) containing 2 mM L-glutamine, 10% fetal bovine serum (Sigma), and 1% penni-cillin/streptomycin (Invitrogen) at 37 °C and 5% CO2. HeLa S3 (ATCC) were culture in DMEM (Sigma) containing 2 mM L-glutamine, 10% fetal bovine serum (Sigma), and 1% pennicillin/streptomycin (Invitrogen) at 37 °C and 5% CO2.
For RNA interference the following siRNAs were used: scrambled sequence control: 5′-AACGTACGCGGAATACTTCGA-3′, CIT-K: 5′-ATGGAAGGCACTA TTTCTCAA-3′, PP1α: 5′-AAGAGACGCTACAACATCAAA-3′, PP1β: 5′-ACGA GGAUGUCGUCCAGGAA-3′ and 5′-GUUCGAGGCUUAUGUAUCA-3′, PP1γ: 5′-ACAUCGACAGCAUUAUCCAA-3′ and 5′-AGAGGCAGUUGGUCACUCU-3′, MYPT1: 5′-AGUACUCAACCAUAAUUAA-5′-AGAGGCAGUUGGUCACUCU-3′, MKLP1 3′UTR: 5′-AAGCAG UCUUCCAGGUCAUCUUU-3′, using Lipofectamine RNAiMAX (Invitrogen) following the manufacturer’s instructions. All these siRNAs have been previously validated for specificity and efficacy10,24,29,40.
Cell lines stably expressing MKLP1 or MKLP1AQAconstructs were generated by transfecting 2 × 10⁶HeLa Kyoto cells with 10μg of plasmid DNA using the Neon Transfection System (ThermoFisher) using manufacturer’s instructions. After 48 h, cells in 100 mm culture dish were selected in complete selective medium containing 400μg ml−1G418 for ~2 weeks until colonies became visible. Individual colonies were picked, cultured under resistance and tested for expression of the construct by western blot and immunofluorescence. To generate the cell line expressing Aurora B::GFP, HeLa cells (originally from ATCC) were transfected with the mammalian expression vector pcDNA3.1 containing the coding sequence of human Aurora B, C-terminally fused to GFP, using FuGENE transfection reagent according to the manufacturer’s instructions. Twenty-four hours posttransfection G418 was added to the medium (500 µg ml−1), and cells incubated for a further 7 days. The population was then expanded and FACS sorted on the GFP signal, and maintained under G418 selection.
HeLa cells were synchronized in S phase by double thymidine block. Cells werefirst arrested in S phase by the addition of 2 mM thymidine
(Sigma-Aldrich) for 19 h, washed twice with phosphate-buffered saline (PBS) and released for 5 h in fresh complete medium. After release, cells were incubated again for 19 h in complete medium containing 2 mM thymidine, washed twice with PBS, released in fresh medium for 10 min, harvested by centrifugation at 1000 × g for 3 min, washed in PBS, frozen immediately in dry ice and stored at−80 °C. To synchronize HeLa cells in metaphase and telophase, we used a thymidine-nocodazole block and release procedure. Cells werefirst arrested in S phase by a single thymidine treatment as described above, washed twice with phosphate-buffered saline (PBS) and released for 5 h in fresh complete medium. Cells were then cultured for additional 13 h in fresh complete medium containing 50 ng ml−1nocodazole (Sigma-Aldrich) and then harvested by mitotic shake-off. Mitotic cells were washed three times with PBS, and either released for 30 min in fresh medium containing 10μM MG132 (Sigma) to collect cells in metaphase or released in just fresh medium for 90 min to collect cells in telophase. Cells were then harvested by centrifugation and frozen in dry ice.
Midbody purification. For SILAC experiments, HeLa S3 cells were grown in DMEM lacking Arg and Lys (Invitrogen), and supplemented with 10% (v/v) 1 kDa dialyzed FBS (Sigma-Aldrich), 1% (v/v) penicillin/streptomycin and either unla-beled Arg and Lys or L-[13C6,15N4] Arg and L-[13C6,15N2] Lys (Cambridge Isotope Laboratories) at concentrations of 42μg ml−1(Arg) and 72μg ml−1(Lys). Trypsin-EDTA was used to split cells as usual. However, as this solution might contain some non-isotopically labeled amino acids, detached cells were pelleted at 250 × g for 3 min and washed once with sterile phosphate-buffered saline (PBS) before being re-seeded in fresh medium.
To purify midbodies, 2.8 × 10⁷HeLa S3 cells were plated into three three-layer tissue cultureflasks, 525 cm2(BD Biosciences), for a total of 8.4 × 10⁷cells per condition. Cells were synchronized using the thymidine-nocodazole block and release procedure described in the previous section. After nocodazole washout cells were incubated for 2 h in fresh medium containing 10μM MG132 (Sigma-Aldrich) to further increase the effectiveness of the synchronization, and then incubated at 37 °C for 80 min after release from MG132. Just before collection, 5μg ml−1taxol (Sigma-Aldrich) was added to the medium for 2–3 min to stabilize microtubules in vivo. Cells were then transferred into a 50 ml conical tube and collected by centrifugation at 250 × g for 3 min. After one wash with pre-warmed H2O, cells were gently resuspended in 25 ml of swelling solution (1 mM PIPES pH 7.0, 1 mM MgCl2, 5μg ml−1taxol and Roche Complete Protease Inhibitors) and immediately centrifuged at 250 × g for 3 min. The cell pellet was then resuspended in 40 ml of lysis buffer (1 mM PIPES pH 7, 1 mM EGTA, 1% [v/v] NP-40, 5μg ml−1taxol, 3 U ml−1DNAse I, 10μg ml−1RNAse A, 1 U ml−1micrococcal nuclease, and Roche Complete Protease Inhibitors) and vortexed vigorously for 1 min. After the addition of 0.3 volumes of cold 50 mM 2-(N-mopholino)ethanesulfonic acid (MES) pH 6.3, the sample was incubated on ice for 20 min and then centrifuged at 200 × g for 10 min at 4 °C. The supernatant was transferred to a new tube and centrifuged at 650 × g for 20 min at 4 °C to pellet midbodies. The midbody pellet was then resuspended in 4 ml of 50 mM MES pH 6.3 and centrifuged through a 25 ml glycerol cushion (40% [w/v] glycerol diluted in 50 mM MES pH 6.3) at 2800 × g for 45 min at 4 °C. After removal of the glycerol cushion, the midbody pellet was washed with 2 ml of 50 mM MES pH 6.3, transferred to a 15 ml conical tube and centrifuged at 2800 × g for 20 min at 4 °C. For mass spectrometry (MS) analyses, after removing as much liquid as possible, the midbody pellet was resuspended in 100μl of 50 mM MES pH 6.3 and 900 μl of cold acetone were added to the tube, which was then vortexed and incubated for 10–15 min at −20 °C. The sample was then centrifuged at 3500 × g for 10 min at 4 °C, the supernatant was carefully discarded and the pellet was left to dry for 5–10 min at room temperature (RT). Precipitated proteins were stored at−80 °C until further processing.
Fig. 6 MYPT1 is required for central spindle stability and midbody architecture. a Images from time-lapse recordings of HeLa Kyoto cells expressing GFP:: tubulin and H2B::mCherry treated with control siRNAs orMYPT1 siRNA for 30 h before filming. Time is in min relative to anaphase onset. The arrow in the 90 min control cell marks the abscission site, while the arrowhead in the 144 minMYPT1 siRNA cell marks the rupture of the central spindle. Scale bar, 10µm. b Graph showing the frequency of phenotypes observed in the time-lapse recordings described in a. Categories: no abscission indicates cells that either failed abscission or failed to fully separate duringfilming (Supplementary Movie 7); early failure indicates cells that failed to form a midbody and cleavage furrows collapsed (Supplementary Movie 8); broken central spindles indicates cells in which the central spindle broke before abscission occurred, like in the cell shown ina and in Supplementary Movie 6;n = 59 independent control cells and n = 52 MYPT1 siRNA independent cells were counted. c Scatter plots showing quantification of furrow ingression (from anaphase onset to furrow completion); n = 57 independent control cells and n = 46 MYPT1 siRNA independent cells were counted. Abscission (from furrow completion to abscission) times measured in the time-lapse recordings described ina.n = 57 independent control cells and n = 19 MYPT1 siRNA independent cells that successfully completed abscission were counted. Horizontal bars indicate medians; ****p < 0.0001 (student’s T-test); *p < 0.05 (Mann–Whitney U test). d–h HeLa Kyoto cells (control) or MYPT1 siRNA were stained to detect the indicated epitopes and DNA. DNA condensation and the size of microtubule bundles at the intercellular bridge were used to stage telophase cells. Insets show a 3× magnification of the midbody. The arrow in d marks a bend in the central spindle. Scale bars, 10 µm. i Electron micrographs of midbodies in HeLa cells control orMYPT1 siRNA for 48 h. n = 23 independent control cells and n = 25 MYPT1 siRNA independent cells. The arrowhead marks an abnormal protrusion of the midbody matrix (MM). Scale bars, 1µm. Source data for Fig.6b, c are provided as a Source Datafile
Affinity purification (AP). For large-scale AP of GFP-tagged proteins and asso-ciated partners, cells were plated at 1/6 confluence in either six 175 cm2flasks or in two three-layer 525 cm2tissue cultureflasks (BD Biosciences) and after 24 h synchronized at different stages of the cell cycle as described in the previous section, collected, washed in PBS and cell pellets stored at−80 °C. Each cell pellet was resuspended in 5 ml of lysis buffer (20 mM Tris-HCl, 150 mM NaCl, 2 mM MgCl2, 1 mM EGTA, 0.1% [v/v] NP-40, 1 mM DTT, 5% [v/v] glycerol and Roche
Complete Protease Inhibitors) and homogenized using a high-performance dis-perser (Fisher). The homogenate was clarified by centrifugation at 750 × g for 15 min at 4 °C and the supernatant was incubated with 200μl of GFP-Trap_MA magnetic beads (ChromoTek) for 4 h on a rotating wheel at 4 °C. Beads were then washed four times using a magnetic stand in 10 ml of lysis buffer for 5 min on a rotating wheel at 4 °C, transferred to a new tube and washed one more time in 10 ml of PBS. After removing as much liquid as possible, beads were stored at
Control MYPT1 siRNA Merge Tubulin MKLP1 pS708 0 2 4 6
MKLP1 pS708 normalized fluorescence intensity (a.u.) 1 3 5 p = 5.3 × 10⁻⁶ Control siRNA (n = 32) MYPT1 siRNA (n = 35) 0 0.5 2.0 4.0 1.0 1.5 2.5 3.5 4.5 3.0 p = 0.27 Merge Tubulin MKLP1 Control MYPT1 siRNA
Control siRNA MYPT1
siRNA
Control siRNA MYPT1
siRNA Tubulin PRC1 GFP-MKLP1 PP1β 130 35 70 55
Extracts pull downGFP
250 CIT-K MYPT1 130 70 RacGAP1
a
b
c
d
e
P Motor domain CoilAurora B (S708) PP1 binding site (786 VQF 788) MKLP1 1 856
f
g
h
i
Control siRNA (n = 38) MYPT1 siRNA (n = 42) No transgene GFP::MKLP1 GFP::MKLP1AQA Control siRNA MKLP1 3’UTR siRNA 20 15 10 5 0 25 % Multin ucleate cells 30 45 35 Fold increase 7.3 2.5 6.0 MBP pull down Extracts 55 70 100 130 35 55 GST::PP1β MBP::MKLP1 MBP + GST::PP1 β MBP::MKLP1 + GST MBP::MKLP1 + GST::PP1 β MBP::MKLP1 AQA + GST::PP1 β MBP + GST::PP1 β MBP::MKLP1 + GST MBP::MKLP1 + GST::PP1 β MBP::MKLP1 AQA + GST::PP1 β GST MBP MBP::PP1β Min MBP::PP1βdead 0 10 20 40 60 0 10 20 40 60 GST ::MKLP1 620–858 Anti-MKLP1 pS708 Anti-GST Anti-MKLP1 pS708 Anti-GST AQA WT 40% 50% 30% 20% 10% 0% 60% 70% 80% 90% 100% WT AQA 40 10 20 30 50 60 0 Minutes GST::MKLP1620–858 Nor maliz ed MKLP1 pS708 MKLP1 normalizedfluorescence intensity (a.u.)
Control siRNA Merge Tubulin PRC1 Ear ly telophase Ear ly telophase Late telophase Late telophase Late telophase MKLP1 3’UTR siRNA Merge Tubulin PRC1
Merge Tubulin GFP Merge Tubulin GFP
Merge Tubulin GFP Merge Tubulin GFP
GFP::MKLP1 GFP::MKLP1 AQ A Ear ly telophase Late telophase No tr ansgene Merge Tubulin PRC1 Merge Tubulin PRC1 Late telophase Merge Tubulin PRC1 Merge Tubulin PRC1 * *** ** p = 0.002 p = 0.03 p = 0.0002 40 55 55 55 55
−80 °C before being analyzed by liquid chromatography coupled with tandem MS (LC-MS/MS; see section below). Most of the AP experiments were carried out in duplicates, with the exception of CIT-K::AcGFP, which was in triplicate for each cell cycle phase, and GFP::PRC1, which was performed only once.
Mass spectrometry (MS) analyses. For the analysis of AP samples, beads were digested with trypsin and processed as previously described10. To analyze SILAC midbody samples, proteins were resuspended in lysis buffer (100 mM Tris pH 8.5, 100 mM tris[2-carboxyethyl]phosphine, 4% SDS [w/v], 8 M urea) and alkylated by the addition of iodoacetamide at afinal concentration of 40 mM for 30 min at room temperature in the dark. Samples were then mixed with NuPAGE LDS 4× Sample Buffer (Invitrogen), boiled for 5 min at 90 °C and loaded on NuPAGE Novex 4–12% Bis-Tris Protein Gels (Invitrogen). Gels were then fixed for 30 min at RT infixing solution (40% [v/v] methanol, 2% [v/v] acetic acid) and stained overnight with Brilliant Blue G-Colloidal Concentrate (Sigma-Aldrich), according to the manufacturer’s instructions. Each gel lane was then excised into ~10 bands. Gel bands were cut into smaller pieces, de-stained completely in 50 mM ammo-nium bicarbonate/50% (v/v) acetonitrile at 37 °C, and dehydrated in pure acet-onitrile for 15 min. Gel pieces were then rehydrated in 50 mM ammonium bicarbonate and digested with Trypsin (Sequencing Grade, Roche) overnight at 37 °C. Peptides were extracted from gel pieces twice for 30 min at 37 °C in 50% (v/ v) acetonitrile/0.5% (v/v) formic acid, dried in a SpeedVac (Thermo Scientific), and resuspended in 0.5% (v/v) formic acid. For LC-MS/MS analysis of SILAC samples, an LTQ Orbitrap Velos mass spectrometer (Thermo Scientific) coupled with an Ultimate 3000 Rapid Separation LC nano ultra high pressure HPLC system (Dionex) was used. Peptides were loaded and desalted on a PepMap C18 pre-column (5µ-beads, 100 µm × 20 mm, Dionex) and then separated on a PepMap analytical column (2 µm beads, 75 µm × 50 cm, Dionex) over a 60 min linear gra-dient (90 min/cycle) of 4–34% (v/v) acetonitrile/0.1% (v/v) formic acid at a flow rate of 0.3μl min−1. The LTQ Orbitrap Velos mass spectrometer was operated in the top 10 data-dependent acquisition mode where the preview mode was disabled. The Orbitrap full scan was set at m/z 380–1600 with a resolution of 60,000 at m/z 400. The 10 most abundant multiply charged precursor ions, with a minimal signal above 2000 counts, were dynamically selected for collision-induced dissociation fragmentation (MS/MS) in the LTQ Velos ion trap, and the dynamic exclusion was set ± 20 ppm within 45 s. The AGC and maximum injection time for Orbitrap were set at 1e6 and 200 ms, and 1e4 and 150 ms for ion trap.
MS data analysis. For protein identification in the SILAC experiments, the raw files were processed using MaxQuant (version 1.4.0.8) and the Andromeda search engine41–43. In all cases, peptides were searched against the UniProt human database concatenated with reversed copies of all sequences and supplemented with frequently observed contaminants. The following search parameters were used: full trypsin specificity was required, a maximum of two missed cleavages were allowed, carbamidomethyl (Cys) was set as afixed modification, whereas acetylation (Protein N-term), oxidation (Met), deamidation (Asn/Gln), and carbamylation (Lys and N-terminus of protein) were considered as variable modifications. Maximum protein and peptide false discovery rates (FDRs) were set to 1% and minimum required peptide length was set to seven amino acids. Quantification of proteins in the SILAC experiment was performed using MaxQuant41. SILAC multiplicity were set to doublets where Lys0/Arg0 and Lys8/Arg10 were selected as light and heavy labels, respectively. Peptides considered for quantification were unique and razor peptides including unmodified, and modified with carbamido-methylated (Cys), acetylated (Protein N-term), oxidated (Met), carbamylated (Lys and N-term), and deamidated (Asn/Gln). The re-quantification feature was enabled. Statistical evaluation of MS results generated by MaxQuant was performed using Perseus41.
For the identification of proteins from AP experiments, raw MS/MS data were analyzed using the MASCOT search engine (Matrix Science). Peptides were searched against the UniProt human sequence database and the following search parameters were employed: enzyme specificity was set to trypsin, a maximum of two missed cleavages were allowed, carbamidomethylation (Cys) was set as afixed modification, whereas oxidation (Met), phosphorylation (Ser, Thr and Tyr), and ubiquitylation (Lys) were considered as variable modifications. Peptide and MS/MS tolerances were set to 25 parts per million (ppm) and 0.8 daltons (Da). Peptides with MASCOT Score exceeding the threshold value corresponding to < 5% false positive rate, calculated by MASCOT procedure, and with the MASCOT score above 30 were considered to be positive.
Computational and statistical analyses. We used in-house written Perl scripts to combine the Mascot data from the replicates of AP-MS experiments for each bait and to compare them with datasets obtained from AP-MS experiments using HeLa cells expressing GFP alone at the same cell cycle stage (S phase, metaphase, or telophase) in order to eliminate non-specific hits. Prey hits absent from these GFP negative controls were classed as being specific. Additional common contaminants, such as keratins and hemoglobin, were eliminated manually. Thefiltered data (Supplementary Data 3) were then analyzed and visualized using Cytoscape (ver-sion 3.7.0).
To generate the serine/threonine phosphorylation sub-network, we searched the interactome dataset for proteins whose Uniprot protein namesfield contained the terms kinase and phosphatase but not tyrosine via grep in the Unix command line. This generated a dataset of 190 proteins that was subsequently manually curated to eliminate proteins that were not directly involved in phosphorylation/
dephosphorylation, such as kinase-associated proteins for example. Thefinal list of 136 proteins was entered into a raw tab-delimited textfile and then imported into Cytoscape to generate the network shown in Fig.3d.
GO enrichment analysis was performed using PANTHER44. Prism8 (GraphPad) and Excel (Microsoft) were used for statistical analyses and to prepare graphs.
Time-lapse imaging. For time-lapse experiments, HeLa Kyoto cells expressing GFP:tubulin and H2B::mCherry were plated on an open µ-Slide with 8 wells (Ibidi, 80826) 30 h after RNAi treatment. Imaging was performed on a Leica DMi8 CS AFC Motorised Research Inverted Digital Microscope. Images were collected with a 40 × /1.30 NA HC Plan APO CS2 - OIL DIC 240μm objective and excitation Lasers of Argon (65 mW, 488 nm) and of DPSS (20 mW, 561 nm). We used the Application Suite X software (LAS-X; Leica) for multidimensional image acquisi-tion. Specimens were maintained at 37 °C and 5% CO2via a chamber, and z-series of 14, 1-µm sections were captured at 2 min intervals. All images were processed using Fiji45to generate maximum intensity projections, to adjust for brightness and contrast, and to create thefinal movies.
Fluorescence microscopy. HeLa cells were grown on microscope glass coverslips (Menzel-Gläser) andfixed in either PHEM buffer (60 mM Pipes, 25 mM Hepes pH 7, 10 mM EGTA, 4 mM MgCl2, 3.7% [v/v] formaldheyde) for 12 min at room temperature or in ice-cold methanol for 10 min at−20 °C. They were then washed three times for 10 min with PBS and incubated in blocking buffer (PBS, 0.5% [v/v] Triton X-100 and 5% [w/v] BSA) for 1 h at room temperature. Coverslips were incubated overnight at 4 °C with the primary antibodies indicated in thefigure legends, diluted in PBT (PBS, 0.1% [v/v] Triton X-100 and 1% [w/v] BSA). The day after, coverslips were washed twice for 5 min in PBT, incubated with secondary antibodies diluted in PBT for 2 h at RT and then washed twice with PBT and once with PBS. Coverslips were mounted on SuperFrost Microscope Slides (VWR) using VECTASHIELD Mounting Medium containing DAPI (Vector Laboratories). Phenotypes were blindly scored by at least two people independently. Images were Fig. 7 PP1β dephosphorylates MKLP1 at S708 in cytokinesis. a HeLa Kyoto cells were treated with control or MYPT1siRNA for 48 h and stained to detect the indicated epitopes. Cells were staged as in Fig.4. Insets indicate 3× magnification of the midbody. Scale bars, 10 µm. b Quantification of total and pS708 MKLP1 in control andMYPT1siRNA cells. The boxes indicate the first quartile to the third quartile, the horizontal lines the median and the whiskers the minimum or maximum. AU, arbitrary unit;n = 32 independent control cells and n = 35 MYPT1 siRNA independent cells for MKLP1 stained cells; n = 38 independent control cells andn = 42 MYPT1 siRNA independent cells for MKLP1-pS708 stained cells; p values from student’s T-test. c HeLa stably expressing GFP-MKLP1 were treated with control orMYPT1 siRNA, synchronized in telophase and GFP pull-down protein extracts analyzed by western blot. The numbers indicate the sizes of the molecular mass marker.d Schematic diagram of MKLP1 protein. The Aurora B phosphorylation site and the VQF PP1-binding site are indicated.e MBP-tagged MKLP1, MKLP1AQAor MBP alone were co-expressed in yeast and used for MBP pull-down assay. Extracts and pull
downs were analyzed by western blot to detect GST and MBP. Numbers indicate the size of the protein ladder.f In vitro phosphatase assay of GST-tagged WT and AQA MKLP1. The reactions were incubated with either MBP-tagged PP1β or a catalytically dead version for the times indicated at the top and analyzed by western blot using antibodies against MKLP1 pS708 and GST.g Graph showing the normalization of MKLP1 pS708 values against the amounts of GST-MKLP1620–858.h HeLa Kyoto cells stably expressing GFP-MKLP1, GFP-MKLP1AQAor no transgene were treated with either control orMKLP1 3′UTR siRNA were stained to detect the indicated epitopes. Scale bars, 10µm. i Quantification of multinucleate cells from the experiments shown in h. More than 500 independent cells were counted inn ≥ 3 independent experiments. Bars indicate standard errors. *p < 0.05, **p < 0.01, ***p < 0.001 (Mann–Whitney U test). Source data for Fig.1b-c, e–g and i are provided as a Source Data file
acquired using a Zeiss Axiovert epifluorescence microscope equipped with Meta-Morph software. Fiji45was used to generate maximum intensity projections, which were adjusted for contrast and brightness and assembled using Photoshop. Fluorescence intensity values in Fig.7b were measured from identically sized areas at the midbody (IM), in the nucleus (IN), and in the background (IB) using Fiji45 and then normalized values were calculated using the following formula: [(IM−IB) −(IN−IB)]/(IN−IB)= (IM−IN)/(IN−IB).
Antibodies. The following antibodies and dilutions for western blot (WB) and immunofluorescence (IF) were used in this study: mouse monoclonal anti α-tubulin (clone DM1A, Sigma, T9026 dilutions for WB 1:20,000, for IF 1:2000), rabbit polyclonal anti-β-tubulin (Abcam, ab6046 dilutions for WB 1:5000, for IF 1:400), mouse monoclonal anti-cyclin B1 (clone GNS1, Santa Cruz, sc-245 dilution for WB 1:2000), mouse monoclonal anti-PP1α (clone G-4, Santa Cruz, sc-271762 dilutions for WB 1:1000, for IF 1:50), mouse monoclonal anti-PP1β (clone A-6, CPC P P P P P P P P P P P P P P P P P P P CPC CPC Early telophase CPC CPC Midbody Late telophase Actomyosin filaments Microtubules MKLP1 RacGAP1 MYPT1 Centralspindlin PP1β CPC Aurora B PRC1
Fig. 8 Model of regulation of centralspindlin by Aurora B and MYPT1-PP1β during cytokinesis. During furrowing (top panel) MYPT1-PP1β accumulates at the cortex with no or very limited access to the centralspindlin pool that localizes to the central spindle midzone, which is highly phosphorylated by Aurora B and therefore can form clusters. After completion of furrow ingression, MYPT1/PP1β accumulates at the midbody ring whereas Aurora B localizes to the midbody arms (bottom panel). This allows PP1β to de-phosphorylate MKLP1 at S708, which could strengthen the association of centralspindlin with PRC1. See text for more details