Urban diabetes: the case of the metropolitan area of Rome
Antonio Nicolucci
1, Maria Chiara Rossi
1, Ketty Vaccaro
2, Roberta Crialesi
3, Stefania Rossetti
3,
Stefano da Empoli
4, Lucio Corsaro
5, Lelio Morviducci
6, Marco G. Baroni
7, Simona Frontoni
8,
Francesco Dotta
91 Center for Outcomes Research and Clinical Epidemiology - CORESEARCH, Pescara, Italy; 2 Fondazione CENSIS, Rome,
Italy; 3 Istituto Nazionale di Statistica – ISTAT, Rome, Italy; 4 Istituto per la Competitività - I-COM and Health City Institute,
Rome, Italy; 5 MEDIPRAGMA, Rome, Italy; 6 Servizio di Diabetologia, Ospedale S. Camillo Forlanini, Rome, Italy; 7
Dipar-timento di Medicina Sperimentale, Endocrinologia e Diabete, Università Sapienza di Roma, Italy; 8 Dipartimento di Medicina
dei Sistemi Università degli Studi di Roma Tor Vergata; Endocrinologia, Diabetologia e Malattie Metaboliche Ospedale Fate-benefratelli Isola Tiberina, Rome, Italy; 9 Health City Institute, Rome and Università di Siena, Siena, Italy
Summary. Background: The world is rapidly urbanizing, causing alarming health problems to their citizens.
The Cities Changing Diabetes program aims to address the social factors and cultural determinants that can increase type 2 diabetes (T2D) vulnerability among people living in cities. Methods: Public data of Italian Institute for Statistics (ISTAT) and available scientific reports were reviewed and findings integrated. The prevalence of T2D in the 8 health districts of Rome was mapped and the correlation between prevalence and social and cultural determinants was assessed. Results: The metropolitan area of Rome has 4.3 million inhab-itants. People over 65 has increased by 136,000 units in the last decade, reaching 631,000 citizens in 2015. Elderly people living alone are 28.4%. The obesity prevalence is 9.3%, as compared to 8.2% in the year 2000. The prevalence of T2D is 6.6%, varying in the different 8 health districts between 5.9% and 7.3%. A linear correlation exists between the prevalence of diabetes in the districts, unemployment rate and use of private transportation rate (Pearson R 0.52 and 0.60, respectively), while an inverse correlation is present with aging index, school education level, and slow mobility rate (Person R -0.57, -0.52, and -0.52, respectively).
Conclu-sions: Important socio-demographic changes have occurred in Rome during the last decades with a raise in
the prevalence of obesity and diabetes. A wide variation exists in the prevalence of T2D among the districts of Rome, associated with social and cultural determinants. This study model can help rethinking diabetes in an urban setting. (www.actabiomedica.it)
Key words: urban diabetes, social determinants, obesity, lifestyle, vulnerability Introduction
Diabetes is rising at an alarming rate all over the world. The global prevalence of diabetes has almost doubled in the past 16 years – from 4.6% in 2000 (1) to 9.1% in 2017 (2). In the absence of specific interven-tions, the prevalence of diabetes is projected to rise to 11.7% – 736 million people – by 2045 (2). Given the devastating human and economic cost of diabetes and its complications, this growth is simply unsustainable for all Countries.
Established drivers of the increasing prevalence of type 2 diabetes include a growing ageing population and global trends such as urbanization, unhealthy diet and reduced physical activity (2).
Today, more than half the world’s population (3.9 billion people) live in cities, and it is estimated that almost 6.3 billion people will live in urban areas by 2050 (3). Urban environments are already home to two-thirds of people with diabetes (2). This makes cities the front line in the fight against type 2 diabe-tes – and where we must take action to hold back the
alarming rise of the condition. Starting from these premises, in 2014 three global partners, Steno Diabe-tes Center Copenhagen, University College London and Novo Nordisk, launched the Cities Changing Diabetes program to accelerate the global fight against urban diabetes (4). Today, the program has established local partnerships in 15 cities to address the social fac-tors and cultural determinants that can increase type 2 diabetes vulnerability among certain people living in cities. Rome joined the program in 2017, and a series of initiatives was launched with the aim of mapping the problem, sharing the learnings, and designing in-terventions. The first phase consisted in the clinical-epidemiological assessment of diabetes and its related risk factors in the metropolitan area of Rome.
Aims
To assess, using existing data sources, the preva-lence of diabetes in the metropolitan area of Rome and its health districts, and to address the social factors and cultural determinants that can increase type 2 diabetes vulnerability.
Methods
Socio-demographic data on the metropolitan area of Rome were provided by the National Institute of Statistics (ISTAT) (5). The prevalence of diabetes was estimated by the Department of Epidemiology of the Regional Healthcare System of Lazio through record linkage between drug prescriptions, hospital discharge registry, and exemption from co-payments due to a di-agnosis of diabetes (6).
The prevalence of obesity and physical activity was obtained by the national health examination sur-veys conducted by ISTAT (7).
The association between the prevalence of diabe-tes in the different health districts and several socio-economic and lifestyle indicators was assessed through linear regression analysis and Spearman correlation coefficient. The following indicators were considered: aging index (expressed as the ratio between residents over 65 years of age and those aged 14 years or less); school education level (expressed as high school/de-gree to middle school education ratio); unemployment
rate; use of private transportation (car, motorcycle); slow mobility (walk, bicycle).
Results
Rome is the largest city in Italy and it is the fourth most populated city in the EU after Paris, London and Berlin, with 4.3 million inhabitants in the metro-politan area. Since the Second World War, the popu-lation doubled in the metropolitan area, rising from 2.1 million in 1951 to 4.0 million in 2011. In the city of Rome, the population raised from 1.65 million to 2.62 million. In the city, the number of citizens over the age of 65 has grown by 136,000 over the last 13 years, reaching a total of 631,000 in 2015. Further-more, in 1971 one out of 10 families in Rome had only one component; in 2011 the rate increased to one in three. Today, elderly people (≥65 years) living alone are 28.4%.
In addition to the increasing age of the population, one of the largest contributors to the rise of diabetes incidence is represented by obesity. The prevalence of obesity among adults in the Lazio region, where Rome is located, was 9.3% in 2013, as compared to 8.2% in the year 2000. Furthermore, 43.8% of the adult resi-dents in the Lazio region are physically totally inactive, and only 24.0% exercise on a regular basis.
The prevalence of diabetes in the Lazio region (6.6%) is amongst the highest in Italy, preceded only by Campania (6.7%) and Calabria (8.2%). Compared to the year 2000, the prevalence of diabetes has in-creased from 5.0% to 6.5% among males and from 4.2% to 6.8% among females.
In absolute terms, it can be estimated that about 189.500 citizens with diabetes live in the city of Rome and 286.500 residents with diabetes live in the metro-politan area. In other words, of all residents with dia-betes in the Lazio region 50% live in Rome and 75% live in the metropolitan area.
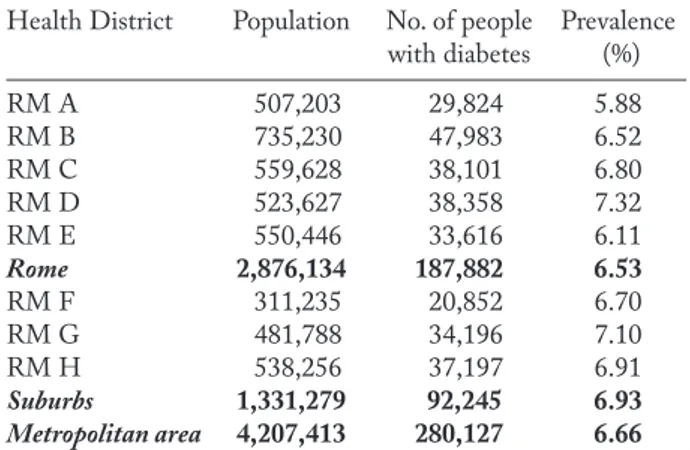
Within the metropolitan area of Rome, the prev-alence of diabetes varies among the different health districts between 5.88% and 7.32% (table 1). The prev-alence in the city of Rome (6.53%) is lower than in the suburban areas (6.93%).
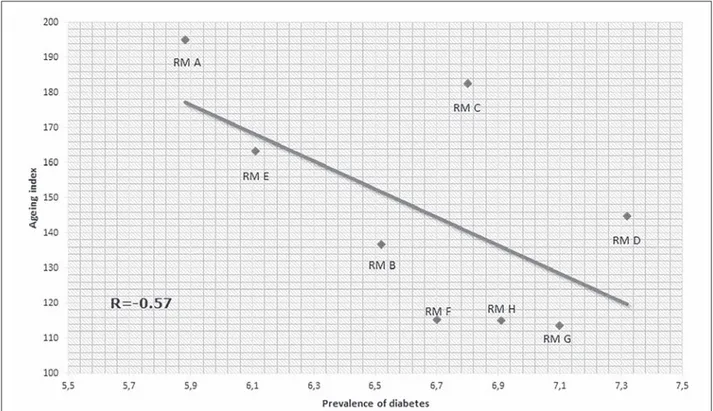
We found a strong, inverse correlation between the prevalence of diabetes in different neighborhoods
and aging index (figure 1): those districts with the highest prevalence of diabetes were characterized by a lower aging index. A strong correlation was also docu-mented between the prevalence of diabetes and the level of school education. Districts characterized by a lower prevalence of diabetes also showed a higher high school/degree to middle school education ratio (figure 2). Similarly, a linear association was found between
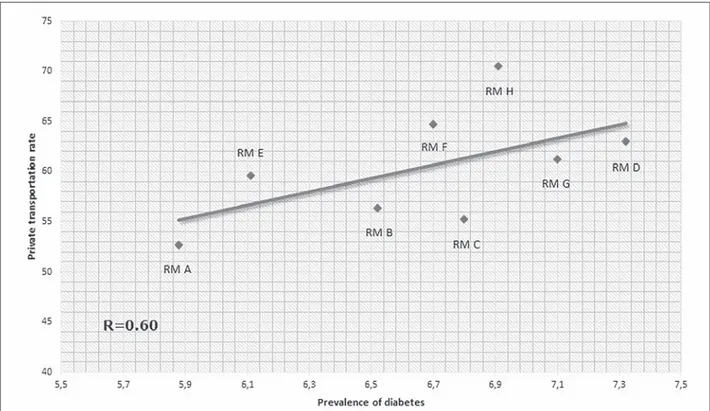
diabetes prevalence and unemployment rate (figure 3). Finally, those districts with higher diabetes prevalence showed higher percentages of residents who use motor vehicles to get around (figure 4), and lower percentages of people who choose to walk or cycle to their destina-tion (figure 5).
Discussion
Cities offer unique chances for citizens to increase their income and benefit from education as well as health and social services. Despite these opportunities and benefits, the urban environment can also negative-ly impact the health of the citizens by exacerbating the relevant factors that lead to chronic non-communica-ble diseases such as diabetes (8). Cities thus provide tremendous opportunity for studying and understand-ing the drivers behind type 2 diabetes.
The analysis of the data relative to the metro-politan area of Rome provides relevant information. Of note, major socio-demographic changes occurred in Rome during the last decades with a raise in the prevalence of obesity and diabetes. The prevalence of Table 1. Prevalence of diabetes in the health districts of the
metropolitan area of Rome.
Health District Population No. of people Prevalence with diabetes (%) RM A 507,203 29,824 5.88 RM B 735,230 47,983 6.52 RM C 559,628 38,101 6.80 RM D 523,627 38,358 7.32 RM E 550,446 33,616 6.11 Rome 2,876,134 187,882 6.53 RM F 311,235 20,852 6.70 RM G 481,788 34,196 7.10 RM H 538,256 37,197 6.91 Suburbs 1,331,279 92,245 6.93 Metropolitan area 4,207,413 280,127 6.66
Figure 2. Correlation between prevalence of diabetes and level of school education in the health districts of the metropolitan area of
Rome
Figure 4. Correlation between prevalence of diabetes and use of private transportation in the health districts of the metropolitan area
of Rome
Figure 5. Correlation between prevalence of diabetes and use of slow mobility (walk, cycle) in the health districts of the metropolitan
diabetes in the area is amongst the highest in Italy, and it markedly varies among the different health districts. We found that the areas with a higher prevalence of diabetes are those more disadvantaged from a socio-economical point of view. In fact, a strong association was evidenced between higher diabetes prevalence, higher rate of unemployment, and lower level of school education, the latter considered as a proxy for lower socio-economic status. Despite the growth of the ag-ing population represents one of the major candidate drivers of diabetes, those neighborhoods characterized by a higher prevalence of diabetes also showed a lower ageing index. These findings suggest on one side that socio-economic factors are major determinants of the risk of diabetes; on the other they also indicate that in more disadvantaged areas diabetes develops at younger ages, thus increasing the number of life years lived with the disease. Use of inactive transport and lack of physi-cal activity also play an important role, likely related to the increased risk of obesity. We documented that the use of motor vehicles was more frequent in those districts with a higher prevalence of diabetes, while the proportion of citizens walking or cycling was lower.
The analysis of current data sources allowed a first recognition of key factors playing a role in increasing the risk of diabetes in an urban environment. Our find-ings suggest the need to implement effective strategies to reach socially disadvantaged citizens by increasing their accessibility to preventive activities. Of particular importance will be to strengthen social networks and increase, in the more disadvantaged areas, low-cost, high impact structures allowing physical activity.
The information derived from this analysis will be further enriched with qualitative research, investigat-ing local vulnerabilities associated with diabetes usinvestigat-ing the Urban Diabetes Risk Assessment. The findings will help give a more thorough understanding of how the sociocultural factors of diabetes come into play, and help to identify barriers and opportunities for suc-cessful diabetes prevention, care and management in Rome.
In conclusion, the world is rapidly urbanizing, changing not just where we live, but the way we live. Today, the way cities are designed, built and run poses important health challenges to their citizens. This im-plies new approaches to map the challenge, understand
the areas of greatest risk and vulnerability and design interventions that can have a real impact. Through the Changing Diabetes Program, Rome and the other participating cities will help in developing new tools to rethink diabetes in an urban setting.
Acknowledgement
The authors wish to thank Novo Nordisk, Società Italiana di Diabetologia, Associazione Medici Diabetologi, Comune di Roma and Regione Lazio for the support to the initiative.
Conflict of interest: Each author declares that he or she has no
commercial associations (e.g. consultancies, stock ownership, equity interest, patent/licensing arrangement etc.) that might pose a con-flict of interest in connection with the submitted article
References
1. International Diabetes Federation. IDF Diabetes Atlas, 1st edition (2000). https://www.idf.org/e-library/epidemiology-research/diabetes-atlas/24-atlas-1st-edition.html
2. International Diabetes Federation. IDF Diabetes Atlas, 8th edition (2017). https://diabetesatlas.org/resources/2017-atlas.html
3. UNDESA. World Urbanization Prospects: The 2014 Revi-sion. New York: United Nations Department of Economics and Social Affairs, Population Division; 2014.
4. Cities Changing Diabetes. http://www.citieschangingdiabe-tes.com/home.html
5. Statistiche demografiche Roma 2016. http://demo.istat.it/ pop2016/index1.html
6. Dipartimento di Epidemiologia del Servizio Sanitario Re-gionale Regione Lazio - Programma ReRe-gionale Valutazi-one degli Esiti degli Interventi Sanitari 2016 https://www. deplazio.net/attivita/94-programma-regionale-valutazione-esiti-prevale
7. Istat, Indagine Multiscopo, Aspetti della vita quotidiana 2015. https://www.istat.it/it/archivio/129956
8. WHO. Hidden Cities: Unmasking and overcoming health inequities in urban settings. Geneva, Switzerland: World Health Organization; 2010.
Received: 28 March 2019 Accepted: 29 April 2019 Correspondence: Antonio Nicolucci, MD
Center for Outcomes Research and Clinical Epidemiology - CORESEARCH Via Tiziano Vecellio 2 - 65124 Pescara Italy Tel. +39 085 9047114 - Fax +39 0875 9047113 E-mail [email protected]