Nonlinear Phenomena in Complex Systems, vol. 23, no. 2 (2020), pp. 130 - 132
Correlation Between Bone Density and Fractal Dimension:
A Pilot Study
Vittoria Perrotti∗ and Giovanna Iezzi
Department of Medical, Oral and Biotechnological Sciences, University of Chieti-Pescara, Chieti, ITALY
Angela De Sanctis
Department of Business Economics University of Chieti-Pescara, Pescara, ITALY
Antonio Pasculli
Department of Engineering and Geology, University of Chieti-Pescara, Chieti, ITALY
Adriano Piattelli
Department of Medical, Oral and Biotechnological Sciences, University of Chieti–Pescara, Chieti, ITALY
Giuseppe Aprile
Private practice, Rome, ITALY (Received 30 November, 2019)
Fractal analysis is a mathematical method used to describe the internal architecture of complex structures, such as the bone tissue. The aim of this study was to determine whether fractal dimension (FD) is able to distinguish between different bone densities (BD), assessed histomorphometrically, and whether there is a linear dependence between the FD and BD in order to support the use of FD as a supplementary non-invasive method for BD measurement. Microscopic photographs of bone specimens stained with acid fuchsin and toluidine blue obtained during block biopsies from nine segments of bovine ribs were used. A total of 42 regions of interest (ROI) were cut off from the original photo, converted into a bitmap and binarized. The evaluation of FD was carried out using the box counting method. Comparison of FD values in the four different densities bone sites (D1-D4) was made by means of Kruskal–Wallis test followed by Dunn’s multiple comparison test. The linear dependence between the two variables (FD and BD) was investigated calculating the Pearson’s r test correlation coefficient, which was considered significant when P < .05. The more the bone was compact, the higher were FD values. A strong positive correlation between BD evaluated by histomorphometry and FD (R : 0.9651), p-value < .00001 was found . The increase in the values of the FD strongly correlated with the increase of the percentage of the bone trabeculae observed in the histological slides.
This pilot study demonstrates that FD might be able to distinguish different densities in bone sites and that there is a linear correlation between BD and FD on histological samples. Future studies will be addressed at evaluating whether this data can be confirmed on a larger samples size and on radiographic images. This will be useful for the early and non-invasive detection of structural changes in the trabecular bone pattern during healing, inflammatory processes and pathologies associated to bone breakdown.
PACS numbers: 87.10.+e, 87.15.La,07.05.Kf,05.45.Df
Keywords: fractal analysis, biological materials, bone breakdown
DOI: https://doi.org/10.33581/1561-4085-2020-23-2-130-132
∗
E-mail: [email protected]
1. Introduction
Fractal analysis is a mathematical method used to describe the internal architecture of 130
Correlation Between Bone Density and Fractal Dimension: A Pilot Study 131
complex structures. It has been used to measure the irregularity and complexity of tissues over many scales: the organization of cells at the organ level, the distribution of protein aggregates in the membrane, the organization of the cytoplasm, the nucleus and the structure of individual proteins [1]. Fractal analysis derives from fractal geometry and is used to calculate fractal dimension (FD), which is an index of the space-filling properties of an object. FD has been used to quantitatively assess trabecular bone changes on X-ray [2–5] and it is a promising method for the early detection of bone breakdown and bone regeneration. However, to the best of authors’ knowledge, there is no study testing the capability of fractal analysis for the discrimination of different pattern of trabecular bone. Direct histomorphometrical measurement of bone density (BD) remains the gold standard in bone type assessment [6]. The aim of this study was to determine whether FD is able to distinguish between different bone densities, assessed histomorphometrically, and whether there is a linear dependence between the FD and BD in order to support the use of FD as a supplementary non-invasive method for BD measurement.
2. Materials and methods
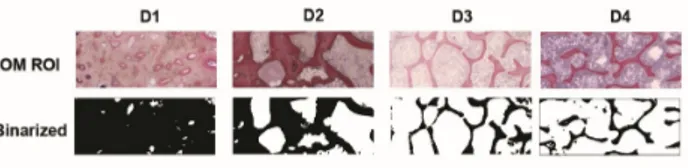
For the fractal analysis, microscopic photographs of bone specimens stained with acid fuchsin and toluidine blue obtained during block biopsies from segments of bovine ribs for other independent authors’ research, were used. The histological images (magnification 9X) were captured using a light microscope (Laborlux S, Leitz, Wetzlar, Germany), connected to a high-resolution video camera (3CCD, JVC KYF55B, JVCs, Milan, Italy), and interfaced with a monitor and PC (Intel Pentium III 1200 MMX, Intels, Santa Clara, CA, USA). A total of 42 random ROI (500x200 pixels) for were cut off from the original images, converted into a bitmap (the threshold was adjusted to in order to mark bone trabeculae and not marrow spaces) and binarized using ImageJ 1.52K software (Wayne Rasband, National Institute of heath, Bethesda,
USA) – Figure 1. BD was measured as area fraction of bone trabeculae on the total area of the ROI and was classified as D1: 75-100%, D2: 50-75%, D3: 25-50% and D4: 0-25%. Five images for each BD were used for the evaluation of FD, carried out by two independent observers (VP and GA), using the box counting method.
FIG. 1. (color online) Optical microscopy (OM) images of the region of interest (ROI) of the four different densities (D1–D4) bone sites stained with acid fuchsin and toluidine blue and binarized.
Statistical Analysis: Data were reported as mean ± standard deviation (SD). Comparison of FD values in the four different densities bone sites (D1–D4) was made by means of Kruskal–Wallis test followed by Dunn’s multiple comparison test. The linear dependence between the two variables (FD and BD) was investigated calculating the Pearson’s r test correlation coefficient, which was considered significant when P < .05.
3. Results
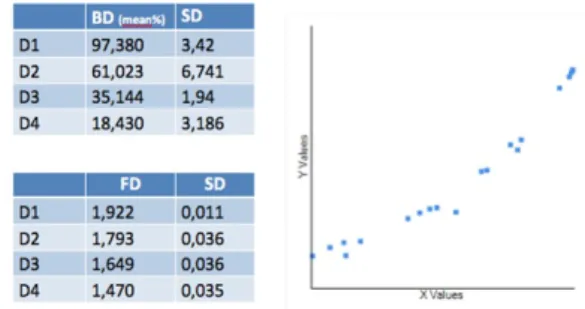
The average BD and FD values are reported in the tables shown in the left panel of Figure 2; the more the bone was compact, the higher were FD values. Right panel of figure 2 shows a strong positive correlation between BD evaluated by histomorphometry and FD (R: 0.9651), p–value < .00001. The increase in the FD values strongly correlated with the increase of the percentage of the bone trabeculae observed in the histological slides.
4. Discussion
The geometry of bone tissue is complex. Bone shape is too complicated to be measured or compared using traditional measuring methods, Nonlinear Phenomena in Complex Systems Vol. 23, no. 2, 2020
132 Vittoria Perrotti et al.
which could benefit from supplementary analysis. FD analysis offers the possibility of a comparison between complex shapes and can be used as a complementary method for bone structure characterization which is non-invasive for patient. Linear correlations were observed between FD and resonance frequency analysis, between FD and insertion torque and between resonance frequency and insertion torque at implant sites [7–9]. Fractal analysis may provide information about the bone structure and it can be measured on radiographs (periapical, digital panoramic images, cone beam computed tomography) and on 3D images. Within the limitation of the small sample size, this pilot study demonstrates that FD might be able to distinguish different densities in bone sites and that there is a linear correlation between BD and FD on histological samples. Future studies will be addressed at evaluating whether this data can be confirmed on a larger samples size and on radiographic images. This will
be useful for the early and non-invasive detection of structural changes in the trabecular bone pattern during healing, inflammatory processes and pathologies associated to bone breakdown.
FIG. 2. Left panel: average percentages of Bone Density (BD) and Fractal Dimension (FD) in the four different densities bone sites (D1–D4). Right panel: scatter plot depicting the Pearson’s correlation coefficient for BD evaluated by histomorphometry and FD (R : 0.9651), p-value < .00001.
References
[1] B. Mandelbrot, The fractal geometry of nature (W.H. Freeman, New York, 1983).
[2] E. Sener, S. Cinarcik, and B. Baksi, Journal of Periodontology 86 (12), 1364 (2015).
[3] Y. Yu, C. Lin, C. Chen, T. Oviir, S. Chen, and L. Hollender, Oral Surgery Oral Medicne Oral Pathology Oral Radiology Endodontics 107 (2), 283 (2009).
[4] C. Huang, J. Chen, Y. Chang, J. Jeng, and C. Chen, International Endodontic Journal 46 (6), 523 (2013).
[5] D. Chappard, P. Guggenbuhl, E. Legrand, M. BaslГ c , and M. Audran, Journal of Bone and Mineral Metabolism 23 (1), 24 (2005).
[6] A. Parfitt, The physiological and clinical significance of bone histomorphometric data, In Bone Histomorphometry: Techniques and Interpretations (CRC Press, Boca Raton, Florida, pp. 143-224, 1983).
[7] B. Suer, Z. Yaman, and B. Buyuksarac, International Journal of Oral and Maxillofacial Implants 31 (1), 55 (2016).
[8] M. Veltri, M. Ferrari, and P. Balleri, International Journal of Oral and Maxillofacial Implants 26 (1), 108 (2011).
[9] T. Tozum, E. Dursun, and S. Uysal, Implant Dentistry 25 (6), 789 (2016).