AIP Advances 8, 101502 (2018); https://doi.org/10.1063/1.5043097 8, 101502
© 2018 Author(s).
Thickness dependence of spin wave
dynamics in three-fold nano-ellipse clusters
Cite as: AIP Advances 8, 101502 (2018); https://doi.org/10.1063/1.5043097
Submitted: 05 June 2018 . Accepted: 02 October 2018 . Published Online: 12 October 2018 Wonbae Bang, F. Montoncello, A. Hoffmann, L. Giovannini, and J. B. Ketterson
COLLECTIONS
Paper published as part of the special topic on Chemical Physics, Energy, Fluids and Plasmas, Materials Science and Mathematical Physics
ARTICLES YOU MAY BE INTERESTED IN
Coupled macrospins: Mode dynamics in symmetric and asymmetric vertices
AIP Advances 8, 056020 (2018); https://doi.org/10.1063/1.5007281 The design and verification of MuMax3
AIP Advances 4, 107133 (2014); https://doi.org/10.1063/1.4899186
Spin wave propagation properties across configurational antiferro/ferro-magnetic transitions
Thickness dependence of spin wave dynamics
in three-fold nano-ellipse clusters
Wonbae Bang,1,2,aF. Montoncello,3A. Hoffmann,2L. Giovannini,3
and J. B. Ketterson1,4
1Department of Physics and Astronomy, Northwestern University, Evanston, Illinois 60208, USA
2Materials Science Division, Argonne National Laboratory, Argonne, Illinois 60439, USA 3Dipartimento di Fisica e Scienze della Terra, Universit`a di Ferrara, Via Saragat 1, 44122 Ferrara, Italy
4Department of Electrical and Computer Engineering, Northwestern University, Evanston, Illinois 60208, USA
(Received 5 June 2018; accepted 2 October 2018; published online 12 October 2018)
We present the results of an experimental and theoretical study of spin wave dynamics in three-fold vertices made of permalloy nano-ellipses, with thicknesses ranging from 7.5 nm to 40 nm. For the most symmetric modes, a non-trivial variation of their frequency and intensity with the ellipse thickness is found. Simulations involving the dynamical matrix approach are in good agreement with the experiments. © 2018 Author(s). All article content, except where other-wise noted, is licensed under a Creative Commons Attribution (CC BY) license (http://creativecommons.org/licenses/by/4.0/).https://doi.org/10.1063/1.5043097
I. INTRODUCTION
Nanometer scale patterning by electron beam lithography of ferromagnetic structures with closely placed segments can be used to create macrospin clusters for studying magnetic frustration. Examples of such systems are artificial spin ices (ASIs)1–3and artificial quasicrystals4including square3,5and honeycomb lattices,1as well as for three-fold asymmetric clusters of ellipses.6,7However, only a few studies of the thickness dependence of the static magnetic frustration and ferromagnetic resonance (FMR) spectra in ASI systems have appeared.8,9
In what follows, we present a broad band study of the FMR spectra of three-fold nano-ellipse clusters (120◦symmetry), made of Permalloy, with cluster elements positioned 50 nm from the cluster center. The ellipses (macrospins) are patterned using electron beam lithography5and have major and minor axis of 500 nm and 200 nm respectively, and have thicknesses ranging from 7.5 nm to 40 nm. Micromagnetic simulations show good agreement with the experimentally observed spectra. II. EXPERIMENTAL
Figure1(a)shows a schematic diagram of the sample geometry involving the coplanar waveguide (CPW) and the accompanying clusters. The pattern for the electrodes of the CPWs was formed using a laser writer followed by the lift-off of a 100 nm Au film on a 5 nm Ti film. The CPWs have a central line flanked by two ground lines. Each cluster has 120◦ symmetry, with the major axis of the first macrospin parallel to the x-axis, and second and third macrospins rotated ±120◦from that axis. Samples with six different thicknesses were fabricated on a Si substrate which has a 300 nm SiO2layer. The permalloy (Ni80Fe20) nano-ellipse clusters were patterned directly on top of the CPW
using e-beam lithography followed by thin film deposition using e-beam evaporation. The individual three-fold symmetric permalloy nano-ellipse clusters are positioned in a well separated square array (lattice constant: 1.88 µm) so as to minimally interact. Samples were prepared with thicknesses of
aAuthor to whom correspondence should be addressed. Electronic mail:[email protected]
101502-2 Bang et al. AIP Advances 8, 101502 (2018)
FIG. 1. (a) Schematic of the sample geometry. (b) A SEM image of the three-fold nano-ellipse clusters; note that all the three nano-ellipses in a single cluster have the same aspect ratio. The wave guide axis (x-axis) coincides with both a major axis of one of the macrospins and the external magnetic field direction.
7.5, 15, 20, 25, 30, and 40 nm. Figure1(b)shows a scanning electron microscopy (SEM) image of the actual clusters. The nano-ellipses within a cluster are very close to each other, with the distance from an edge to a vertex being about 50 nm.
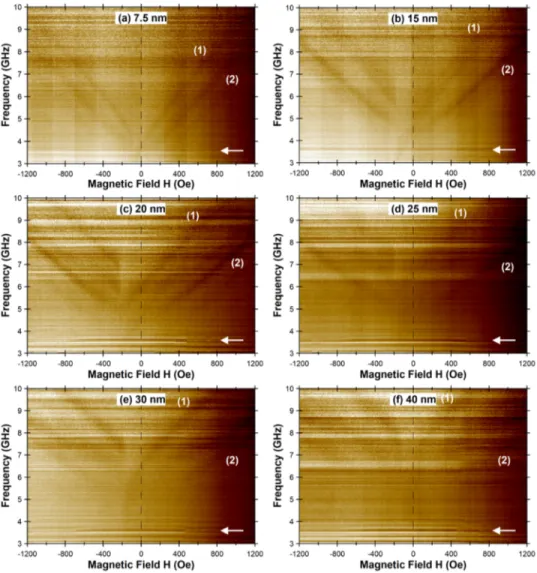
FIG. 2. FMR spectra obtained for the nano-ellipse clusters prepared with different thicknesses: (a) 7.5 nm, (b) 15 nm, (c) 20 nm, (d) 25 nm, (e) 30 nm, and (f) 40 nm. Here, the frequency is varied between 3 and 10 GHz at fixed magnetic fields ranging between +1200 and –1200 Oe. White arrows indicate the direction of the magnetic field changes between successive frequency sweeps.
III. RESULTS AND DISCUSSION
Measurements were performed using a vector network analyzer (VNA)10using the following procedure: 1) The clusters are magnetized along the x-axis by raising the field to +3000 Oe followed by a frequency sweep between 3 to 10 GHz; this establishes a baseline from which data at other fields are subtracted. 2) The magnetic field is then lowered to +1200 Oe and the frequency is swept over the same range (3 – 10 GHz); this is repeated at 10 Oe intervals until the field reaches –1200 Oe.
Figure2shows the FMR absorption spectra from clusters having the six different thickness val-ues as false color-coded images obtained with the VNA. Two dominant modes are clearly detected from all samples: Mode (1) is localized in the first ellipse (0◦) whereas mode (2) is localized in the second (120◦) and third (240◦) ellipse. Note that mode (1) shifts to higher frequencies when the thickness of the ellipse increases; on the other hand, mode (2) shows little thickness depen-dence. These behaviors are consistent with the simulations (see below). Additional modes appear as the thickness of the ellipses increases. Note that all samples exhibit mode softening11–13 at a certain critical magnetic field (at around –50 Oe for the 7.5 and 40 nm samples and –200 Oe for the 15, 20, 25, and 30 nm samples); i.e., they exhibit an abrupt departure from the overall
FIG. 3. Theoretical simulations of FMR spectra at a magnetic field of +1000 Oe, for samples with thicknesses of: (a) 7.5 nm, (b) 15 nm, (c) 20 nm, (d) 25 nm, (e) 30 nm, and (f) 40 nm; the amplitudes are normalized to the strongest resonance. With increasing thickness, mode (1) is shifted to higher frequencies, and additional modes appear with weaker intensities at the left wing of peak (1).
101502-4 Bang et al. AIP Advances 8, 101502 (2018)
linear behavior of the spectra with field when approaching the magnetization reversal field of the macrospins.
The theoretical simulations were performed using the dynamical matrix method.14–16Figure3 shows theoretical simulations of the FMR spectra for the six different thicknesses of the three-fold nano-ellipse clusters. Spectra were simulated at a fixed magnetic field of +1000 Oe, and normalized to the mode with the largest amplitude, i.e., mode (2). Two dominant modes, (1) and (2), were clearly observed for all samples. As the thickness increases, mode (2), which occurs near 8.3 GHz, shows little thickness dependence; conversely, mode (1) gradually shifts to higher frequencies (from 10 GHz to 12 GHz), thereby leaving a region of the spectrum where lower intensity, higher order, modes (associated with the horizontal macrospin (Fig.4a)) can be identified. These modes are also found for small thicknesses, though with considerably lower intensity (due in part to the presence of less magnetic material) but are hidden by the largest peaks (see left wing of mode (1) peak in Fig.3). The predicted spectrum is, on the whole, in good agreement with the experimental data.
The behavior of modes (1) and (2) with frequency is not straightforward. Usually, an increase in thickness of isolated magnetically saturated dots increases the in-plane demagnetizing fields and hence produce an overall frequency decrease, independent of the mode symmetry.17However, this decrease is barely perceptible in the oblique macrospin mode (i.e. mode (2)): the profile of this mode is only slightly shifted as the thickness increases, and this favors a constant frequency. On the other hand, mode (1) shows a clear frequency increase as the thickness increases. In fact, the profile of mode (1) hybridizes with high order modes within the same macrospin (resulting in undulations in its
FIG. 4. (a) Normalized FMR signals at a fixed magnetic field of +1000 Oe from the theoretical simulations of the 40 nm sample (which is the same as Fig.3(f)) together with the corresponding out-of-plane component of the magnetization at +1000 Oe for each mode. (b) Relative amplitude of the peak for modes (2) for all samples.
profile, making it depart from uniformity) and furthermore mixes with modes (Fig.4–a) in adjacent macrospins, which definitely influences its frequency.18
The contributions from the exchange and dipolar energies differ for each thickness, which results in different distributions of the mode frequencies. In particular, the spacing of the frequencies of neigh-boring modes is in general different at different thicknesses, and so is the degree of the hybridization. Since analytical models commonly assume a uniform magnetization and some “chosen form” for the wavefunction, they cannot predict the exact behavior of the frequencies in a system as complex as ours: in fact, it would be necessary to assume the presence of multiple wavefunctions if we were to model how/if hybridization occurs with modes in the same macrospin or with those in neighboring macrospins. Only exact calculations (which account for how the nonuniform magnetization varies with thickness), with no constraint on the mode wavefunctions, can produce reliable results. And our model, which considers the exact magnetization distribution and solves an eigenvalue/eigenvector problem (frequencies and profiles are simultaneously computed), demonstrates its validity and reli-ability through a direct comparison with the experimental results, without resorting to a “best fit” to the magnetic/geometric parameters involved.
Overall, the results of the full calculations, made with the dynamical matrix method, give satis-factory agreement with the experimental measurements, proving the effectiveness of the method and the reliability of its (non-trivial) results. As mentioned above, the amplitude of mode (2) is about two times stronger than that for mode (1) since it involves contributions from two ellipses, those at 120◦
and 240◦.
Figure 4(a) shows a simulation of the normalized FMR signals at a fixed magnetic field of +1000 Oe for the 40 nm sample, which is the same as that shown in Fig.3(f). Also shown here are the mode patterns associated with the out-of-plane component of the magnetization along with the color scale for the amplitude; mode (2) clearly shows the same magnetization distribution for the 120◦ and 240◦ ellipses, as expected by symmetry. The low frequency peak at 4 GHz is associated with an “outer end mode” of the rotated ellipses; this is followed by a broad peak between 6 and 7 GHz associated with an “inner end mode”. There are two additional modes between mode (1) and (2) at 10 and 11 GHz, which correspond to higher order modes of the horizontal macrospin, with respectively (2) and (1) nodes perpendicular to the magnetization direction. Although, ideally, the corresponding out-of-plane component of the magnetization for the 120◦and 240◦ellipses of mode (2) should be absent, we observe a hybridized mode in the simulation.
The differing behavior of modes (1) and (2) arises from the fact that the mode density gen-erally increases with increasing frequency, as has been discussed earlier.18Hence, hybridization is more likely to occur at higher frequencies, where the spacing between different modes tends to be smaller. In our case, the fundamental mode (2) occurs in the region of minimum internal field (i.e., where magnetization and applied field are more misaligned); hence it has a low frequency and a low likelihood to hybridize with modes of adjacent macrospins. On the other hand, mode (1) occurs at a higher frequency, because it experiences a large internal field (the magnetization is almost par-allel to the field). But at higher frequency, we find higher order modes in the oblique macrospins. Therefore, modes nominally belonging to a different macrospin can occasionally have similar (or equal) frequencies and hence hybridize, resulting in spatial oscillations in all three macrospins. At such frequencies, different modes are simultaneously excited, and the result manifests itself in mode profiles (corresponding to the eigenvectors in our dynamical matrix model) which clearly depart from smooth ones.
Figure4(b)presents the amplitude of the FMR absorption for mode (2) for all samples. Note the abrupt increase in the amplitude for the 40 nm thick nano-ellipses sample, the origin of which requires further study.
IV. CONCLUSIONS
We have fabricated ASI systems consisting of permalloy three-fold nano-ellipse clusters involv-ing closely approachinvolv-ing macrospins with several different thicknesses and presented experimental measurements and theoretical simulations of their dynamical response. The spectra consist of two dominant modes. As the thickness of the nano-ellipses increases, one of these modes shifts to higher
101502-6 Bang et al. AIP Advances 8, 101502 (2018)
frequencies; the second mode shows only a small thickness dependence. The theoretical simulations are consistent with both of these trends, and the analysis of the mode profiles is used to explain the peculiar frequency behavior. Behaviors arising from macrospin dimensions are often subtle, though clearly important in understanding the overall dynamics of ASI systems.
ACKNOWLEDGMENTS
Work at Northwestern was supported under NSF grant DMR 1507058. Device fabrication was carried out at Argonne and supported by the U.S. Department of Energy, Office of Science, Materials Science and Engineering Division. Lithography was carried out at the Center for Nanoscale Materials, an Office of Science user facility, which is supported by DOE, Office of Science, Basic Energy Science under Contract No. DE-AC02-06CH11357.
1E. Mengotti, L. J. Heyderman, A. F. Rodriguez, F. Nolting, R. V. Hugli, and H. B. Braun,Nat. Phys.7(1), 68–74 (2011). 2C. Nisoli, R. Moessner, and P. Schiffer,Rev. Mod. Phys.85(4), 1473–1490 (2013).
3R. F. Wang, C. Nisoli, R. S. Freitas, J. Li, W. McConville, B. J. Cooley, M. S. Lund, N. Samarth, C. Leighton, V. H. Crespi, and P. Schiffer,Nature439(7074), 303–306 (2006).
4V. S. Bhat, J. Sklenar, B. Farmer, J. Woods, J. T. Hastings, S. J. Lee, J. B. Ketterson, and L. E. De Long,Phys. Rev. Lett.
111(7), 077201 (2013).
5M. B. Jungfleisch, W. Zhang, E. Iacocca, J. Sklenar, J. Ding, W. Jiang, S. Zhang, J. E. Pearson, V. Novosad, J. B. Ketterson, O. Heinonen, and A. Hoffmann,Phys. Rev. B93(10), 100401(R) (2016).
6W. Bang, M. B. Jungfleisch, F. Montoncello, B. W. Farmer, P. N. Lapa, A. Hoffmann, L. Giovannini, L. E. De Long, and J. B. Ketterson,AIP Adv.8, 056020 (2018).
7F. Montoncello, L. Giovannini, W. Bang, J. B. Ketterson, M. B. Jungfleisch, A. Hoffmann, B. W. Farmer, and L. E. De Long,Phys. Rev. B97, 014421 (2018).
8Y. Li, G. Gubbiotti, F. Casoli, S. A. Morley, F. J. T. Goncalves, M. C. Rosamond, E. H. Linfield, C. H. Marrows, S. McVitie, and R. L. Stamps,J. Appl. Phys.121(10), 103903 (2017).
9G. N. Kakazei, X. M. Liu, J. Ding, and A. O. Adeyeye,Appl. Phys. Lett.104(4), 042403 (2014).
10S. S. Kalarickal, P. Krivosik, M. Z. Wu, C. E. Patton, M. L. Schneider, P. Kabos, T. J. Silva, and J. P. Nibarger,J. Appl.
Phys.99(9), 093909 (2006).
11F. G. Aliev, J. F. Sierra, A. A. Awad, G. N. Kakazei, D. S. Han, S. K. Kim, V. Metlushko, B. Ilic, and K. Y. Guslienko,Phys.
Rev. B79(17), 174433 (2009).
12J. Podbielski, D. Heitmann, and D. Grundler,Phys. Rev. Lett.99(20), 207202 (2007).
13R. Zivieri, P. Malago, L. Giovannini, S. Tacchi, G. Gubbiotti, and A. O. Adeyeye,J. Phys. Condens. Matter25(33), 336002 (2013).
14L. Giovannini, F. Montoncello, and F. Nizzoli,Phys. Rev. B75(2), 024416 (2007).
15M. Grimsditch, L. Giovannini, F. Montoncello, F. Nizzoli, G. K. Leaf, and H. G. Kaper,Phys. Rev. B70(5), 054409 (2004). 16K. Rivkin, A. Heifetz, P. R. Sievert, and J. B. Ketterson,Phys. Rev. B70(18), 184410 (2004).
17F. Montoncello and F. Nizzoli, in Magnetic Properties of Laterally Confined Nanometric Structures, edited by G. Gubbiotti (2006).
18J. Jorzick, S. O. Demokritov, C. Mathieu, B. Hillebrands, B. Bartenlian, C. Chappert, F. Rousseaux, and A. N. Slavin,Phys.