UNIVERSITÀ DEGLI STUDI DI FOGGIA
D
OTTORATO DIR
ICERCA IN“I
NNOVAZIONE EM
ANAGMENT DIA
LIMENTI ADE
LEVATAV
ALENZAS
ALUTISTICA”
(XXIX
CICLO)
TITLE
Impact of engineered food on tumor growth and
chemoresistance in the frame of pancreatic cancer
Dottorando:
Valerio Pazienza
Tutor:
Prof. Alessandro Del Nobile
2
Abstract:
The impact of nutrition (particularly associated with short term starvation (STS)) on major health benefits have been already demonstrated. These include amelioration of cardiovascular diseases, diabetes, insulin resistance, immune disorders, slowing of the aging process and in particular reduced risks of cancer. Recent studies in rodent and in in vitro models uncovered a potential link between STS and improved efficacy of chemotherapy which has already been demonstrated for some types of cancer. The broader objective of the research project developed during the PhD program was to elucidate the role of fasting (or short term starvation, STS) on the intracellular signaling events involved in the chemo-resistance of pancreatic cancer (PC) amidst the most aggressive types of cancer ranked as the fourth leading cause of cancer-related deaths worldwide, in order to implement a new diet formulation, mimicking calories restriction, in order to reverse chemoresistance or inhibit tumor growth. Taking advantage of in vivo xenograft mouse model for pancreatic cancer and in vitro PC cell lines, using biochemical and biomolecular approaches we first aimed to understand in depth the role of STS during the onset of pancreatic cancer in an ad hoc murine model and we then elucidate the molecular mechanisms involved in PC chemoresistance. It is important to systematically identify potential targets, which could serve as biomarkers for cancer prevention, prognosis and treatment. By elucidating the mechanisms involved in PC chemoresistance the results of this study will help scientists to identify new therapeutic targets.
3
Contents
Abstract……….….………page 2 Introduction
1.1 Calories restriction, intermittent fasting and nutrient modifications………..page 4 1.2 The pancreas: structure and functions ………...page 5 1.3 Pancreatic cancer overview……….……….page 7 1.4 Pancreatic cancer biomarkers……….………..page 9
Objectives of the research………..page 10 Materials and methods………...page 12
2.1 Cell Culture and fasting mimicking condition………page 12 2.2 Cell Viability Assay………page 12 2.3 Wound healing Assay………...page 13 2.4 Cell cycle analysis……….…...page 13 2.5 Quantitative Real-Time Polymerase Chain Reaction…….…………page 13 2.6 Immunoblot……..……….………..page 14 2.7 Immunofluorescence………...page 15 2.8 Computational modeling and stochastic simulation………...page 16 2.9 Animal studies………...……….page 16 3.0 Immunohistochemistry……...………page 17 3.1 Microbiome analysis………...page 18 3.2 Determination of metabolites………..page 19 3.3 statistical analysis………...page 20 Results
4.1 Cell viability assay………..page 20 4.2 Fasting inhibits cell migration………...……….page 21 4.3Effect of fasting on cell cycle…………...………...page 22 4.4Fasting augments hENT1 and decreases RRM1 expression……...page 23 4.5 Fasting increases gemcitabine uptake………...………..page 24 4.6 Fasting potentiates gemcitabine effect in a PC xenograft mouse model………....page 25 4.7 hENT1, RR M1, Ki67 and BCL-2 expression in pancreatic
cancer biopsies of mice under fasting condition………..page 26 4.8 Effects of fasting on the mTOR pathway in tumor samples………...page 28 4.9 Effect of ERS diet on pancreatic cancer xenograft mice tumor growth………...page 29 5.0 Characterization of microbiota and metabolites of fecal samples…..page 30
Discussion and conclusion……….page 31 References………...page 35
4
Introduction
The role of dietary restriction regimens such as caloric restriction (CR), ketogenic diet (KD), protein restriction and intermittent fasting (F) in development of cancers has been studied in several preclinical experiments [1]. Beyond heart disease, cancer is the second leading cause of mortality worldwide and its incidence has been growing during the last decades [2]. Diet plays an important role in the initiation, promotion and progression of common cancers as it has been reported in several epidemiological studies [3]. Historically, fasting and calories restriction were performed for both religious and medical purposes [4]. Beyond its traditional practice, these approaches have been demonstrated to have clinical benefits such as amelioration of cardiovascular diseases, diabetes, insulin resistance, immune disorders, slowing of the aging process and in particular reduced risks of cancer [4]. Notably, water-only fasting for 10–14 days has shown that significantly improved hypertension by reducing more than two-fold, systolic blood pressure as compared with that of a combined vegan, low-fat, low-salt diet and exercise [5]. Moreover, for centuries, dietary restriction has been widely associated to health benefits and it has been also consistently shown to extend lifespan in various mammals [6]. Recent studies in rodent and in in vitro models uncovered a potential link between STS and improved efficacy of chemotherapy which has already been demonstrated for some types of cancer [7]. Its anticancer effects have recently been identified via numerous animal experiments. Among various dietary restriction regimens, caloric restriction (CR), intermittent fasting (IF) and carbohydrate restriction/ketogenic diet (KD) are the most studied methods that are beneficial for cancer prevention, progression and chemoresistance reversal. It has been shown that CR prevents
5 tumorigenesis by decreasing metabolic rate and oxidative damage [3]. CR commonly consist in more than 30% restriction in calories independently of the nature of nutrient elements. The mechanism of F consists in retarding tumor growth by starving tumors from glucose for a short period [7]. In fact complete fasting (food deprivation with normal access to water) is applied usually for cycles of 24-48hours and lately suggested to be performed before chemiotherapy session. KD is composed of low carbohydrates (usually less than 50 g/day), high fat and enough proteins and it hampers glucose for ATP production and energy derivation in cancer cells [8, 9, 10]. Caloric restriction and ketogenic diet are effective against cancer in animal experiments while the role of intermittent fasting is doubtful and still needs exploration. More clinical experiments are needed and more suitable patterns for humans should be investigated. The main aim of the doctoral thesis was to assess the effect of fasting cycles on the efficacy of gemcitabine, a standard treatment for PC patients, in vitro and in an in vivo pancreatic cancer mouse xenograft model. This objective will be addressed using a combination of mouse model of PC, cell culture models, biochemical, biomolecular and high-throughput sequencing approaches followed by in-silico functional analysis. The research efforts proposed in this project may open the way to new clinical strategies and therapeutic approaches to overcome the resistance of PC to conventional anticancer therapies.
The Pancreas: structure and functions.
The pancreas is an elongated, spongy, about six to ten inches long, tapered organ located across the back of the abdomen, behind the stomach playing an essential role in converting the food into fuel for the body's cells. The pancreas
6 has two main functions: an exocrine function that helps in digestion and an endocrine function that regulates blood sugar.The right side which is the wide part of the organ is called the head. The tapered central part of the pancreas is called body and it ends near the spleen, called the tail. Pancreas is surrounded by several major blood vessels: the superior mesenteric artery, the superior mesenteric vein, the portal vein and the celiac axis, supplying blood to the pancreas and other abdominal organs. 95% of the pancreas consists of exocrine tissue which is involved in the production of pancreatic enzymes for digestion. The remaining tissue is constituted by endocrine islets called islets of Langerhans. The latter produce hormones involved in the glucose homeostasis and regulate pancreatic secretions. A healthy pancreas produces the correct chemicals/enzymes in the proper quantities, timely related, to digest the ingested food. In fact the pancreas comprehends exocrine glands that produce enzymes important to digestion. Trypsin and chymotrypsin to digest proteins, amylase for the digestion of carbohydrates, and lipase to break down fats. The pancreatic juices are released into ducts that terminate in the main pancreatic duct when food enters the stomach. In the ampulla of Vater, the pancreatic duct connect with the bile duct to produce another important digestive juice called bile. The pancreatic juices and bile that are released into the duodenum, help the body to digest fats, carbohydrates, and proteins. Islet cells (islets of Langerhans) release important hormones directly into the bloodstream. Two of the main pancreatic hormones are insulin, which acts to lower blood sugar, and glucagon, which acts to increase blood sugar. Maintaining proper sugar homeostasis is crucial to the functioning of key organs including the brain, liver, and kidneys.
7
Diseases of the Pancreas
Disorders affecting the pancreas include pancreatitis, precancerous conditions such as PanIN and IPMN, and pancreatic cancer. Pancreatitis is inflammation of the pancreas that occurs when pancreatic enzyme secretions begin to digest the organ itself. It may evolve as a chronic condition that progresses over a period of years.
But the main critical disease condition for the pancreas is pancreatic cancer. Its causes are still unknown. Up to date there only few risk factors that well known such as cigarette smoking, a family history of pancreatic cancer or hereditary cancer syndromes, and chronic pancreatitis. In addition, certain pancreatic lesions such as Intraductal Papillary Mucinous Neoplasms (IPMNs) and Pancreatic Intraepithelial Neoplasia (PanIN) are considered precursors to pancreatic cancer.
Pancreatic cancer overview
Pancreatic cancer (PC) is ranked as the fourth leading cause of cancer related deaths worldwide [11] and it is estimated to be the second cause of cancer related deaths in the next decades. PC is often diagnosed at advanced stage of disease due to the absence of early symptoms rendering current treatment options ineffective. Moreover, since it is extremely aggressive and chemotherapy resistant, 80-90% of PC patients are not eligible for resection at presentation, meaning that the available therapeutic strategies based on conventional chemotherapy are largely unsatisfactory if we consider that less than 5% will survive up to 5 years [12, 13]. Scientists are boosting their efforts in order to find an effective treatment or novel therapeutic approaches to overcome the resistance of PC to conventional anticancer therapies. A standard
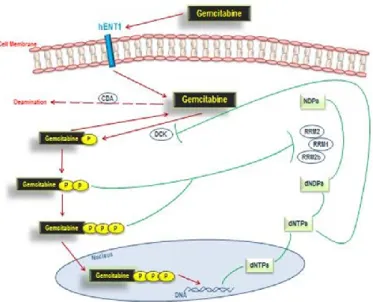
8 therapy for treatment of patients with PC with either curative or palliative intent is gemcitabine [14]. The latter is a nucleoside analogue (similar to cytosine, figure 1) with tumor growth arrest properties due to the two fluorines on the carbon 2', instead of the hydrogen atoms, which render unstable the
DNA chain during the replication process.
Figure 1. Chemically gemcitabine is a nucleoside analog (similar to cytosine) in which the hydrogen atoms on the 2' carbon of deoxycytidine are replaced by fluorine atoms.
Gemcitabine is taken up within pancreatic cancer cells primarily by human equilibrative nucleoside transporter 1 (hENT1) [15]. After being phosphorylated by dCK (deoxycytidine kinase) to its active form, it finally exerts its anti-tumor growth properties (figure 2). Several studies analyzed the expression of hENT1 as it was expected to be predictive for clinical outcomes in pancreatic cancer patients treated with gemcitabine [15]. At the same time gemcitabine inhibits the human ribonucleotide reductase (RRM1), a key enzyme involved in the homeostasis of nucleotide pools affecting cell proliferation, migration and metastasis [16], which was also found to improve survival in gemcitabine-treated patients displaying lower levels of RRM1, whereas higher levels did not [17, 18]. The main reason for the poor response to gemcitabine, or other analogue nucleosides, is thought to be acquired resistance [19], which may occur with different processes [20]: a) the attenuation of analogue nucleosides phosphorylation via suppression of dCK,
9
b) the facilitation of analogue nucleosides inactivation by induction of CDA
(deaminase) c) the facilitation of dNTPs (nucleotides) production by induction
of ribonucleotide reductase d) the attenuation of analogue nucleosides uptake by induction of expression of multiple drug resistant proteins, (MRPs) or by decreasing expression of drug transporter hENT1 [15].
Pancreatic cancer biomarkers
Screening tests for the general population have to be accurate, safe, and convenient, as well as capable of high throughput. Many serologic markers have been designated to be potential biomarker during the screening for PC detection: CA 19-9, CA-242, CA-50, CEA, CEACAM1, MIC1, MUC1, alpha-fetoprotein, DU-PAN-2 mAb, alpha4GnT; apoptosis markers: NF-kB, hTert and CK-19; cytokines like IL-8; adhesion molecules: ICAM-1, 2, MMP-9; growth and angiogenesis factors such as EGFR, IGFBP-1. Table 1 summarize these and others serum biomarkers studied as potentially useful in patients diagnosed with pancreatic cancer. CA19-9 is the routinely used and FDA approved tumor markers, but it has poor specificity and sensitivity for pancreatic cancer, being elevated in many cancers of the upper gastrointestinal tract, in ovarian cancer, hepatocellular cancer and in benign conditions of the hepatobiliary system [21]. Unfortunately, none of these markers have achieved the levels of sensitivity and specificity to be recommended as screening asymptomatic patients in the general population, therefore, the search for novel biomarkers that would allow the early detection of disease is ongoing.
10
Figure 2. Gemcitabine pathway. Objectives of the research
Major health benefits associated with dietary restriction have been demonstrated, such as amelioration of cardiovascular diseases, diabetes, insulin resistance, immune disorders, slowing of the aging process and reduced risks of cancer [4, 22]. Recent studies in rodent and in in vitro models uncovered a potential link between short term starvation and improved efficacy of chemotherapy for some types of cancer [7, 23, 24]. Up to date, no data are available on the effect of short term starvation on pancreatic cancer while it was recently published an association between caloric restriction and pancreatic cancer [25]. The doctoral project aims to investigate whether fasting is able to improve chemotherapeutic efficacy in pancreatic cancer cells and in a PC xenograft mouse model. Our breakthrough study uncovered a potential link between short cycles of fasting and improved effectiveness of chemotherapy [23]. Specifically, short term (24h) starvation achieved with fasting mimicking medium (see material and methods), increases the uptake of gemcitabine by tumor cells, reversing the chemoresistance phenotype. Consistently in vivo,
11 when xenograft pancreatic cancer mice were fasted 24h fasted prior gemcitabine injection, mice significantly decreased tumor volume as compared to control mice and they show decreased levels of the proliferation marker Ki67. In addition, fasting mimicking medium shifts cells to G0/G1 phase of the cell cycle. However, when shifting this therapeutic approach from animals to humans some objective difficulties may arise: cancer patients may refuse to follow the fasting regimen and fasting may worsen the cachexia often occurring in cancer patients. Therefore, alternative approaches are needed to take advantage of the benefits of fasting without requiring sacrifices from the patients. In this regard, in the second part of the project we focused on replacing dietary carbohydrates, recognized as pivotal elements in the metabolism of cancer cells promoting cancer growth [26], with an established percentage of resistant starch formulating an innovative diet (patent pending) in order to mimic fasting approach. Reports already exist about a role of a low-carbohydrate diet in reducing tumor growth, but in these diets a higher content of protein or fat was supplied as alternative energy source [27, 28]. Conversely, we formulated an engineered resistant-starch (ERS) diet in which resistant starch is used. Resistant starch is not digestible, so when joins the large intestine it is fermented by resident bacteria to produce bioactive metabolites such as short chain fatty acids (acetate, propionate, butyrate, valerate), other organic acids (lactate, succinate and formate), gases and alcohols [29]. On the other hand common starch is metabolized by the enzymes of the small intestine to release glucose. It is also known that diet can modulate the composition of the gut microbiota [30, 31], whose alterations are increasingly emerging as a key factor in the development of metabolic disorders and gastrointestinal diseases [32, 33, 34], including extra-intestinal
12 cancers [35, 36]. Several studies linked the alterations in oral and gut microbiota composition with the development of pancreatic cancer, which is may be due to the ability of certain bacterials to sustain cancer-promoting inflammation [37, 38, 39]. We also assessed whether this dietary interventions shapes microbiota and it may be beneficial in reducing tumor growth and thus may be used in the clinical practice to synergize the conventional therapies.
Materials and methods
Cell Culture and fasting mimicking condition
BxPC-3, and PANC-1 cells were cultured either in control DMEM medium (CM) 2g/L glucose supplemented with 10% fetal bovine serum (FBS), 100 U/ml penicillin and 100 µg/ml streptomycin (Invitrogen Life Technologies, Milan, Italy) in 5% CO2 atmosphere at 37°C or in fasting mimicking medium (FMM) DMEM (0.5g/L glucose and 1%FBS). MIAPaCa-2 were maintained in control RPMI medium (Invitrogen Life Technologies, Milan, Italy) or in fasting mimicking condition RPMI medium as described elsewhere.
Cell Viability Assay
Trypan Blue Viability test at 24h and 48h upon gemcitabine treatment at a concentration range between 0.5 µM and 2.5 µM was carried out to assess cell viability. After trypsinization and resuspension in complete medium cells were diluted 1:1 using a 0.4% Trypan Blue solution (Sigma Aldrich, Milan). After one minute of incubation at room temperature, live and dead cells were counted using an hemocytometer (Biosigma) and the percentages of viable cell was calculated as (n° of cell alive/ n° of total cells)x100 under a light microscope (Nikon Eclipse TS100).
13 Wound healing assay
Approximately 3x10⁵ cells were seeded into 6-well plate and were cultured to confluence in control media for 48h and fasting media for further 24h. 10µL filter tips was used to perform two perpendicular scratches. The media were replaced with control or Fasting media and the cell were treated with 1µM Gemcitabine. For each well three fields were chosen by marking with parallel lines on the external side of the plate. Images were taken for each field at 0h, 24h and 48h using a Canon Eos 40D. Image J software was used to measure the area of wound for all the fields of each well using.
Cell cycle analysis
Cells were harvested and then fixed with 1ml of -20°C cold 70% ethanol. As indicated by the Muse Cell Cycle Kit User’s Guide 200μl of ethanol-fixed cells were incubated with propidium iodide and RNAse A for 30 minutes at room temperature, before loading on Muse Cell Analyzer (Millipore, Italy) according to the supplied staining protocol.
Quantitative Real-Time Polymerase Chain Reaction
Total RNA was extracted from plated cells and PC biopsies using RNeasy Mini Kit (Qiagen, Milan, Italy) and subsequently treated with deoxyribonuclease I, according to the manufacturer’s instructions. RNA concentration was assessed using Nanodrop spectrophotometer. Quantitative real time PCR for determining the expression levels of hENT1 was performed on 50 ng of purified RNA using the one step Quantifast SYBR Green RT PCR KIT (Qiagen) and the Human SYBR Green QuantiTect Primer Assay for all the
14 genes involved in the studies were purchased from Qiagen. Reactions were set up in 96-well plates using a 7700HT Real-Time PCR System (Applied Biosystems, Foster City, CA), and all samples were assayed in triplicate. Optical data obtained were analyzed using the default and variable parameters available in the SDS software package (version 1.9.1; Applied Biosystems, Foster City, CA). Expression levels of target gene were normalized using the housekeeping control gene: TATA binding protein (TBP, QT00000721). mRNA amount of each target gene relative to TBP was calculated through the comparative Ct method, also called the 2(-ΔΔCt) method. Data are presented as the mean ± SE of at least three independent experiments.
Immunoblotting
Total protein extraction from adherent cells and from snap frozen pancreatic cancer xenograft specimens was obtained using homemade Sample Buffer Leammli 2x (50 mM Tris–HCl, pH 6.8, 100 mM dithiothreitol, 2% sodium dodecyl sulfate, 0.1% bromophenol blue, 10% glycerol) supplemented with 2x protease inhibitor cocktail (COMPLETE; Roche Diagnostics, Mannheim, Germany), 1 mM phenylmethylsulphonyl fluoride and 1 mM sodium orthovanadate as already described [43] and through mechanical and detergent based lysis, Ripa buffer (150 mM NaCl, 50 mM tris HCl pH 7.4, sodium dodecyl sulfate (SDS) 0,1%, triton 1%, ethylenediaminetetraacetic acid (EDTA) 5 mM and 1% cholic acid sodium salt), supplemented with protease inhibitor cocktail (COMPLETE; Roche Diagnostics, Mannheim, Germany), 1 mM phenylmethanesulphonylfluoride and 1 mM sodium orthovanadate, respectively. The same amount of protein extract for each sample was loaded to 9% SDS- polyacrilammide gel and electroblotted on PVDF membrane
15 (Whatman, Dassel, Germany) for 60 min at 60V. Membranes were incubated overnight at 4°C with primary antibody diluted 1:1000 into Blocking Buffer (1.25% Blotting Grade Biorad, 5% Sodium Azide in washing buffer) as previously reported [43]. Primary antibodies used were: rabbit polyclonal antibody hENT1 (H-115) (sc-134501), phospho AKT (sc-33437), mouse monoclonal antibody β-Actin (C4) (sc-47778) from Santa Cruz Biotechnology; antibodies against AKT(#9272), mTOR (#2972), phospho-mTOR (#2974), p70S6K (#9202), phospho- p70S6K (#9205) and RRM1 (#8637) were purchased from Cell Signaling. The membranes were washed three times with washing solution (1x Tris-Buffered Saline, 0.1% Tween 20 Sigma) and incubated for one hour at room temperature with appropriate secondary antibodies (BioRad, Hercules, CA goat anti-mouse and goat-antirabbit) diluted 1:3000. Membranes were washed several times with washing solution prior to detect the antigen-antibody complexes by enhanced chemiluminescence (ECL; Amersham Biosciences) with the signal detected on X-ray film (Amersham Biosciences) according to the manufacturer’s instructions.
Immunofluorescence
Cells were grown on coverslips and fixed by incubating for 10 minutes at room temperature with 4% paraformaldehyde. Subsequently cells were incubated for 2 minutes with 0.3% Triton X 100 to permeabilize cells. The coverslips were washed three times with Phosphate-Buffered-Saline solution (PBS) and incubated overnight at 4°C with the primary antibody rabbit polyclonal hENT1 (H-115) (sc-134501) diluted in PBS at ratio of 1:50. After three washes with PBS, secondary antibody incubation was carried out for 1h at room temperature using rhodamine labeled anti-rabbit antibodies (Jackson Lab)
16 diluted at 1:100. Coverslips were washed again with PBS three times prior to be mounted on slides using Vectashield H1-200 (DBA Milan, Italy). A Nikon Eclipse E600 microscope was used for immunofluorescence analysis.
Computational modeling and stochastic simulation
The hENT1 dynamics, was modeled in Systems Biology Graphical Notation (SBGN). The model focused on the transport of Gemcitabine within the cells. The key features of the model were the ability to represent both events like chemicals transport and reaction modulation, and species localization and compartmentalization. The SBGN model was translated into Systems Biology Markup Language (SBML), a simple and well known XML-based language, which adds components that reflect the natural conceptual constructs used by Systems Biology modelers [40]. Two semi quantitative models were obtained by adding information about the initial concentrations of the molecules constituting the two different media of the cells. These were then temporally simulated by Cyto-Sim: a formal language model and stochastic simulator of membrane-enclosed biochemical processes [41], in a computational parallel [42] environment yielding a thousand trajectories mimicking the Gemcitabine transport within the cell.
Animal studies
We conducted our mouse work in an AAALAC (Association for Assessment and Accreditation of Laboratory Animal Care International) accredited experimental facility. Animal protocols were approved by the Institutional Animal Care and Use Committee (IACUC approval number is ANM13-001). 5-6 weeks old female Nu/Nu mice were maintained in a specific pathogen-free (SPF) environment throughout the experiments. BxPC‐3‐luc cancer cells were
17 cultured and s.c. injected into Nu/Nu nude mice (right flank). A total number of 5×10⁶ tumor cells per mouse was suspended in 0.1 mL of PBS/ matrigel mixture (1:1) and then injected. When tumor size reached an average volume of 100 mm3, BxPC‐3‐luc tumor‐bearing nude mice were randomly assigned into 4 groups (6 mice/group) and started dosing immediately. Group 1 (Normal saline, i.p, qw), group 2 (Gemcitabine, 100 mg/kg, i.p, qw), group 3 (the mice in this group were fasted 24h before by giving normal saline, i.p, qw), group 4 (the mice in this group were fasted 24h before by giving Gemcitabine, 100mg/kg, i.p, qw). For fasting, mice were single caged and maintained in standard cages without access to food for 24 hours. Cages were changed immediately before the initiation of fasting cycle in order to avoid coprophagy or feeding on residual chow. Animals had free access to water. Gemcitabine was dissolved in saline (0.9% NaCl w/v in water) to generate a final concentration of 10 mg/mL. The drug was freshly dissolved before use, and the solution was homogeneous before injections. The i.p. injection volume was 100ul/10g mouse weight. For the second part of the project using the ERS diet, BxPC‐3‐luc tumor‐bearing nude mice were randomly assigned into 2 groups (6 mice/group): group 1 (under standard diet) and group 2 (under ERS diet). Animals had free access to water. Fresh fecal samples were collected before and after cancer induction from both feeding groups. The fecal samples were collected into a regular sterile 1.5 ml eppendorf and kept frozen at -80°C until use in cultivation experiments.
Immunohistochemistry
Formalin-fixed, paraffin-embedded pancreatic mice cancer sections allocated in the four different groups were immunostained by using commercially
18 available detection kit (EnVision™ FLEX+, Dako, Glostrup, Denmark) following the manufacturer’s protocol as previously described. Primary antibody for hENT1 was purchased from Santacruz (cat. no. sc-134501) and diluted 1:75 while Ki67 (cat. no. M7240) and BCL2 (cat. no. M0887) were from Dako. The specificity of all reactions was checked replacing the primary antibody with normal serum alone. Positive and negative controls were used as appropriate and were run concurrently. hENT1 immunoreactivity was evaluated blindly by an expert pathologist assessing a semiquantitative scoring system in ten high power fields (10HPF, X 400) according to a semiquantitative scale from negative to 3+ (-: 0%; +: 1-33%; ++: 34-66%; +++: 67-100%).
Microbiome analyses
DNA was extracted from cell’s pellet using MoBioPowerFecal DNA extraction kits (MoBio, Carlsbad, Canada) according to the manufacturer’s instructions. Universal primers S-D-Bact-0341-b-S-17 Forward 5´ TCGTCGGCAGCGTCAGATGTGTATAAGAGACAGCCTACGGGNGGC WGCAG
F and S-D-Bact-0785-a-A-21 Reverse 5´
GTCTCGTGGGCTCGGAGATGTGTATAAGAGACAGGACTACHVGGGT ATCTAATCC were used for PCR amplification of the V3-V4 hypervariable regions of 16S rRNA genes [43]. The amplified region was about 450 bp and in average 12000 reads per sample were obtained. The mixture of amplicons was pyrosequenced using IluminaMiSeq 2x250 v2 platform. Sequence data was analysed using BION-meta, an open source program, according to author´s instructions. First, sequences were cleaned at both ends using a cut-off for
19 minimum quality of 95%, followed by removal of shorter reads than 350 bp. Second, sequences were clustered based on a minimum seed similarity of 99.5% (consensus reads). Last, consensus reads were taxonomically aligned to the SILVA reference 16S rDNA database (v123) using match minimum of 90%.
Determination of metabolites
Samples from the beginning and end of the growth experiments were analyzed for microbial 16S rDNA sequence and metabolites. The samples were centrifuged (21000g, 10 min), solution of 10 % sulfosalicylic acid was added to the supernatant (1:0.25 vol/vol) and both pellet and supernatant stored at -20°C until the analysis. Before chromatographic analyses the supernatant samples were centrifuged (21000 g, 15 min, 4°C) and filtered through 0.20 µm PTFE syringe filters (Millex filters SLLGH13NK, Millipore). The initial (0 h) samples were additionally ultra-filtered using AmiconR Ultra-10K Centrifugal Filter Devices, cut-off 10kDa (Millipore). The concentrations of organic acids (succinate, lactate, formate, acetate, propionate, isobutyrate, butyrate, isovalerate, valerate), glycerol and ethanol were determined by high-performance liquid chromatography (HPLC, Alliance 2795 system, Waters, Milford, MA), using a BioRad HPX-87H column (Hercules, CA) with isocratic elution of 0.005 M H2SO4 at a flow rate of 0.5-0.6 mL/min at 35°C. Refractive index (RI) (model 2414; Waters) and UV (210 nm; model 2487; Waters) detectors were used for quantification of the substances. Detection limit for the HPLC was 0.1 mM.
20 Statistical analysis
Results are expressed as mean ± SE. Comparisons were made using Student’s t-test. Differences were considered as significant when P < 0.05 (*) or P < 0.01 (**) or P < 0.001 (***).
Results
Cell viability assay in fasted and non-fasted pancreatic cancer cells.
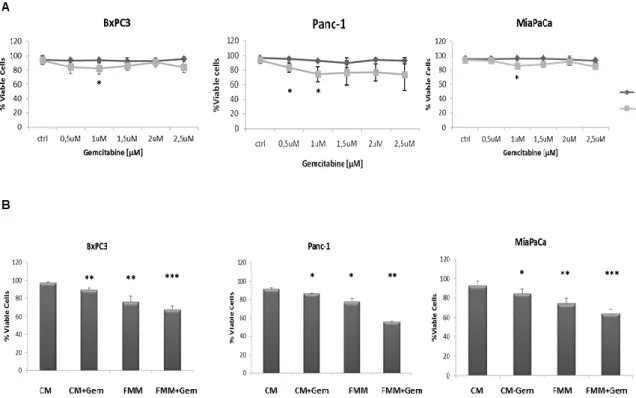
As a first step a time and dose response curve was performed in order to establish the effect of gemcitabine on the viability of three PC cell lines, BxPC3, Panc-1 and MiaPaCa-2. As shown in figure 3A, 1μM of gemcitabine slightly reduced cell viability in all the cell lines and this concentration was used in all subsequent in vitro experiments. Of note, higher concentrations of gemcitabine did not affect cell mortality rate, most likely because higher-dose of gemcitabine treatment enriches chemotherapy resistant cells as already demonstrated [44]. When gemcitabine and fasting mimicking medium (FMM, 0.5g/L glucose and 1% FBS) treatments were combined, pancreatic cancer cells displayed the highest death rate compared to FMM or gemcitabine added to a control standard medium alone (CM, 2g/L glucose and 10% FBS) (Fig.
21 3B).
Figure 3. Cell viability assay. BxPC-3, PANC-1 and MiaPaca-2 cells were treated for 24h and
48h with gemcitabine at a concentration range between 0.5 µM and 2.5 µM (A). Cell viability assay was performed on cells growing on control (CM) or fasting mimicking medium (FMM) after 48h of gemcitabine treatment at a concentration of 1 µM, including untreated cells used as control samples (B). Results are expressed as means ± SE. Differences were considered as significant when P < 0.05 (*) or P < 0.01 (**) or P <0.001 (***).
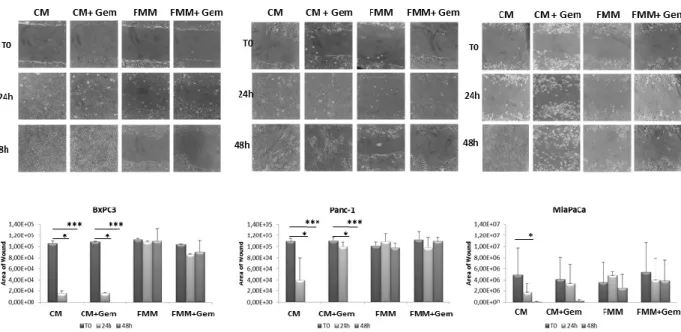
Fasting inhibits cell migration.
To investigate the effect of fasting on pancreatic cancer cell migration, a key event in carcinogenesis, we performed an in vitro wound-healing assay. Gemcitabine in combination with FMM significantly reduced cell migration of BxPC3, PANC-1 and MIAPaCa-2 while gemcitabine treatment alone failed to do so (Fig. 4A-B). Remarkably, FMM alone was as effective as combined treatment in inhibiting cell migration (Fig. 4A-B).
22
Figure 4. Wound healing assay. Cell migration of BxPC3, PANC-1 and MIAPaCa-2 upon
treatment with gemcitabine alone (1μM) or in combination with fasting mimicking medium (A). The area of wound was measured for all the fields of each well using Image J (B).
Effect of fasting on cell cycle.
Cell cycle impairment is one of the main tumor arrest properties of gemcitabine [45]. We evaluated a cell cycle analysis to assess the effect of gemcitabine alone or in combination with FMM on PC cells as compared to PC cells cultured in CM. Figure 5 shows that PC cells treated with gemcitabine in CM condition displayed a slight but non-significant increase in G0/G1 phase while combined treatment (fasting plus gemcitabine) significantly increased the percentage of PC cells in G0/G1 phase, with decreased S phase (synthesis) and G2/M phase in BxPC3 and PANC-1 cells. Although the percentage of cells in G0/G1 phase was increased upon combined treatment in MIAPaCa-2 cells, the latter did not reach statistical significance.
23
Figure 5. Cell cycle analysis. BxPC3, PANC-1 and MIAPaCa-2 upon treatment with
gemcitabine alone (1μM) or in combination with fasting mimicking medium were subjected to cell cycle analysis using the Muse Cell Analyzer (A). Table in panel B shows the quantitative measurements reported as means ± SE.
Fasting augments hENT1 and decreases RRM1 expression.
To better understand the mechanism through which fasting was more effective than control media, we hypothesized that the low glucose level contained in the fasting medium could be responsible for the activation of the nucleoside transporter protein (hENT1) as reported in other studies [46-49], potentiating the gemcitabine effect in inhibiting RRM1 expression. As shown in Figure 6A, hENT1 mRNA expression increased upon exposure of BxPC-3 and MIAPaCa-2 cells to FMM and FMM plus gemcitabine while no significant changes were observed in PANC-1 cells. At the protein level, hENT1 increased in all cell lines when subjected to FMM (Fig. 6B). Furthermore, FMM and FMM plus gemcitabine significantly reduced RRM1 mRNA levels in BxPC3 and Panc-1
24 cells, but not in MIAPaCa-2 (Fig. 6C), whilst RRM1 protein expression was reduced in all cell lines as compared to controls (Fig. 6D).
Figure 6. hENT1 mRNA and protein expression by qRT PCR and immunoblot (column A and
column B) in control PC cells and treated with fasting +/- gemcitabine. RRM1 mRNA and protein expression by qRT PCR and immunoblot (column C and column D) in control PC cells and treated with fasting +/- gemcitabine.
Fasting increases gemcitabine uptake.
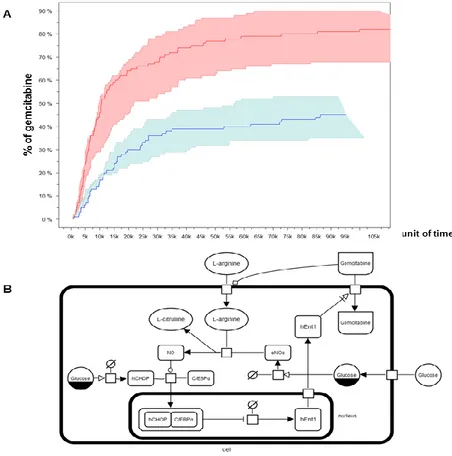
In human endothelial cells high glucose leads to increased synthesis of nitric oxide (eNOS) and reduced uptake of adenosine-like molecules (such as gemcitabine) through a reduced expression and activity of human hENT1 [47] which is thought to be mediated by the transcription factor hCHOP–C/EBPα complex [47]. According to this model, glucose molecules interfere with hENT1 transcription through the enhancement of eNOS, resulting in hCHOP-C/EBPα transcription complex formation and shuttling to the nucleus (Fig. 7B). To unravel the indirect relationship between fasting and gemcitabine
25 uptake rates in PC cells we adopted stochastic modeling. Varying the concentration of glucose from 2g/L (CM regimen) to 0.5 g/L (FMM regimen) and considering a concentration of gemcitabine of 1μM, we drew stochastically the quantitative evolution of gemcitabine uptake for a maximum of 115 thousands of simulated units of time. To guarantee solid confidence intervals, we simulated the modeled system under both diet regimes a thousand times and monitored the temporal concentration changes of gemcitabine within the cell. We then verified that the CM medium contributed to a mean gemcitabine uptake of 40%, while FMM medium more than doubled (82.3%) its mean transport rate (Fig. 7A).
Figure 7. Modeling and simulation of Gemcitabine uptake.
Fasting potentiates gemcitabine effect in a PC xenograft mouse model.
We then evaluated the effects of combined fasting and gemcitabine treatment in a xenograft pancreatic cancer mouse model. As shown in Figure 8 mice
26 subjected to 24h of complete fasting before gemcitabine injection displayed a significant retarded progression of pancreatic cancer tumor (p=0.04). Notably, fasting in the absence of chemotherapy was as effective as gemcitabine alone, although this was just below the statistical significance.
Figure 8. Effect of Fasting on PC tumor. BxPC‐3‐luc tumor‐bearing nude mice were randomly
assigned into 4 groups and started dosing immediately. Bioluminescence signaling measured as photons/sec (A). The tumor masses were harvested, photographed and weighed (B).
hENT1, RR M1, Ki67 and BCL-2 expression in pancreatic cancer biopsies of mice under fasting condition.
Since a potential prognostic role for hENT1 and for RRM1 has been postulated [15, 50], and increased hENT1 levels enhance the response to gemcitabine in human pancreatic cancer [48] and are associated with a longer survival [15-51], we then assessed hENT1 protein expression in pancreatic cancer biopsies of the nude mice allocated in the four treatment groups. In Fig. 7A it is shown that hENT1 expression was more prominent in PC mice subjected to combined fasting and gemcitabine treatment as compared to control mice. 5 out of 6 (83%) mice subjected to 24h of complete fasting prior to gemcitabine injection (Fig. 9A panel h) displayed positive levels of hENT1 as compared to mice allocated in gemcitabine (f) and fasting alone (g) groups (50%). 60% of
27 control mice (panel e) showed negative hENT1 expression whilst the remaining 40% showed a weak signal. As for RRM1, an inverse correlation between RRM1 mRNA and protein levels was found: tissue samples from pancreatic cancer biopsies of the nude mice with higher levels of RRM1 mRNA (mice treated with gemcitabine, fasting or fasting plus gemcitabine treatment) displayed lower levels of the protein (Fig. 9B), suggesting the existence of a post-transcriptional feedback mechanism within xenograft tumor between mRNA and protein levels of RRM1. Additionally we investigated the expression of markers of proliferation and cell death/apoptosis in pancreatic cancer biopsies from mice. As reported in Figure 9A, Ki67 positivity was higher in the control group (panel i) with 60% of mice displaying the highest positive level for Ki67 while 40% of mice in the gemcitabine group (panel l) and only 16% of mice in the fasting group (panel m) were positive for Ki67 staining. In the fasting plus gemcitabine group, all mice displayed intermediate levels of Ki67 (panel n). On the other hand BCL-2 expression was undetectable in all pancreatic cancer biopsies (panel o, p, q, r).
Figure 9. Immunoistochemical evalutation of hENT1, Ki67 and BCL-2 expression in PC
biopsies of mice allocated in to the 4 different groups. Representative H&E pictures, hENT1, Ki67 and BCL-2 immunohistochemical expression of pancreatic sections (figure 9A) from control (a-e-i-o) gemcitabine treated (b-f-l-p), fasted (c-g-m-q) and fasted plus gemcitabine (d-h-n-r) treated mice (40X magnification). hENT1, Ki67 and BCL-2 immunoreactivity was evaluated in blind using a semiquantitative scoring system in ten high power fields (10HPF, X 400) according to a semiquantitative scale (-: 0%; +: 1-33%; ++: 34-66%; +++: 67-100%). RRM1 mRNA and protein expression levels measured by qRT-PCR and by immunoblot
28 respectively in control, gemcitabine treated, fasted and fasted plus gemcitabine treated mice (B).
Effects of fasting on the mTOR pathway in tumor samples.
The protective effect of fasting may in part be due to the inhibition of the nutrient-sensing mTOR pathway in normal cells and also in vitro "fasting" and rapamycin protect normal cells and increase cytotoxicity in cancer cells [52, 53]. For this reason we investigated Akt and mTOR activity in pancreatic cancer mice’ biopsies. As shown in figure 10, no changes were observed in the activity of Akt, whereas significant changes were found in mTOR activity. In detail, gemcitabine treatment alone caused a significant increased phosphorylation levels of mTOR, which was abolished when combined with fasting. As concerns the downstream effector of mTOR, namely p70S6K, a trend towards a decrease in activity, without reaching statistical significance, was observed in all three groups gemcitabine, fasting, and fasting plus gemcitabine.
Figure 10. Immunoblot detection of AKT, ph-AKT(Ser473), mTOR, ph-mTOR(Ser2481),
p70S6K, ph-p70S6K(Thr389) in tumor samples (A) of control, gemcitabine treated, fasted and fasted plus gemcitabine treated mice. Quantitative measurement of proteins associated signal by densitometry (B).
29 Effect of ERS diet on pancreatic cancer xenograft mice tumor growth.
Since fasting may worsen the cachexia, often occurring in cancer patients, alternative approaches are needed to take advantage of the benefits of calorie restriction without requiring special sacrifices from the patients. For this purpose, we focused on dietary carbohydrates, recognized as pivotal elements in the metabolism of cancer cells and as promoters of cancer growth [54] formulating an engineered resistant-starch (ERS) diet in which corn starch was replaced by resistant starch. We then evaluated the effects of ERS diet treatment in a xenograft pancreatic cancer mouse model. As shown in Figure 11 (A and B), mice subjected to ERS diet displayed a slight but significant retarded progression of pancreatic cancer tumor (p=0.04) as compared to control mice. No significant differences in total body weight were observed between the two mice groups (Figure 11C). We also assessed the expression of proliferation and cell death/apoptosis markers in pancreatic cancer biopsies from mice. Ki67 positivity was higher in mice fed with control diet with 60% of mice displaying the highest positive levels (Figure 3D panel b) while 40% of mice in ERS diet group (panel e) were positive for Ki67 staining.
30
Figure 11. Effect of ERS diet on PC tumor. BxPC‐3‐luc tumor‐bearing nude mice were
randomly assigned into 2 groups when tumor size reached an average volume of 100 mm3. Group 1 (standard diet), group 2 (ERS diet). Bioluminescence signaling measured as photons/sec. The tumor masses were harvested and tumor volume was evaluated. Body weight was also evaluated. H/E, Ki67 and Ki67 staining of PC biopsies of mice belonging to the two different groups.
Characterization of microbiota and metabolites of fecal samples
In total, 65 bacterial taxa that exceed 0.5 % relative abundance in feces of control and/or in ERS diet fed mice were found. Initial composition of fecal consortia was dominated by phylum Firmicutes (over 50%). The major taxa represented in the samples belonged to Lactobacillus, Lachnospiraceae, Bacteroides, Blautia, Aeromonas and Escherichia (Figure 12). The majority of the detected bacteria were present in all fecal samples. Bacteroides acidifaciens and Esherichia sp. were the dominant species (5-20 and 6-8 %, respectively) in cancer xenografted mice fed with control diet while species of Blautia and Aeromonas were dominant (over 15 %) in cancer xenografted mice fed with ERS diet. The only species found only in fecal samples of mice fed with ERS diet and before, but not after, cancer induction was Bacteroides thetaiotaomicron (relative abundance of 1%). The latter was also detectable in minor amounts (0.1%) in xenografted mice fed with control diet. The metabolite profiles differed between fecal samples depending on the nourish (control vs ERS diet). The main fermentation product before cancer induction was acetate (53 and 56 % from all acids produced on control or ERS diet, respectively) followed by propionate, succinate and lactate while butyrate was detected only in negligible amounts (Figure 12B). After cancer induction significant reduction in acetate production was observed on both diets (2.5 and 9 folds on control and ERS diet, respectively), which was replaced by
31 propionate production especially on control diet. It is remarkable that no lactate was produced by control diet while succinate production was negligible by ERS diet. Total acid production before cancer induction was similar on both diets, however, after the induction it was almost two times reduced on ERS diet from 105 to 59mmol/gDW but not on control diet.
Figure 12. Composition of bacterial taxa in individual fecal samples. Panel (A) shows the most
abundant 20 bacterial taxa of fecal samples with average abundance at least 1 % (average sum of reads in relative scale, %). Before and after indicate time when samples are taken in respect to cancer treatment. (B) Metabolic scheme and amount of organic acids in mice fecal samples (mmol/g-feces) before (B) and after (A) the cancer induction. Cont - control diet, ERS - resistant starch diet. Bacterial names on the pathway lines indicate the genera identified from the samples.
Discussion and conclusion
Over the last four decades only small improvements in survival have been achieved for patients with pancreatic cancer, which represents one of the most aggressive cancers due to its therapeutic resistance. This can be partly attributed to the ineffectiveness of chemotherapeutic compounds reaching the cancer cells. It is nowadays accepted that dietary restriction has beneficial health effects, including increased lifespan and cancer prevention [55]. Our and
32 other groups recently revealed an association between calorie restriction and a better response to chemotherapy in certain kinds of cancer [7, 23, 24], among which the pancreatic one [7], as demonstrated both in vitro and in animal models. Dietary interventions have a potential usefulness in fighting human cancers too, but the difficulty for the patient to accept this regimen and the potential worsening of the cancer-related weight loss make the adoption of new approaches necessary. In the current preclinical study as a first step we investigated the effect of fasting cycles on pancreatic cancer progression and then we consequently evaluated whether an engineered diet could be a valid alternative to fasting in counteracting pancreatic cancer.
We assessed the in vitro effects of a ERS mimicking medium (EMM), in which a reduced glucose content from 2 to 0.5 g/L mimicked the decreased intestinal release of glucose due to indigestible resistant starch. All three pancreatic cancer cell lines used, Bx-PC3, MiaPaca-2 and PANC-1 showed a significant decrease in proliferation rate upon EMM, as measured by MTT assay. Consistent results were obtained in vivo, where xenografted mice fed ERS diet showed a significant reduction in tumor volume as compared to mice fed control diet. Since it is known that intestinal microbiota can be easily manipulated by diet that selectively enriches specific microbial groups [56, 57, 58], and that changes in gut microflora can affect the development of several diseases [59, 60, 61], including pancreatic cancer [62], we then investigated on the effects of ERS diet on composition and metabolism of the mice fecal microbiota. In PC xenograft mice, control diet stimulated the growth of Ruminococcus gnavus, Akkermansia muciniphila, Bacteroides acidifaciens, Clostridium cocleatum and Escherichia, which might be the reason of inflammation since it has been demonstrated that Bacteroides acidifaciens is
33 associated with gut inflammation – colitis in murine gut [63]. Similarly in Png et al. [64] was revealed that the amount of R. gnavus increased 4-fold in case of inflammatory bowel disease. Proteobacteria Escherichia coli and Aeromonas have been linked to lipopolysaccharide (LPS) driven inflammatory interleukin (IL) activation [65, 66]. In the current study after the cancer induction the abundance of proteobacteria increased in both cases (on control diet from 6 to 17 % and RS diet from 3 to 17 %), however, Escherichia was dominant genus in case of control diet while Aeromonas on RS diet. Inflammation by Aeromonas hydrophila has been described in mice [67, 68]. Ko et al. [66] observed that Aeromonas strain caused significantly higher serum levels of IL-1beta and IL-6. In our study overgrowth of Escherichia (in control diet) was accompanied by mucin degrading bacteria. Among active mucin degraders Akkermansia muciniphila, Clostridium cocleatum and Bacteroides acidifaciens were observed. This indicates that significant amount of B. acidifaciens in feces of mice (17 % in our study) might be related to inflammatory response of pancreatic cancer. Overall, ERS diet modulated gut microbiota composition especially affecting bacterial populations involved in inflammation. Upon ERS diet, indeed, about two times less inflammation–associated bacteria (such us Bacteriodes acidifaciens, Escherichia coli, R. gnavus and Clostridium cocleatum) were detected compared to control diet. Since pancreatic cancer is a kind of tumor whose development is strongly driven by inflammation [68], it can be speculated that ERS diet could have influenced pancreatic tumor growth by perturbing microbial communities sustaining inflammation. The normal healthy murine microbiota consist of 1:1 Bacteroidetes and Firmicutes of which around 10 % are lactobacilli. As shown in this study the abundance of lactobacilli decreased from 17 to 5-7 % after cancer induction, indicating the
34 inflammation driven changes. These changes led to modifications in metabolite profiles. For example, the ratio of acetate to lactate felled from 6.5-7 before to about 2 after cancer induction, whilst no lactate was detected on control diet after cancer induction. At the same time the ratio of acetate to propionate changed from 1.8-2.3 to 0.13-0.24, which could be explained by overgrowth of propionic acid producers B. acidifaciens and A. muciniphila. Decreased acetate to propionate ratio (1.1) has been observed also in rat experiment fed the inulin enriched diet while on ordinary starch diet it was 2.8 [71]. Of note, even though butyrate was below the level of detection, a remarkable increase (17% vs 3%) in Lachnospiraceae, potentially harboring butyrate producers, was observed in mice fed ERS diet compared to mice fed control diet after cancer induction. Butyrate has proven to inhibit proliferation and to promote differentiation and apoptosis in different cancer cell lines [72-75], among which pancreatic ones [76, 77]. Furthermore, butyrate inhibits pancreatic cancer invasion [78].
In microcalorimetry experiments the organic acids (lactic and acetic acids) and amount of lactobacilli can be used as discriminating parameters between substrates. During the growth of fecal microbiota on levan-containing medium, lactic and acetic acids are produced in equimolar amounts, while on RS mostly lactic acid is produced. Proportions of Lactobacilli and Escherichia in fecal microbiota were 0.45 and 0.33 when grown on RS, and 0.07 and 0.4 in case of levan were observed. Our experiments showed that colon microbiota can be specifically modulated by different substrates RS and levan, hence should have an effect also on tumor growth in vivo, which should be analysed in further experiments.
35 Besides gemcitabine, used alone or in combination, conventional drugs currently used to treat advanced PC and/or after surgical treatment include fluorouracil, irinotecan, cisplatin, and oxaliplatin. Notably, fasting may represent an alternative for patients who are unable to undergo these conventional treatments. Overall, in the current study also ERS diet was found to influence composition and metabolism of the gut microbiota. This effect was associated to a decrease of tumor progression in the PC xenograft mouse model. Although further experiments are needed to elucidate the mechanisms underlying this phenomenon, our results suggest that dietary interventions could be adopted to support the conventional therapies in the clinical management of pancreatic cancer.
References
1. Lv M, Zhu X, Wang H, Wang F, Guan W. Roles of caloric restriction, ketogenic diet and intermittent fasting during initiation, progression and metastasis of cancer in animal models: a systematic review and meta-analysis. PLoS One. 2014 Dec 11;9(12):e115147.
2. Eslami S, Barzgari Z, Saliani N, Saeedi N, Barzegari A (2012) Annual fasting; the early calories restriction for cancer prevention. Bioimpacts 2:213–215.
3. Longo VD, Fontana L. Calorie restriction and cancer prevention: metabolic and molecular mechanisms. Trends Pharmacol Sci (2010) 31:89–98.
4. Lee C and Longo VD. Fasting vs dietary restriction in cellular protection and cancer treatment: from model organisms to patients. Oncogene (2011) 30, 3305–3316; 5. Goldhamer A, Lisle D, Parpia B, Anderson SV, Campbell TC. (2001). Medically
supervised water-only fasting in the treatment of hypertension. J Manipulative Physiol Ther 24: 335–339.
6. Goodrick CL, Ingram DK, Reynolds MA, Freeman JR, Cider NL. (1983). Differential effects of intermittent feeding and voluntary exercise on body weight and lifespan in adult rats. J Gerontol 38: 36–45.
7. Lee C, Raffaghello L, Brandhorst S, Safdie FM, Bianchi G, Martin-Montalvo A, Pistoia V, Wei M, Hwang S, Merlino A, Emionite L, de Cabo R, Longo VD. Fasting
36
cycles retard growth of tumors and sensitize a range of cancer cell types to chemotherapy. Sci Transl Med. 2012 Mar 7;4(124):124ra27.
8. Lv M, Zhu X, Wang H, Wang F, Guan W. Roles of caloric restriction, ketogenic diet and intermittent fasting during initiation, progression and metastasis of cancer in animal models: a systematic review and meta-analysis. PLoS One. 2014 Dec 11;9(12):e115147.
9. Simone BA, Champ CE, Rosenberg AL, Berger AC, Monti DA, et al. Selectively starving cancer cells through dietary manipulation: methods and clinical implications. Future Oncol (2013) 9: 959–976.
10. Seyfried BT, Kiebish M, Marsh J, Mukherjee P. Targeting energy metabolism in brain cancer through calorie restriction and the ketogenic diet. J Cancer Res Ther (2009) 5 Suppl 1: S7–15.
11. Jemal A, Siegel R, Ward E, Hao Y, Xu J, Thun MJ: Cancer statistics, 2009. CA Cancer J Clin 2009;59:225-249.
12. Warshaw AL, Fernandez-del CC: Pancreatic carcinoma. N Engl J Med 1992;326:455-465.
13. Hariharan D, Saied A, Kocher HM: Analysis of mortality rates for pancreatic cancer across the world. HPB (Oxford) 2008;10:58-62.
14. Abbruzzese JL. New applications of gemcitabine and future directions in the management of pancreatic cancer. Cancer. 2002; 95(4 Suppl):941-945.
15. Tavano F, Fontana A, Pellegrini F, Burbaci FP, Rappa F, Cappello F, Copetti M, Maiello E, Lombardi L, Graziano P, Vinciguerra M, di Mola FF, di Sebastiano P, Andriulli A, Pazienza V. Modeling interactions between Human Equilibrative Nucleoside Transporter-1 and other factors involved in the response to gemcitabine treatment to predict clinical outcomes in pancreatic ductal adenocarcinoma patients. J Transl Med. 2014 Sep 10;12:248. doi: 10.1186/s12967-014-0248-4.
16. Jordheim LP, Seve P, Tredan O and Dumontet C. The ribonucleotide reductase large subunit (RRM1) as a predictive factor in patients with cancer. Lancet Oncol. 2011; 12(7):693-702.
17. Akita H, Zheng Z, Takeda Y, Kim C, Kittaka N, Kobayashi S, Marubashi S, Takemasa I, Nagano H, Dono K, Nakamori S, Monden M, Mori M, Doki Y and Bepler G. Significance of RRM1 and ERCC1 expression in resectable pancreatic adenocarcinoma. Oncogene. 2009; 28(32):2903-2909.
18. Xie H, Jiang W, Jiang J, Wang Y, Kim R, Liu X and Liu X. Predictive and prognostic roles of ribonucleotide reductase M1 in resectable pancreatic adenocarcinoma. Cancer. 2013; 119(1):173-181.
19. Jordheim L.P, Dumontet C. Review of recent studies on resistance to cytotoxic deoxynucleoside analogues, Biochim. Biophys. Acta. 1776 (2007) 138–159.
37
20. Ohmine K, Kawaguchi K, Ohtsuki S., Motoi F., Egawa S., Unno M. et al., Attenuation of phosphorylation by deoxycytidine kinase is key to acquired gemcitabine resistance in a pancreatic cancer cell line: targeted proteomic and metabolomic analyses in PK9 cells, Pharm. Res. 29 (2012) 2006–2016.
21. Steinberg W. The clinical utility of the CA19-9 tumor-associated antigen. Am J Gastroenterol. 1990; 85(4):350-355.
22. Champ CE, Baserga R, Mishra MV, Jin L, Sotgia F, Lisanti MP, Pestell RG, Dicker AP, Simone NL. Nutrient restriction and radiation therapy for cancer treatment: when less is more. Oncologist. 2013;18(1):97-103
23. D'Aronzo M, Vinciguerra M, Mazza T, Panebianco C, Saracino C, Pereira SP, Graziano P, Pazienza V. Fasting cycles potentiate the efficacy of gemcitabine treatment in in vitro and in vivo pancreatic cancer models. Oncotarget. 2015 Jul 30;6(21):18545-57.
24. Raffaghello L, Lee C, Safdie FM, Wei M, Madia F, Bianchi G and Longo VD. Starvation-dependent differential stress resistance protects normal but not cancer cells against high-dose chemotherapy. Proc Natl Acad Sci U S A. 2008; 105(24):8215-8220.
25. Harvey AE, Lashinger LM, Hays D, Harrison LM, Lewis K, Fischer SM, Hursting SD. Calorie restriction decreases murine and human pancreatic tumor cell growth, nuclear factor-κB activation, and inflammation-related gene expression in an insulin-like growth factor-1-dependent manner. PLoS One. 2014 May 7;9(5):e94151
26. Klement RJ and Kammerer U. Is there a role for carbohydrate restriction in the treatment and prevention of cancer? Nutr Metab (Lond). 2011; 8:75.
27. Allen BG, Bhatia SK, Anderson CM, Eichenberger-Gilmore JM, Sibenaller ZA, Mapuskar KA, Schoenfeld JD, Buatti JM, Spitz DR and Fath MA. Ketogenic diets as an adjuvant cancer therapy: History and potential mechanism. Redox Biol. 2014; 2C:963-970.
28. Ho VW, Leung K, Hsu A, Luk B, Lai J, Shen SY, Minchinton AI, Waterhouse D, Bally MB, Lin W, Nelson BH, Sly LM and Krystal G. A low carbohydrate, high protein diet slows tumor growth and prevents cancer initiation. Cancer Res. 2011; 71(13):4484-4493.
29. Birt DF, Boylston T, Hendrich S, Jane JL, Hollis J, Li L, McClelland J, Moore S, Phillips GJ, Rowling M, Schalinske K, Scott MP and Whitley EM. Resistant starch: promise for improving human health. Adv Nutr. 2013; 4(6):587-601.
30. Claesson MJ, Jeffery IB, Conde S, Power SE, O'Connor EM, Cusack S, Harris HM, Coakley M, Lakshminarayanan B, O'Sullivan O, Fitzgerald GF, Deane J, O'Connor M, Harnedy N, O'Connor K, O'Mahony D, et al. Gut microbiota composition correlates with diet and health in the elderly. Nature. 2012; 488(7410):178-184.
38
31. Flint HJ, Duncan SH, Scott KP and Louis P. Links between diet, gut microbiota composition and gut metabolism. Proc Nutr Soc. 2015; 74(1):13-22.
32. Graf D, Di Cagno R, Fak F, Flint HJ, Nyman M, Saarela M and Watzl B. Contribution of diet to the composition of the human gut microbiota. Microb Ecol Health Dis. 2015; 26:26164.
33. Carding S, Verbeke K, Vipond DT, Corfe BM and Owen LJ. Dysbiosis of the gut microbiota in disease. Microb Ecol Health Dis. 2015; 26:26191.
34. Erejuwa OO, Sulaiman SA and Ab Wahab MS. Modulation of gut microbiota in the management of metabolic disorders: the prospects and challenges. Int J Mol Sci. 2014; 15(3):4158-4188.
35. Schwabe RF and Jobin C. The microbiome and cancer. Nat Rev Cancer. 2013; 13(11):800-812.
36. Zitvogel L, Galluzzi L, Viaud S, Vetizou M, Daillere R, Merad M and Kroemer G. Cancer and the gut microbiota: an unexpected link. Sci Transl Med. 2015; 7(271):271ps271.
37. Farrell JJ, Zhang L, Zhou H, Chia D, Elashoff D, Akin D, Paster BJ, Joshipura K and Wong DT. Variations of oral microbiota are associated with pancreatic diseases including pancreatic cancer. Gut. 2012; 61(4):582-588.
38. Leal-Lopes C, Velloso FJ, Campopiano JC, Sogayar MC and Correa RG. Roles of Commensal Microbiota in Pancreas Homeostasis and Pancreatic Pathologies. J Diabetes Res. 2015; 2015:284680.
39. Zambirinis CP, Pushalkar S, Saxena D and Miller G. Pancreatic cancer, inflammation, and microbiome. Cancer J. 2014; 20(3):195-202.
40. Hucka M, Finney A, Sauro HM, Bolouri H, Doyle JC, Kitano H, Arkin AP, Bornstein BJ, Bray D, Cornish-Bowden A, Cuellar AA, Dronov S, Gilles ED, Ginkel M, Gor V, Goryanin, II, et al. The systems biology markup language (SBML): a medium for representation and exchange of biochemical network models. Bioinformatics. 2003; 19(4):524-531.
41. Sedwards S and Mazza T. Cyto-Sim: a formal language model and stochastic simulator of membrane-enclosed biochemical processes. Bioinformatics. 2007; 23(20):2800-2802.
42. Ballarini P, Guido R, Mazza T and Prandi D. Taming the complexity of biological pathways through parallel computing. Brief Bioinform. 2009; 10(3):278-288.
43. Klindworth A, Pruesse E, Schweer T, Peplies J, Quast C, Horn M and Glockner FO. Evaluation of general 16S ribosomal RNA gene PCR primers for classical and next-generation sequencing-based diversity studies. Nucleic Acids Res. 2013; 41(1) 44. Quint K, Tonigold M, Di Fazio P, Montalbano R, Lingelbach S, Ruckert F, Alinger
39
treatment express markers of stem cell differentiation and epithelial-mesenchymal transition. Int J Oncol. 2012; 41(6):2093-2102.
45. Cappella P, Tomasoni D, Faretta M, Lupi M, Montalenti F, Viale F, Banzato F, D'Incalci M and Ubezio P. Cell cycle effects of gemcitabine. Int J Cancer. 2001; 93(3):401-408.
46. Han L, Ma Q, Li J, Liu H, Li W, Ma G, Xu Q, Zhou S and Wu E. High glucose promotes pancreatic cancer cell proliferation via the induction of EGF expression and transactivation of EGFR. PLoS One. 2011; 6(11):e27074.
47. Pandolfi A and Di Pietro N. High glucose, nitric oxide, and adenosine: a vicious circle in chronic hyperglycaemia? Cardiovasc Res. 2010; 86(1):9-11.
48. Perez-Torras S, Garcia-Manteiga J, Mercade E, Casado FJ, Carbo N, Pastor-Anglada M and Mazo A. Adenoviral-mediated overexpression of human equilibrative nucleoside transporter 1 (hENT1) enhances gemcitabine response in human pancreatic cancer. Biochem Pharmacol. 2008; 76(3):322-329.
49. Puebla C, Farias M, Gonzalez M, Vecchiola A, Aguayo C, Krause B, Pastor-Anglada M, Casanello P and Sobrevia L. High D-glucose reduces SLC29A1 promoter activity and adenosine transport involving specific protein 1 in human umbilical vein endothelium. J Cell Physiol. 2008; 215(3):645-656.
50. Santini D, Vincenzi B, Fratto ME, Perrone G, Lai R, Catalano V, Cass C, Ruffini PA, Spoto C, Muretto P, Rizzo S, Muda AO, Mackey JR, Russo A, Tonini G and Graziano F. Prognostic role of human equilibrative transporter 1 (hENT1) in patients with resected gastric cancer. J Cell Physiol. 2010; 223(2):384-388.
51. Greenhalf W, Ghaneh P, Neoptolemos JP, Palmer DH, Cox TF, Lamb RF, Garner E, Campbell F, Mackey JR, Costello E, Moore MJ, Valle JW, McDonald AC, Carter R, Tebbutt NC, Goldstein D, et al. Pancreatic cancer hENT1 expression and survival from gemcitabine in patients from the ESPAC-3 trial. J Natl Cancer Inst. 2014; 106(1):djt347.
52. Apontes P, Leontieva OV, Demidenko ZN, Li F and Blagosklonny MV. Exploring long-term protection of normal human fibroblasts and epithelial cells from chemotherapy in cell culture. Oncotarget. 2011 2(3):222-233.
53. Longo VD and Fontana L. Intermittent supplementation with rapamycin as a dietary restriction mimetic. Aging (Albany NY). 2011; 3(11):1039-1040.
54. lement RJ and Kammerer U. Is there a role for carbohydrate restriction in the treatment and prevention of cancer? Nutr Metab (Lond). 2011; 8:75.
55. Hursting SD, Lavigne JA, Berrigan D, Perkins SN and Barrett JC. Calorie restriction, aging, and cancer prevention: mechanisms of action and applicability to humans. Annu Rev Med. 2003; 54:131-152.
40
56. Claesson MJ, Jeffery IB, Conde S, Power SE, O'Connor EM, Cusack S, Harris HM, Coakley M, Lakshminarayanan B, O'Sullivan O, Fitzgerald GF, Deane J, O'Connor M, Harnedy N, O'Connor K, O'Mahony D, et al. Gut microbiota composition correlates with diet and health in the elderly. Nature. 2012; 488(7410):178-184. 57. Flint HJ, Duncan SH, Scott KP and Louis P. Links between diet, gut microbiota
composition and gut metabolism. Proc Nutr Soc. 2015; 74(1):13-22.
58. Graf D, Di Cagno R, Fak F, Flint HJ, Nyman M, Saarela M and Watzl B. Contribution of diet to the composition of the human gut microbiota. Microb Ecol Health Dis. 2015; 26:26164.
59. Erejuwa OO, Sulaiman SA and Ab Wahab MS. Modulation of gut microbiota in the management of metabolic disorders: the prospects and challenges. Int J Mol Sci. 2014; 15(3):4158-4188.
60. Schwabe RF and Jobin C. The microbiome and cancer. Nat Rev Cancer. 2013; 13(11):800-812.
61. Zitvogel L, Galluzzi L, Viaud S, Vetizou M, Daillere R, Merad M and Kroemer G. Cancer and the gut microbiota: an unexpected link. Sci Transl Med. 2015; 7(271):271ps271.
62. Zambirinis CP, Pushalkar S, Saxena D and Miller G. Pancreatic cancer, inflammation, and microbiome. Cancer J. 2014; 20(3):195-202.
63. Schwab C, Berry D, Rauch I, Rennisch I, Ramesmayer J, Hainzl E, Heider S, Decker T, Kenner L, Muller M, Strobl B, Wagner M, Schleper C, Loy A and Urich T. Longitudinal study of murine microbiota activity and interactions with the host during acute inflammation and recovery. Isme J. 2014; 8(5):1101-1114.
64. Png CW, Linden SK, Gilshenan KS, Zoetendal EG, McSweeney CS, Sly LI, McGuckin MA and Florin TH. Mucolytic bacteria with increased prevalence in IBD mucosa augment in vitro utilization of mucin by other bacteria. Am J Gastroenterol. 2010; 105(11):2420-2428.
65. Fan H, Zingarelli B, Peck OM, Teti G, Tempel GE, Halushka PV, Spicher K, Boulay G, Birnbaumer L and Cook JA. Lipopolysaccharide- and gram-positive bacteria-induced cellular inflammatory responses: role of heterotrimeric Galpha(i) proteins. Am J Physiol Cell Physiol. 2005; 289(2):C293-301.
66. Ko WC, Chiang SR, Yan JJ and Chuang YC. Comparative pathogenicity of bacteraemic isolates of Aeromonas hydrophila and Klebsiella pneumoniae. Clin Microbiol Infect. 2005; 11(7):553-558.
67. Abuelsaad AS, Allam G and Al-Solumani AA. Hesperidin inhibits inflammatory response induced by Aeromonas hydrophila infection and alters CD4+/CD8+ T cell ratio. Mediators Inflamm. 2014; 2014:393217.