Full Terms & Conditions of access and use can be found at
https://www.tandfonline.com/action/journalInformation?journalCode=ujbm20
Journal of Small Business Management
ISSN: (Print) (Online) Journal homepage: https://www.tandfonline.com/loi/ujbm20
Gazelles, ponies, and the impact of business
angels’ characteristics on firm growth
Annalisa Croce , Elisa Ughetto , Stefano Bonini & Vincenzo Capizzi
To cite this article: Annalisa Croce , Elisa Ughetto , Stefano Bonini & Vincenzo Capizzi (2020): Gazelles, ponies, and the impact of business angels’ characteristics on firm growth, Journal of Small Business Management, DOI: 10.1080/00472778.2020.1844489
To link to this article: https://doi.org/10.1080/00472778.2020.1844489
Published online: 03 Dec 2020.
Submit your article to this journal
View related articles
Gazelles, ponies, and the impact of business angels’
characteristics on firm growth
Annalisa Croce a, Elisa Ughetto b, Stefano Bonini c, and Vincenzo Capizzi d
aPolitecnico di Milano, Department of Management, Economics and Industrial Engineering, Italy; bPolitecnico di Torino (DIGEP) and BRICK, Collegio Carlo Alberto, Italy; cStevens Institute of Technology,
School of Business, USA; dDepartment of Economics and Business Studies, Università del Piemonte
Orientale, Italy ABSTRACT
This study investigates whether the individual attributes and investment approaches of business angels (BAs) affect the growth of funded companies by distinguishing between two firm types: gazelles and ponies. We draw upon an original data set comprising 265 small Italian firms (49 that received BA financing and 216 in the propensity score matched control group). Building on insights drawn from the resource-based view and absorptive capacity theory, we find that BAs with entrepreneurial experience positively affect the sales growth of gazelles only. Moreover, the role of BAs’ investment experi-ence and coaching in the growth rates of both gazelles and ponies is insignificant. Interestingly, monitoring helps boost ponies’ performance but stifles growth among gazelles.
KEYWORDS
Gazelle; business angel; firm growth
Business angels (BAs) play a key role in the provision of external finance for new ventures (Coveney & Moore, 1998; OECD, 2011; Shane, 2012). Due to their small size and early stage of development, these firms typically lack internally generated cash flows, making the receipt of external funding very important for their future prospects. Capital endowment constitutes a valuable buffer against random shocks and allows ventures to accelerate their growth and increase their chances of survival (Cooper et al., 1994), which is especially crucial for new technology-based ventures (Carpenter & Petersen, 2002).
Along with equity injection, BAs provide nonmonetary contributions to invested ventures, including industry knowledge, managerial experience, mentoring, and access to personal networks (Avdeitchikova & Landström,
2016; Landström, 1993; Politis, 2008). Research on the peculiar characteristics of BAs; the rationales behind their investment decisions; and their distinctive attitudes in terms of objectives, time horizons, and screening practices has been at the heart of the BA literature (see Tenca et al., 2018 for a recent review). However, the literature has treated BAs as a homogeneous category and has done little to explore how these equity investors differ in terms of
CONTACT Vincenzo Capizzi [email protected] Via E. Perrone, 18, 28100 Novara (NO), IT https://doi.org/10.1080/00472778.2020.1844489
personal traits, risk attitudes, investment strategies, portfolio management, and postinvestment involvement (Croce et al., 2017, 2020; Drover et al., 2017; Freear et al., 1994; Sørheim & Landström, 2001; Wallmeroth et al., 2018; White & Dumay, 2017).
Despite the central role of BAs’ characteristics and abilities in nurturing new ventures, empirical research has so far fallen short of establishing a solid research base in this domain. The opacity of the market and the difficulty of accessing data on a large scale have limited the literature’s exploration of the interplay between BAs’ personal traits, behaviors, modus operandi, and the performance or premoney evaluation of invested ventures (Bonini et al., 2019; Bonnet et al., 2013; Collewaert & Manigart, 2016; Croce et al., 2018; Wiltbank,
2005). Studies have also failed to scrutinize the profile of the ventures BAs invest in and the extent to which investors can boost the performance of target firms in different ways according to their different ex ante growth patterns.
A large body of entrepreneurship literature has explored the evolution, competition dynamics, and economic impact of a set of ventures showing distinct growth patterns, known as “gazelles.” This concept was introduced by Birch and Medoff (1994) to identify fast-growing firms with the potential to exert a disproportionate impact on a country’s economic growth (Stangler,
2010). However, there is no formal agreement on which growth pace fast- growing firms should exhibit to be considered gazelles1 (Acs et al., 2008; Henrekson & Johansson, 2010; Nightingale & Coad, 2013). Unicorns (com-panies with an estimated value in excess of 1 USD billion) arguably constitute a visible subset of gazelles because they exhibit steep growth paths that provide them easier and faster access to capital markets. While playing a major role in stimulating job creation and economic growth, gazelles make up only a small fraction of the start-up population.2 Evidence has also recently emerged of a robust group of companies, referred to as “ponies,” with relatively slow growth rates but high resilience, as they appear to survive for longer periods (The Economist, 2019).3
Using data obtained from sequential surveys administered by the Italian Business Angels Network Association (IBAN), we examine whether BAs’ individual attributes and investment approaches affect the growth of funded start-ups with different growth patterns at the investment date. We contribute to the entrepreneurial finance literature in two main ways. First, we explore what drives the growth of BA-backed ventures by diving deeper into the investors’ human-capital characteristics (i.e., entrepreneurial and investment experience) and investment practices (i.e., monitoring and coaching). As 1The OECD recently proposed using the term to refer to firms less than five years old and with an average
employment growth rate exceeding 20 percent annually over a three-year period and with 10 or more employees at the beginning of the period (OECD, 2007).
2Pugsley et al. (2018) estimate that gazelles do not exceed 5 percent of new ventures, with unicorns being truly
occasional outliers.
mentioned, this aspect has received inadequate attention in the scientific literature. We draw from resource-based theory to empirically illustrate that firms’ exposure to external knowledge (derived in this study from informal investors) can be instrumental in facilitating their growth.
Second, we investigate to what extent BAs may enhance the growth of their target investments considering different categories of ventures. We build on the insights of the absorptive capacity literature (Cohen & Levinthal, 1990; Kostopoulos et al., 2011; Todorova & Durisin, 2007; Zahra & George, 2002) to explore whether distinctive types of ventures engage in knowledge acquisition, assimilation, and exploitation differently. Specifically, the value and growth opportunities created by knowledge inflows from informal investors are assumed to be exploited differently by two types of firms: gazelles and ponies.
Gazelles incorporate substantial risks that may need special handling by BAs, and may require distinctive investor attributes to manage their acceler-ated growth. Different funding approaches and individual traits could be necessary to invest in ponies, which arguably show less risky configurations but need the implementation of business practices that can be sustained over a prolonged period. We define gazelles as young ventures operating in a high- tech or knowledge-intensive sector and showing high sales growth in the years before the financing occurs. Small and young companies experiencing low sales growth over time are instead classified as ponies. The identification of gazelles and ponies relies on an ex ante classification of sample firms based on their performance at the time of financing, a condition that, in principle, is observable by the investors. Clearly, the difficulty in disentangling the effects of selection and treatment poses a problem of endogeneity, which we try to mitigate by using a propensity score matched (PSM) control sample of non- BA-backed ventures.
We use an original data set comprising 49 companies that received, with no ambiguity, BA financing in Italy and a PSM control sample of 216 non-BA- backed firms to find the presence of significant correlations between BAs’ characteristics and investment approaches and the growth rates of invested companies, with diversified patterns for gazelles and ponies. Our overall findings support the intuition that BAs shape start-ups’ future growth paths differently across different categories of firms based on their distinctive perso-nal traits and investment strategies. In particular, we find that BAs with entrepreneurial experience affect the sales growth of gazelles positively but that this does not happen with ponies. We also find that the roles played by BAs’ investment experience and coaching in the growth rates of both gazelles and ponies are insignificant. Finally, BA monitoring helps boost the perfor-mance of ponies but stifles the growth of gazelles.
The remainder of this paper is structured as follows. Section 2 reviews the literature on the linkage between angel investing and firm performances. Section 3 develops our research hypotheses. Section 4 describes the study’s
data-collection process. Section 5 explains our methodology. Section 6 pre-sents the results. Finally, concluding remarks close the paper in Section 7. Performance of angel investments
It is widely acknowledged that BAs play a crucial role in the promotion of economic growth and entrepreneurship, helping to fill the “funding gap” between the demand and supply of early-stage equity capital (Harrison & Mason, 2000; Wiltbank et al., 2009). Despite the important role BAs play in the economy, little is known about the performance of their investments. One key reason for this dearth of empirical evidence is the opaqueness of the BA market (Harrison & Mason, 2008). Other reasons include the limited avail-ability of accounting information associated with early-stage businesses and the narrow representativeness of the samples based on surveys (Bessière et al.,
2020; Bonini et al., 2019; Lerner et al., 2018). As a result, only a few recent studies have specifically investigated the performance of angel-backed com-panies, using different performance metrics (Bonini et al., 2019; Bonnet et al.,
2013; Croce et al., 2018; Kerr et al., 2014; Levratto et al., 2018). Bonnet et al.
(2013) examine the growth patterns of 222 BA-backed investments in France
and find strong growth rates when BAs and professional venture capitalists (VCs) coinvest simultaneously. Bonini et al. (2019) develop a performance index that dynamically captures changes in the quality profile of angel-backed companies based on various combinations of revenues, asset values, and income. The authors find that the performance and survival of angel-backed companies are both positively affected by deal syndication and angels’ invol-vement in the funded ventures. By contrast, non-contractual-based monitor-ing and a fragmented equity infusion are found to have a negative impact on the performance of funded ventures. Kerr et al. (2014) analyze data from two well known U.S. angel investment groups covering 2001 to 2006 and find that start-ups that receive angel financing improve their likelihood of survival and successful exit (IPO or acquisition), as well as their employment levels, while mixed results are found regarding superior subsequent follow-on financing. Levratto et al. (2018) explore a data set comprising 432 angel-backed French companies and compare it to two selected control groups. The performance (expressed as growth in sales, employment, and tangible capital assets) of BA- backed firms is found to be superior when the comparison is done with a random sample, while it is identical or worse than a sample composed of similar companies. Croce et al. (2018) examine the extent to which BAs’ capabilities and investment behavior affect several measures of interim and ultimate start-up success. Their main results indicate that BA experience matters: While experience in early-stage investments positively affects follow- on rounds of financing and subsequent VC financing, experience in later-stage deals is associated with the probability of a successful exit. Moreover, the
coinvestment between a VC and a BA or the sequential investment of a VC after a BA leads to incremental funding amounts or an improved likelihood of ultimate success, respectively.
Other works have looked at BAs’ contribution to investee ventures com-pared with that of VCs. Among these studies, Bruton et al. (2010) and Chahine et al. (2007) show that BAs have a significant value-enhancing effect on IPO firm performance relative to VC investors. Contrasting evidence is offered by
Johnson and Sohl (2012), who find that BA-backed IPO firms do not perform
better than non-BA-backed IPO firms but that this result does not hold if VC investments are considered.
Hypotheses
Motivated by the resource-based perspective, a conspicuous body of empirical entrepreneurship studies has found a clear linkage between entrepreneurs’ human-capital characteristics (e.g., high education attainment, experience, and social connections) and venture growth and survival (Bosma et al., 2004; Colombo & Grilli, 2005, 2010; Cooper et al., 1994; Gimeno et al., 1997). Adherents of the resource-based view agree that knowledge generation and transfer is the most strategically important resource and is essential for sustaining a firm’s competitive advantage (Conner & Prahalad, 1996; Spender, 1996). The possession of valuable and distinctive capabilities at the firm level ensures superior growth because of the enhanced opportunities it can provide firms to implement value-enhancing strategies and address com-petitive pressures (Barney, 1991). However, the potential benefits of external knowledge inflows in terms of growth cannot be taken for granted and might diverge among different organizational forms. Of particular importance is a firm’s ability to identify, assimilate, and exploit the external knowledge, known as “absorptive capacity” (Cohen & Levinthal, 1990). The presence of absorptive capacity is perceived as the essential condition for channeling external knowledge into anything of value to the firm (Kostopoulos et al.,
2011; Todorova & Durisin, 2007; Zahra & George, 2002). It has not been made clear in the entrepreneurial finance literature which categories of firms receiv-ing BA financreceiv-ing are more responsive to the transfer and processreceiv-ing of knowl-edge from informal investors.
In this section, we draw on the resource-based view to gain insight into the drivers of growth for BA-backed companies, allowing for differences between gazelles and ponies regarding the use of external knowledge inflows. We explore these aspects by considering BAs’ distinctive human-capital endow-ment and investendow-ment practices.
Human-capital endowment Investment experience
One trait that characterizes BAs’ human-capital endowment is the know-how BAs accumulate through their investments, which often reflects a noncodified knowledge of the industry, technologies, and people (Cooper et al., 1994). The BAs with investment experience are more skilled at discerning the potential of business opportunities and managing the investment process until exit (Croce et al., 2018). Accumulated investment knowledge helps to compensate for a lack of competences and other operational weaknesses of entrepreneurial ventures. Thus, BAs with investment experience are better able to manage the overall investment process, leading to a greater capability to orientate the growth path of funded ventures (Croce et al., 2018; Van Osnabrugge, 2000).
Growth will be boosted to the extent that BAs have investment experience. However, gazelles and ponies might differ in their receptiveness to knowledge transfer from informal investors. We argue that a greater effect is foreseen for gazelles, which are in a better position to absorb new knowledge, face compe-tition, and address technological challenges. Entrepreneurs running gazelles are better qualified to assimilate the wisdom and know-how that BAs provide. The fast growth of their businesses makes them more prone to overcome the natural tendency to rely on existing firm knowledge (Lee & Meyer-Doyle,
2017). Instead, we expect the absorption of external knowledge to be lower for ponies, which are less dynamic in identifying and capturing opportunities that are inherently uncertain. Consistent with these arguments, we propose the following hypothesis (H):
H1. Greater BAs’ investment experience favors the growth of gazelles more than that of ponies.
Entrepreneurial experience
Entrepreneurial experience forges BAs’ attitudes and mindsets, which affects how the cognition, values, and behaviors BAs have developed during their entrepreneurial past transfer to the invested start-ups. BAs with firsthand entrepreneurial experience use experience-based schemas, often based on intuitions (i.e., “gut feel”; Huang, 2018; Huang & Pearce, 2015), to interpret and make sense of reality (Croce et al., 2020). A greater amount of over-confidence and overoptimism is also found to be associated with BAs with an entrepreneurial background (Busenitz & Barney, 1997; Zhang & Cueto,
2017). The intuitive decision-making process coupled with a fair degree of overconfidence can, in turn, affect their strategic decisions and investment portfolio management (Cotè, 2011; Kish-Gephart & Campbell, 2015). Entrepreneurial experience is composed mostly of tacit knowledge, rather
than explicit knowledge, acquired by and stored within entrepreneurs with different appropriability and transferability dynamics.
It is reasonable to assume that BAs with entrepreneurial experience con-tribute more effectively to the growth path of investee companies. The fact that investors and entrepreneurs share a common background and certain homo-geneous social connections narrows their traditionally wide information gap. Entrepreneurial experience facilitates the transfer of knowledge within entre-preneurs’ minds. Again, not all entrepreneurs are predisposed to process and store such information or to share and cause it to be referenced and used by employees.
We argue that BAs with entrepreneurial experience positively affect the growth of invested ventures, and that this effect is greater for gazelles. Gazelles are guided by a strong attitude toward risk taking and opportunity capture, which dictates their approach to managing the complexity of entrepreneurial decisions. It follows that gazelles may be better positioned to take advantage of external knowledge than ponies, whose entrepreneurs may be less permeable to knowledge assimilation. We thus put forward our second hypothesis:
H2. Greater BAs’ entrepreneurial experience favors the growth of gazelles more than that of ponies.
Investment practices Monitoring
Like VCs, BAs are concerned with agency risks that may arise when investing in small, informationally opaque and risky ventures. Therefore, BAs set up the appropriate monitoring mechanisms that, though less formal than those adopted by VCs, respond to the same need: to limit the incentives for entre-preneurs or management teams to pursue opportunistic behavior (Bruton et al., 2010; Van Osnabrugge, 2000). Indeed, it has been suggested that BAs are even more concerned with agency risks than VCs, which attach more importance to market risk (Fiet, 1995). To manage and alleviate agency problems, BAs rely primarily on active monitoring through relational govern-ance (Ehrlich et al., 1994) and staging (Croce et al., 2018). Relational govern-ance involves the employment of postinvestment mechanisms of control, which have been called “soft monitoring” (Bonini et al., 2019) to distinguish them from the formal and highly expensive contracts and contingent financing mechanisms adopted by formal investors (Kaplan & Stromberg, 2003). Typically, BAs monitor their funded ventures through the development of close relationships with the entrepreneur, through attendance at board meet-ings, and through the provision of value-adding services. Relational govern-ance mechanisms imply a more patient risk-management attitude (Croce
et al., 2020), lengthening the timing of investment engagement and divestment strategies.
Monitoring mechanisms have been generally considered powerful tools which with to learn about the quality and potential of a venture over time, thus reducing the potential opportunistic behaviors that might lead to a suboptimal performance. However, a close monitoring might damage the relationships between the two parties, and this is especially true for angel investing, wherein the “trust nexus” between investors and entrepreneurs is at
the heart of investment dynamics. Chua and Wu. (2012) and Bammens and
Collewaert (2014) show that a tightening of the monitoring exerted by BAs on invested ventures negatively impacts their mutual relationships, in turn wor-sening their performance. An additional disadvantage associated with mon-itoring mechanisms is the risk that the entrepreneur will “window dress” to secure the next round of financing from the investor, a practice that is relevant to staging (Croce et al., 2018). These potential detrimental effects, which may affect the relationship between investors and new ventures, are deemed to negatively impact firm performance. Therefore, monitoring’s effect on funded firms is not yet clear.
We argue that the impact of monitoring might differ between gazelles and ponies. High-tech and knowledge-based rapid-growth entrepreneurial firms are typically more reluctant to disclose information to investors, since this might leak out to competitors (Bhattacharya & Ritter, 1983). Monitoring is likely to be less effective in this context, in which informational frictions between investors and entrepreneurs may be particularly severe. Gazelles may choose to opt for risky investment projects and follow an independent and unconstrained path to grasp innovative opportunities or to opt for projects whose future revenues are difficult to predict and that may offset investors’ expectations. Moreover, gazelles’ greater absorptive capacity acts as a conduit for knowledge transfer within the firm; this fosters growth, so that the monitoring instrument loses its potential and might even be detrimental. It follows that tight monitoring might restrain entrepreneurial risk taking in gazelles, eventually leading to stifling rather than enhancing firm growth. Contrariwise, in less fast-growing innovative and knowledge-based environ-ments, monitoring may act as an effective tool for facilitating firm growth. Given ponies’ weaker ability to identify, assimilate, and apply new external knowledge, tight monitoring by informal investors is deemed to have a positive effect on firms’ growth patterns. Thus, we propose the following:
H3. Greater monitoring by BAs favors the growth of ponies more than that of gazelles.
Coaching
The resource-based approach has been applied to entrepreneurial finance to explain the value-enhancing contribution of formal and informal investors to firms, which gives them access to a larger set of opportunities (e.g., Bammens & Collewaert, 2014; Colombo & Grilli, 2010). This stream of literature posits that ventures’ performance can be partially explained by their “hands on” approach to management. However, while researchers have devoted a great deal of attention to the link between mentoring/coaching and investees’ growth and survival in the VC domain, few studies have dealt with these issues in the angel market (Bonini et al., 2019; Croce et al., 2018; Wirtz et al., 2019). BAs provide a number of coaching services to invested ventures, ranging from advice to networking and assistance in everyday operations. BAs perform an important coaching function in fields in which funded firms typically lack internal cap-abilities, thus contributing to their managerial “professionalization” (Harrison & Mason, 2000; Lindsay, 2004). Their coaching leads to the reconfiguration of target firms’ distinctive capabilities and facilitates their access to leading com-petences that are typically out of their reach (Fili & Grünberg, 2014; Politis,
2008). In principle, this should boost the growth of invested firms. However, we argue that the effects may differ between gazelles and ponies. While ponies are expected to benefit from BAs’ active involvement, this could harm gazelles’ firm growth. This expectation follows several lines of reasoning.
First, BAs’ coaching function involves the application and integration of explicit knowledge put at the service of the firm and the sharing of strategic firm-level information. While this does not appear to be a hurdle for ponies, we expect that the founders of gazelles may be reluctant to disclose sensitive information to BAs because they operate in markets characterized by rapid technological change and harsh competitive dynamics.
Second, gazelles have already shown an autonomous growth capability before the investment date and do not require hands-on intervention in their daily operations. Their greater capacity to absorb BAs’ tacit knowledge means that gazelles are less in need of the explicit knowledge that informal investors can convey through their consultancy services. They already possess the ability to assimilate and transform external tacit knowledge flows into strategic choices that will benefit the firm. Due to their limited absorptive capacity, ponies are more in need of informal investors’ consultancy.
Third, the advantages of external investors’ active involvement are offset by the time and resources needed to manage close relationships with them. Coordination costs are particularly severe in contexts characterized by rapid technological change, wherein firms need to take decisions quickly to seize fast- growing and innovative opportunities. We expect that these problems might be more severe for gazelles than for ponies. We thus propose the following:
H4. Greater coaching by BAs favors the growth of ponies more than that of gazelles.
Data
Our data are obtained from sequential surveys administered by the Italian Business Angels Network Association (IBAN) to its associates and other unaffiliated BAs beginning in 2007. The IBAN is Italy’s national trade associa-tion for angels and angel groups/networks. A full descripassocia-tion of the survey procedure is reported in Bonini et al. (2019).4
From a starting sample of 690 deals, we excluded a number of observations because the name of the target company was not specified or was specified incorrectly, preventing an unequivocal identification. This reduced the sample to 614 deals in 419 start-ups that received BA financing beginning in 2008. We then performed a manual search on Orbis to collect data from financial statements (available from 2009 to 2016). We found 334 firms (out of 419) and obtained complete accounting information for 298 (71.12% of the initial identified companies). Since our aim was to explore the role of BAs in influencing companies’ performance, we required accounting information in both the pre- and post-BA investment period. Therefore, we were left with 123 companies for which we had at least one observation before and after the entry of the BA in the equity capital.
To isolate the net differential contribution (if any) of BAs across the two samples of companies (i.e., gazelles and ponies), we needed to compare the performance of BA-backed companies with that of a matched control group. Accordingly, we constructed a control group comprising entrepreneurial ventures that did not receive BA financing. The following methodology was employed to identify the control group. First, we consulted Orbis and selected 122,096 non-BA-backed companies operating in Italy. Second, we deleted from this randomly selected group those firms for which at least four con-secutive years of accounting data were not available, which reduced the control group to 15,097 non-BA-backed firms. Third, we extracted a matched sample to control for the selection on observables (i.e., the differences in sample composition before the entry of the BA investors).
We used a propensity score matching (PSM) method to find, for each company that received BA investments in year t, a group of non-BA-backed companies (i.e., 10 control group companies per each sample company, with 4Each survey is completed in a four-step process. At the beginning of January, the IBAN forwards the survey’s website
link to its associates and other known BAs. By the first week of March, the data are collected (Step 1). Nonresponsive BAs are contacted by email and phone to solicit survey completion (Step 2) while an IBAN team reviews the data to identify incomplete, wrong, or unverifiable answers (Step 3), which are further checked through direct follow-up calls (Step 4). This process is a fairly common survey technique called “sequential mixed mode” (Snijkers et al., 2013), which significantly improves response rates (Dillman et al., 2009; De Leeuw, 2005).
replacement) that had the most similar probability of receiving capital resources from BAs. Matching was performed using the nearest-neighbor PSM.5 Propensity scores were obtained by estimating, for companies receiving BA financing in year t (from 2009 to 2016), a probit model in which the dependent variable is the probability of receiving BA equity capital and the independent variables include age in logarithms, size (measured as the log of sales), growth (measured as the growth of sales, in logs, between year t and
t + 1), country, year, and industry dummies. A suitable matched group of 254
non-BA-backed pairs was found for 57 BA-backed entrepreneurial ventures. Based on data availability, we ran our models on 265 Italian companies (216 control group companies and 49 BA-backed companies). The final sample composition is reported in Table 1 by foundation year and industry.
Methodology and variables
This study aims to explore the performance of BA-backed companies as a function of BA characteristics and distinctive invested-company types. To produce accurate estimates on this treatment effect, we combine the matching approach, described in the previous section, with a quasi-differences-in- differences (DID) method aimed at demeaning results to isolate the net effect of BA traits (Blundell & Costa Dias, 2000). While the matching approach allows the selection of a control group of companies with observable char-acteristics similar to those of the treated group, the DID approach is applicable when information on the outcome before the treatment is available. The idea of the DID is to compute the outcome difference between the treated and control groups after the treatment and to subtract the outcome difference Table 1. Sample descriptive statistics.
Foundation Year BA-backed Control group
Before 2000 12 24.49% 58 26.85%
2001–2005 11 22.45% 75 34.72%
After 2006 26 53.06% 83 38.43%
Total 49 100.00% 216 100.00%
Industry BA-backed Control group
C – Manufacturing 9 18.37% 69 31.94%
F – Construction 1 2.04% 1 0.46%
G – Wholesale and retail trade; repair of motor vehicles and motorcycles 7 14.29% 14 6.48% I – Accommodation and food service activities 1 2.04% 0 0.00% J – Information and communication 7 14.29% 44 20.37% K – Financial and insurance activities 2 4.08% 8 3.70%
L – Real estate activities 0 0.00% 1 0.46%
M – Professional, scientific, and technical activities 21 42.86% 76 35.19% Q – Human health and social work activities 1 2.04% 0 0.00%
S – Other service activities 0 0.00% 3 1.39%
Total 49 100.00% 216 100.00%
5For a similar procedure in the VC literature, see Brau et al. (2004), Chemmanur et al. (2011), Croce and Martì (2016),
already in place before the treatment had any effect (conditional on given independent variable values).
We estimate the following model (Model 1):
Outcomediff ¼βBAcharacteristicsþcontrols
We include as controls the company’s age (in logs), the amount invested by the BA in the company (in logs), and a dummy (d_coinvestment) indicating whether the company is coinvested by more than one BA. Finally, year and industry dummies are considered as additional controls.
We also estimate a second model (Model 2) to which we add the dummy
BA-backed, taking a value of 1 for companies receiving BA financing and 0 for
control group companies, to verify the nonsignificance of this coefficient, indicating the validity of our matching procedure.
Models 1 and 2 are estimated on the full sample of companies and, sepa-rately, on the subsamples of gazelles and ponies to test our research hypotheses about the differential effects of BA characteristics on these two distinctive types of firms. We define a gazelle as a company operating in a high-tech or knowledge-intensive sector, young at the time of financing or in the year of the matching for control group companies (i.e., of an age lower than the median value of invested companies), and showing high sales growth in the year before the financing occurs or in the year before the matching year for control group companies (i.e., with sales growth, in logs, higher or equal to the median value of sales growth). We define a pony as a small company at the time of financing (with sales in logs lower than the median value of sales) showing a low sales growth in the year before the investment or in the year before the matching for control group companies (with sales growth in logs lower than the median value of sales growth).6
Finally, we estimate the following model with interactions (Model 3):
Outcomediff ¼ βBAcharacteristicsþγBAcharacteristics�dgazelleþδBAcharacteristics
�dponyþcontrols
In this model, dgazelle is a dummy taking a value of 1 for gazelles and dpony is
a dummy taking a value of 1 for ponies. The effect of BA characteristics on the two different subsamples, similarly to the effect measured in Model 1, can be estimated considering the linear combination of coefficients γ þ β and δ þ β for gazelles and ponies, respectively. In addition, the comparison between the coefficients γ and δ, representing the differential effects of BA characteristics on gazelles and ponies, respectively, allows us to explicitly test whether there is a differential effect of BA characteristics in the two subsamples. The test on the linear combination γ δ > 0 allows us to evaluate whether the impact of
6We use the median value as a threshold for age and size in defining young and small companies. This approach is
a specific BA characteristic is greater for gazelles than for ponies. As a robustness check, we further add, as a control, the dummy BA-backed to control for the validity of our matching procedure (Model 4).
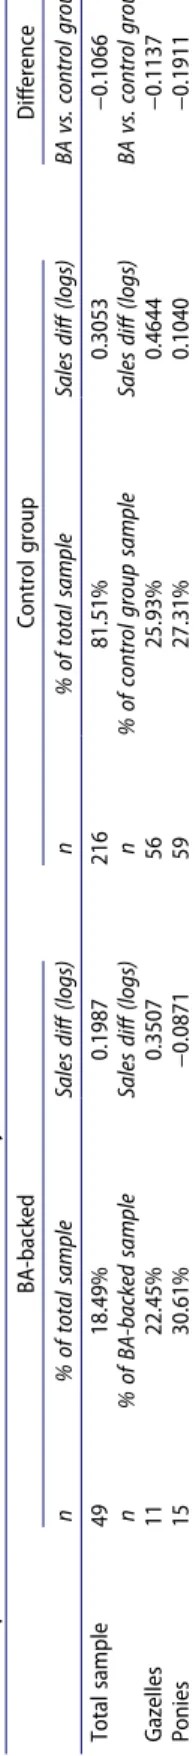
For the outcome variable, we use the difference between the average sales (in logs) two years after the year of BA financing (matched year for control group companies) and the average sales (in logs) in the two years before the treatment. Table 2 reports univariate analyses concerning the dependent variable used in our analysis (sales diff). We present figures for the overall sample, for the sample of 49 BA-backed companies (18.49% of the total sample), and for the control group of 216 companies (81.51% of the total sample).
As shown in Table 2, no statistical difference appears when comparing the BA-backed and control group companies. This suggests, on average, a nonsignificant role of BA financing in the group of treated companies. Descriptive statistics show that the BA-backed sample and control group present similar percentages of gazelles and ponies: Gazelles represent 22.45 percent of the BA-backed sample and 25.93 percent of the control group sample; whereas, ponies represent 30.61 percent of the BA-backed population and 27.31 percent of the control group population. When compar-ing our performance indicator (sales diff) for gazelles and ponies, no signifi-cant differences emerge between BA-backed and control group companies, similar to the finding for the overall sample.
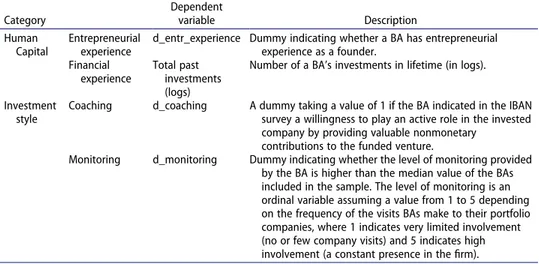
For the independent variables, consistent with our research hypotheses, we focus on several BA characteristics, referring to the human-capital and investment-style domains. Table 3 describes these variables in detail. To describe BAs’ human-capital endowment, we include a variable proxying a BA’s financial experience, measured as the number of investments in lifetime in logs (Total past investments) and a dummy indicating whether a BA has entrepreneurial experience as a founder (d_entr_experience). Another group of variables is included to describe BAs’ investment styles. First, we use a dummy (d_coaching) indicating the willingness of the BA to play an active role after the investment by providing valuable nonmonetary contributions to the funded venture. We also consider a dummy
(d_mon-itoring) indicating whether the level of monitoring provided by the BA is
higher than the median value of all the investors in the sample. The mon-itoring level is estimated, following Bonini et al. (2018), as an ordinal variable assuming a value from 1 to 5, depending on the frequency of the BAs’ visits to their portfolio companies.
Table 4 provides initial evidence about these variables for the full sample and for the subsamples of ponies and gazelles. For the full sample, the results show that 36.73 percent of the companies are invested by a BA with entrepre-neurial experience and an average of 1.7276 investments (in logs) are per-formed in a BA’s lifetime. Moreover, 73.46 percent of the funded ventures are
Table 2. Dependent variable (sales diff ): univariate analysis. BA-backed Control group Difference n % of total sample Sales diff (logs) n % of total sample Sales diff (logs) BA vs. control group Total sample 49 18.49% 0.1987 216 81.51% 0.3053 −0.1066 n % of BA-backed sample Sales diff (logs) n % of control group sample Sales diff (logs) BA vs. control group Gazelles 11 22.45% 0.3507 56 25.93% 0.4644 −0.1137 Ponies 15 30.61% −0.0871 59 27.31% 0.1040 −0.1911
backed by active investors, and 22.44 percent receive financing from BAs who monitor their investments tightly. No statistical differences in BA character-istics are found between the two subsamples of gazelles and ponies. The tests reported in Table 4 suggest that BAs investing in gazelles have more entre-preneurial and financial experience and a lower involvement in terms of coaching and monitoring than BAs investing in ponies, but these differences are not statistically significant.
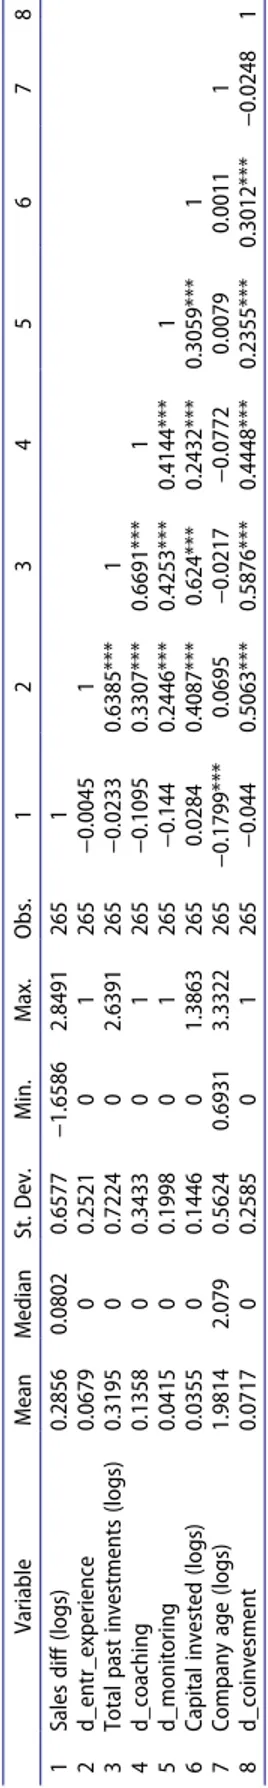
Complete descriptive statistics and a correlation matrix of all the variables used in the empirical analysis are reported in Table 5.
We next explore whether BA characteristics play a role in fostering the performance of BA-backed firms that differ between gazelles and ponies.
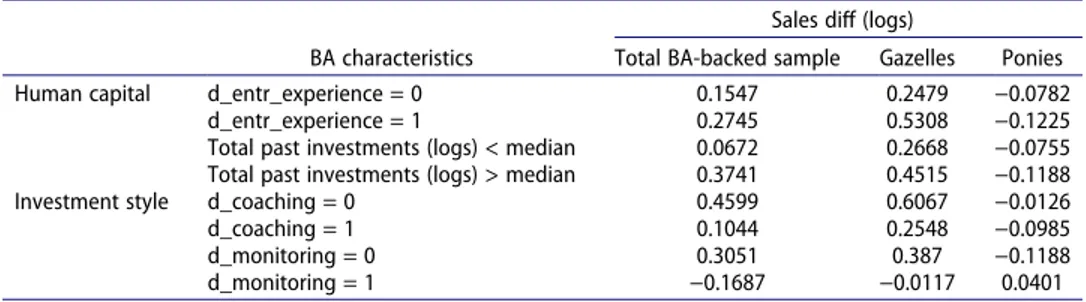
Table 6 reports the mean values of our dependent variable (sales diff) by considering different BAs’ human-capital and investment-style characteris-tics. We divide the results according to the presence of (a) entrepreneurial experience, (b) a high level of financial experience (based on the median value of the total past investments), (c) BAs’ active involvement, and (d) a strong monitoring attitude. The same statistics are reported, in the first column, for the full sample of BA-backed companies and, in the second and third columns, for gazelles and ponies.
Some interesting observations can be drawn from these descriptive statis-tics. Entrepreneurial experience seems to have a positive effect on the Table 3. Independent variables description.
Category Dependent variable Description Human Capital Entrepreneurial experience
d_entr_experience Dummy indicating whether a BA has entrepreneurial experience as a founder. Financial experience Total past investments (logs)
Number of a BA’s investments in lifetime (in logs).
Investment style
Coaching d_coaching A dummy taking a value of 1 if the BA indicated in the IBAN survey a willingness to play an active role in the invested company by providing valuable nonmonetary
contributions to the funded venture.
Monitoring d_monitoring Dummy indicating whether the level of monitoring provided by the BA is higher than the median value of the BAs included in the sample. The level of monitoring is an ordinal variable assuming a value from 1 to 5 depending on the frequency of the visits BAs make to their portfolio companies, where 1 indicates very limited involvement (no or few company visits) and 5 indicates high involvement (a constant presence in the firm).
Table 4. Independent variables: univariate analysis.
Independent variable Total sample of BA-backed companies Gazelles Ponies
Difference (Gazelles vs. Ponies) d_entr_experience 0.3673 0.3636 0.2000 0.1636 Total past investments (logs) 1.7276 1.6957 1.5243 0.1714
d_coaching 0.7346 0.7273 0.8667 −0.1394
Table 5. Descriptive statistics and correlation matrix. Variable Mean Median St. Dev. Min. Max. Obs. 1 2 3 4 5 6 7 8 1 Sales diff (logs) 0.2856 0.0802 0.6577 −1.6586 2.8491 265 1 2 d_entr_experience 0.0679 0 0.2521 0 1 265 −0.0045 1 3 Total past investments (logs) 0.3195 0 0.7224 0 2.6391 265 −0.0233 0.6385*** 1 4 d_coaching 0.1358 0 0.3433 0 1 265 −0.1095 0.3307*** 0.6691*** 1 5 d_monitoring 0.0415 0 0.1998 0 1 265 −0.144 0.2446*** 0.4253*** 0.4144*** 1 6 Capital invested (logs) 0.0355 0 0.1446 0 1.3863 265 0.0284 0.4087*** 0.624*** 0.2432*** 0.3059*** 1 7 Company age (logs) 1.9814 2.079 0.5624 0.6931 3.3322 265 −0.1799*** 0.0695 −0.0217 −0.0772 0.0079 0.0011 1 8 d_coinvesment 0.0717 0 0.2585 0 1 265 −0.044 0.5063*** 0.5876*** 0.4448*** 0.2355*** 0.3012*** −0.0248 1 ***, ** and * indicate, respectively, significance levels of <1%, <5% and <10%.
performance of invested companies: The increase in the sales difference is 0.2745 for companies invested in by BAs with entrepreneurial experience, while the same increase for firms invested in by BAs without entrepreneurial experience is 0.1547. This result is valid for gazelles too. For ponies, the numbers show the opposite result: Ponies invested in by BAs with entrepre-neurial experience show a lower sales growth than those invested in by BAs without entrepreneurial experience. A similar argument can be made for financial experience, which has a positive effect for the overall sample and particularly for gazelles, while the opposite holds for ponies. This initial evidence seems to confirm Hypotheses 1 and 2. Regarding-investment style characteristics, the results show a generally negative effect of active involve-ment for the overall sample and for both gazelles and ponies. Regarding monitoring, the results highlight a difference between the two firm subsam-ples: For gazelles, as for the overall sample, strong monitoring by BAs seems to reduce the performance of invested companies, while the opposite holds for ponies, for which strong monitoring has a positive effect.
Empirical results
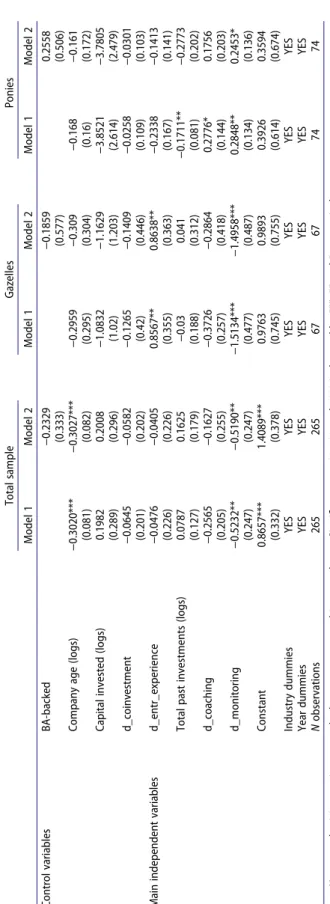
We now directly test our main hypotheses by running a set of multivariate regressions. Table 7 presents the results of the estimates of Models 1 and 2, as illustrated in Section 5, on the full firm sample.
The results align with the previous univariate analyses, indicating a limited variation in sales across the sample. Consequently, the panel of independent variables captures this variation in only a limited way. Overall, the results show that older firms exhibit a fairly significantly lower growth rate, after demean-ing for the control-group performance. The degree of investor monitordemean-ing is inversely related to performance, indicating that an excessive influence on the management of the venture appears detrimental when considering the overall sample of BA-backed companies. Finally, we observe in Model 2 the non-significance of the coefficient of BA-backed companies, reinforcing the validity of our matching procedure.
Table 6. Performance and BA characteristics: univariate analysis.
Sales diff (logs)
BA characteristics Total BA-backed sample Gazelles Ponies Human capital d_entr_experience = 0 0.1547 0.2479 −0.0782
d_entr_experience = 1 0.2745 0.5308 −0.1225 Total past investments (logs) < median 0.0672 0.2668 −0.0755 Total past investments (logs) > median 0.3741 0.4515 −0.1188 Investment style d_coaching = 0 0.4599 0.6067 −0.0126
d_coaching = 1 0.1044 0.2548 −0.0985
d_monitoring = 0 0.3051 0.387 −0.1188
Table 7. Regression results. Dependent variable: sales diff (log). Total sample Gazelles Ponies Model 1 Model 2 Model 1 Model 2 Model 1 Model 2 Control variables BA-backed −0.2329 −0.1859 0.2558 (0.333) (0.577) (0.506) Company age (logs) −0.3020*** −0.3027*** −0.2959 −0.309 −0.168 −0.161 (0.081) (0.082) (0.295) (0.304) (0.16) (0.172) Capital invested (logs) 0.1982 0.2008 −1.0832 −1.1629 −3.8521 −3.7805 (0.289) (0.296) (1.02) (1.203) (2.614) (2.479) d_coinvestment −0.0645 −0.0582 −0.1265 −0.1409 −0.0258 −0.0301 (0.201) (0.202) (0.42) (0.446) (0.109) (0.103) Main independent variables d_entr_experience −0.0476 −0.0405 0.8567** 0.8638** −0.2338 −0.1413 (0.226) (0.226) (0.355) (0.363) (0.167) (0.141) Total past investments (logs) 0.0787 0.1625 −0.03 0.041 −0.1711** −0.2773 (0.127) (0.179) (0.188) (0.312) (0.081) (0.202) d_coaching −0.2565 −0.1627 −0.3726 −0.2864 0.2776* 0.1756 (0.205) (0.255) (0.257) (0.418) (0.144) (0.203) d_monitoring −0.5232** −0.5190** −1.5134*** −1.4958*** 0.2848** 0.2453* (0.247) (0.247) (0.477) (0.487) (0.134) (0.136) Constant 0.8657*** 1.4089*** 0.9763 0.9893 0.3926 0.3594 (0.332) (0.378) (0.745) (0.755) (0.614) (0.674) Industry dummies YES YES YES YES YES YES Year dummies YES YES YES YES YES YES N observations 265 265 67 67 74 74 Note . Heteroscedasticity-consistent standard errors are reported in parentheses. Significance at 1%, 5%, and 10% is denoted by ***, ** and *, respectively.
In columns 3 to 6, we directly test our hypotheses by focusing on gazelles (columns 3 and 4) and ponies (columns 5 and 6) to capture the differential effects of BAs in supporting these companies. The results show interesting differences between the two groups. The sales growth of a gazelle is strongly linked to the investor’s experience as an entrepreneur. We argue that, having already successfully built a venture, the BA has developed a set of skills useful for fostering the growth of the invested companies. This effect does not hold for ponies, for which the entrepreneurial experience of the investing BA is not significant. These results confirm our intuition that BAs with entrepreneurial experience provide a more effective contribution to the growth path of gazelles, which are better positioned to take advantage of external knowledge than ponies, whose entrepreneurs may be less permeable to knowledge assimilation.
Regarding BAs’ financial experience, the estimates do not produce a significant result for the growth of gazelles, while the effect appears to be negative for ponies (only in Model 1, at a 5 percent confidence level). BAs with superior investment experience do not appear to be better at managing the investment process in these companies. Because of the specificities of gazelles’ growth path, accumulated knowledge in general investments does not seem to be pivotal for sustaining growth for gazelles. Moreover, greater investment experience might even lead to a lower capability to orientate the growth path of funded ventures when they are ponies. This could be useful for differentiat-ing among the types of previous investments for understanddifferentiat-ing which of them may help in managing the growth of these specific types of companies. We leave this aspect for future research.
The results for the investment-style-related variables suggest that the effect of coaching is negative for gazelles (though not significant at standard sig-nificance levels) but positive for ponies (significant at a 10 percent confidence level in Model 1), consistent with Hypothesis 4.
Finally, the results concerning the monitoring activity exerted by BAs on the invested companies appear to corroborate our intuition: Monitoring maintains its negative sign only for gazelles but is positive and significant for ponies. Consistent with the results for the overall BA-backed sample and those of previous studies (Bammens & Collewaert, 2014; Chua & Wu., 2012), our results suggest that the tightening of monitoring on gazelles negatively impacts their performance. This result confirms our intuition that monitoring is less effective in high-tech and knowledge-based rapid-growth entrepreneurial firms, which are typically more reluctant to disclose information to investors and for which tight monitoring might stifle entrepreneurial risk taking rather than enhance firm growth. By contrast, we observe a positive effect of mon-itoring on ponies, confirming that monmon-itoring may act as an effective tool for facilitating firm growth in less fast-growing innovative and knowledge-based environments.
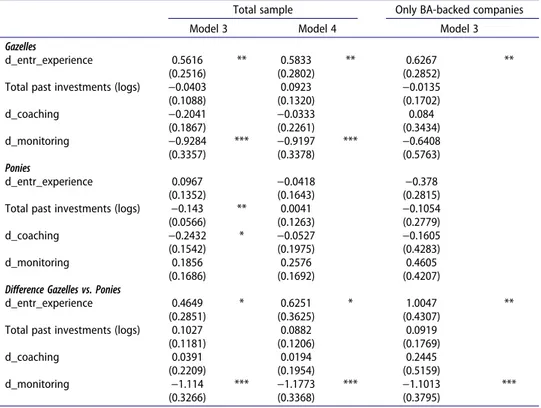
As a robustness check, we report estimates based on interactions that explicitly allow us to test the differences in BA characteristics’ effects between gazelles and ponies. The estimates reported in Table 8 refer to Models 3 and 4 in the first two columns. As a further check, we report in Column 3 the estimates of Model 3, restricted to the BA-backed sample and excluding control group companies.
Estimating the effect of BA characteristics on the growth of gazelles and ponies and comparing them requires that we test the linear combinations of coefficients, as explained in Section 5 (see Table 9). The results of these tests confirm what is described above regarding the estimates of Model 1: BAs’ entrepreneurial experi-ence has a positive and significant effect on the performance of gazelles, while the effect is not significant for ponies. Moreover, the test in the lower section of Table 9 comparing the coefficient for ponies and gazelles confirms that the role of BAs’ Table 8. Regression results. Dependent variable: sales diff (log). Model with interactions.
Total sample Only BA-backed companies Model 3 Model 4 Model 3
BA-backed −0.3945
(0.316)
Company age (logs) −0.3272 *** −0.3305 *** −0.2941 (0.089) (0.09) (0.183) Capital invested (logs) −0.215 −0.2287 −0.3016
(0.394) (0.391) (0.545)
d_coinvestment −0.0804 −0.0793 0.0598
(0.164) (0.163) (0.174)
d_entr_experience −0.8004 ** −0.7415 ** −0.9623 * (0.358) (0.362) (0.494)
Total past investments (logs) 0.5397 ** 0.6824 *** 0.5232 (0.221) (0.258) (0.471) d_coaching −0.3169 −0.1545 −0.3569 (0.344) (0.347) (0.482) d_monitoring −1.265 *** −1.2803 *** −1.1975 *** (0.376) (0.381) (0.406) d_entr_experience*d_gazelle 1.362 *** 1.3248 *** 1.589 *** (0.438) (0.45) (0.524)
Total past investments (logs)*d_gazelle −0.58 *** −0.5901 *** −0.5367 (0.214) (0.215) (0.352) d_coaching*d_gazelle 0.1128 0.1212 0.4409 (0.4) (0.388) (0.698) d_monitoring*d_gazelle 0.3366 0.3606 0.5567 (0.502) (0.509) (0.614) d_entr_experience*d_pony 0.8971 ** 0.6997 * 0.5843 (0.379) (0.402) (0.585)
Total past investments (logs)*d_pony −0.6827 *** −0.6783 *** −0.6286 * (0.223) (0.219) (0.325) d_coaching*d_pony 0.0737 0.1018 0.1964 (0.368) (0.366) (0.55) d_monitoring*d_pony 1.4506 *** 1.5379 *** 1.658 *** (0.438) (0.454) (0.514) Constant 1.1643 *** 0.9663 *** 2.0937 ** (0.437) (0.359) (0.868)
Industry dummies YES YES YES
Year dummies YES YES YES
N observations 265 265 49
Heteroscedasticity-consistent standard errors are reported in parentheses. Significance at 1%, 5% and 10% is denoted by ***, ** and *, respectively.
entrepreneurial experience is stronger for gazelles than for ponies. Financial experience and coaching seem not to play a significant role for either gazelles or ponies (with the exception of a negative effect of financial experience, significant at a 5 percent confidence level, and a negative effect of coaching, significant at a 10% confidence level, in Model 3 for ponies). No significant differences are found between gazelles and ponies for these two BA characteristics. Finally, while monitoring plays a negative role in the growth of gazelles, this role is weaker for them than for ponies, as Hypothesis 3 proposes.
Concluding remarks
BAs are the primary source of financing for new ventures and appear to be largely heterogeneous in terms of personal traits and characteristics. Besides the benefits derived from capital infusion, BA-backed firms benefit from BAs’ entrepreneurial and investment experience, industry knowledge, and network of business contacts (Tenca et al., 2018). These competences are brought to the firm directly; they constitute the basis on which firms’ capabilities are built and are responsible for superior performance. Thus, presence of a greater avail-ability of capital together with an additional set of nonmonetary contributions is deemed to affect the growth prospects of funded ventures.
Table 9. Test results on estimates in Table 8.
Total sample Only BA-backed companies
Model 3 Model 4 Model 3
Gazelles
d_entr_experience 0.5616 ** 0.5833 ** 0.6267 ** (0.2516) (0.2802) (0.2852)
Total past investments (logs) −0.0403 0.0923 −0.0135 (0.1088) (0.1320) (0.1702) d_coaching −0.2041 −0.0333 0.084 (0.1867) (0.2261) (0.3434) d_monitoring −0.9284 *** −0.9197 *** −0.6408 (0.3357) (0.3378) (0.5763) Ponies d_entr_experience 0.0967 −0.0418 −0.378 (0.1352) (0.1643) (0.2815) Total past investments (logs) −0.143 ** 0.0041 −0.1054 (0.0566) (0.1263) (0.2779)
d_coaching −0.2432 * −0.0527 −0.1605
(0.1542) (0.1975) (0.4283)
d_monitoring 0.1856 0.2576 0.4605
(0.1686) (0.1692) (0.4207)
Difference Gazelles vs. Ponies
d_entr_experience 0.4649 * 0.6251 * 1.0047 ** (0.2851) (0.3625) (0.4307)
Total past investments (logs) 0.1027 0.0882 0.0919 (0.1181) (0.1206) (0.1769)
d_coaching 0.0391 0.0194 0.2445
(0.2209) (0.1954) (0.5159)
d_monitoring −1.114 *** −1.1773 *** −1.1013 *** (0.3266) (0.3368) (0.3795)
We build on a unique data set of BA-backed companies and a PSM control group to investigate whether BAs’ individual attributes and investment approaches affect the growth of funded start-ups that show different growth patterns at the investment date. In doing so, we distinguish between gazelles, high-growth firms with potentially disruptive impacts on the market, and ponies, companies with relatively slow growth rates but high resilience. While gazelles seem the obvious investment of choice for BAs, gazelles incorporate substantial risks that may need special handling by these initial investors.
The results show interesting correlations between BAs’ characteristics and investment approaches and the growth rates of invested companies, with different patterns between gazelles and ponies. Building on insights from the resource-based view and the theory of absorptive capacity, we show that the growth of gazelles is strongly linked to the investors’ experience as entrepre-neurs. This effect does not hold for ponies. We argue that gazelles are better positioned to take advantage of external knowledge inflows than ponies, whose entrepreneurs may be less permeable to knowledge assimilation. BAs’ invest-ment experience and coaching seem not to play a significant role in the growth rate of either gazelle or ponies. Finally, we find that the tightening of monitor-ing negatively affects gazelles’ performance but positively affects ponies’ growth. We argue that monitoring is less effective for high-tech and knowl-edge-based rapid-growth entrepreneurial firms because it stifles entrepreneur-ial risk taking; by contrast, it is an effective tool for facilitating firm growth in less fast-growing innovative and knowledge-based environments.
Our findings may have interesting normative implications, as they highlight how investors’ distinctive personal traits and investment strategies in the early fundraising stages might shape funded firms’ growth paths. Understanding the mechanisms behind the effect of investors’ intervention into performance is therefore of particular importance for policy targeted at small firms.
ORCID
Annalisa Croce http://orcid.org/0000-0003-1026-2218
Elisa Ughetto http://orcid.org/0000-0002-6019-1051
Stefano Bonini http://orcid.org/0000-0003-4247-0476
Vincenzo Capizzi http://orcid.org/0000-0003-3761-9942
References
Acs, Z., Parsons, W., & Spencer, T. (2008). High-impact firms: Gazelles revisited. United States Small Business Administration. Office of Advocacy.
Avdeitchikova, S., & Landström, H. (2016). The economic significance of business angels: Toward comparable indicators. Handbook of Research on Business. Edward Elgar.
Bammens, Y., & Collewaert, V. (2014). Trust between entrepreneurs and angel investors: Exploring positive and negative implications for venture performance assessments. Journal of Management, 40(7), 1980–2008. https://doi.org/10.1177/0149206312463937
Barney, J. A. (1991). Firm resources and sustained competitive advantage. Journal of Management, 17(1), 99–120. https://doi.org/10.1177/014920639101700108
Bessière, V., Stéphany, E., & Wirtz, P. (2020). Crowdfunding, business angels, and venture capital: An exploratory study of the concept of the funding trajectory. Venture Capital, 22(2), 135–160. https://doi.org/10.1080/13691066.2019.1599188
Bhattacharya, S., & Ritter, J. R. (1983). Innovation and communication: Signaling with partial disclosure. The Review of Economic Studies, 50(2), 331–346. https://doi.org/10.2307/ 2297419
Birch, D. L., & Medoff, J. (1994). Gazelles. In L. C. Solmon & A. R. Levenson (Eds.), Labor markets, employment policy and job creation (pp. 159–167). Westview.
Blundell, R., & Costa Dias, M. (2000). Evaluation methods for non-experimental data. Fiscal Studies, 21(4), 427–468. https://doi.org/10.1111/j.1475-5890.2000.tb00031.x
Bonini, S., Capizzi, V., Valletta, M., & Zocchi, P. (2018). Angel network affiliation and business angels’ investment practices. Journal of Corporate Finance, 50(3), 592–608. https://doi.org/ 10.1016/j.jcorpfin.2017.12.029
Bonini, S., Capizzi, V., & Zocchi, P. (2019). The performance of angel-backed companies. Journal of Banking and Finance, 100(3), 328–345. https://doi.org/10.1016/j.jbankfin.2018.12.006
Bonnet, C., Wirtz, P., & Haon, C. (2013). Liftoff: When strong growth is predicted by angels and fuelled by professional venture funds. Revue de l’Entrepreneuriat, 12(4), 59–78. https:// doi.org/10.3917/entre.124.0059
Bosma, N., Van Praag, M., Thurik, R., & de Wit, G. (2004). The value of human capital and social capital investments for the business performance of start-ups. Small Business Economics, 23(3), 227–236. https://doi.org/10.1023/B:SBEJ.0000032032.21192.72
Brau, J. C., Brown, R. A., & Osteryoung, J. S. (2004). Do venture capitalists add value to small manufacturing firms? An empirical analysis of venture and non venture capital-backed initial public offerings. Journal of Small Business Management, 42(1), 78–92. https://doi. org/10.1111/j.1540-627X.2004.00098.x
Bruton, G., Filatotchev, I., Chahine, S., & Wright, M. (2010). Governance, ownership structure, and performance of IPO firms: The impact of different types of private equity investors and institutional environments. Strategic Management Journal, 31(5), 491–509. https://doi.org/ 10.1002/smj.822
Busenitz, L. W., & Barney, J. B. (1997). Differences between entrepreneurs and managers in large organizations: Biases and heuristics in strategic decision-making. Journal of Business Venturing, 12(1), 9–30. https://doi.org/10.1016/S0883-9026(96)00003-1
Carpenter, R., & Petersen, B. (2002). Capital market imperfections, high-tech investment and new equity financing. Economic Journal, 112(477), 54–72. https://doi.org/10.1111/1468- 0297.00683
Chahine, S., Filatotchev, I., & Wright, M. (2007). Venture capitalists, business angels, and performance of entrepreneurial IPOs in the UK and France. Journal of Business Finance & Accounting, 34(3–4), 505–528. https://doi.org/10.1111/j.1468-5957.2007.02045.x
Chemmanur, T. J., Krishnan, K., & Nandy, D. (2011). How does venture capital financing improve efficiency in private firms? A look beneath the surface. Review of Financial Studies, 24(12), 4037–4090. https://doi.org/10.1093/rfs/hhr096
Chua, J., & Wu., Z. (2012). Value added by angel investors through post-investment involve-ment: Exploratory evidence and ownership implications. In D. Cumming (Ed.), The Oxford handbook of venture capital (pp. 721–750). Oxford University Press.
Cohen, W., & Levinthal, D. (1990). Absorptive capacity: A new perspective on learning and innovation. Administrative Science Quarterly, 35(1), 123–133. https://doi.org/10.2307/ 2393553
Collewaert, V., & Manigart, S. (2016). Valuation of angel-backed companies: The role of investor human capital. Journal of Small Business Management, 54(1), 356–372. https:// doi.org/10.1111/jsbm.12150
Colombo, M. G., Croce, A., & Guerini, M. (2013). The effect of public subsidies on firm’s investment-cash flow sensitivity: Transient or persistent? Research Policy, 42(9), 1605–1623.
https://doi.org/10.1016/j.respol.2013.07.003
Colombo, M. G., & Grilli, L. (2005). Entrepreneurs’ human capital and the growth of new technology-based firms: A competence-based view. Research Policy, 34(6), 795–816. https:// doi.org/10.1016/j.respol.2005.03.010
Colombo, M. G., & Grilli, L. (2010). On growth drivers of high-tech start-ups: Exploring the role of entrepreneurs’ human capital and venture capital. Journal of Business Venturing, 25 (6), 610–626. https://doi.org/10.1016/j.jbusvent.2009.01.005
Conner, K. R., & Prahalad, C. K. (1996). A resource-based theory of the firm: Knowledge versus opportunism. Organization Science, 7(5), 477–501. https://doi.org/10.1287/orsc.7.5.477
Cooper, A. C., Gimeno-Gascon, F. J., & Woo, C. Y. (1994). Initial human and financial capital as predictors of new venture performance. Journal of Business Venturing, 9(5), 371–395.
https://doi.org/10.1016/0883-9026(94)90013-2
Cotè, S. (2011). How social class shapes thoughts and actions in organizations. Research in Organizational Behavior, 31, 43–71. https://doi.org/10.1016/j.riob.2011.09.004
Coveney, P., & Moore, K. (1998). Business angels: Securing start-up finance. John Wiley & Sons. Croce, A., Guerini, M., & Ughetto, E. (2018). Angel financing and the performance of high-tech
start-ups: An exploratory study. Journal of Small Business Management, 56(2), 208–228.
https://doi.org/10.1111/jsbm.12250
Croce, A., & Martì, J. (2016). Productivity growth in venture-backed family firms. Entrepreneurship Theory & Practice, 40(3), 657–683. https://doi.org/10.1111/etap.12138
Croce, A., Marti, J., & Murtinu, S. (2013). The impact of venture capital on the productivity growth of European entrepreneurial firms: ‘Screening’ or ‘value added’ effect? Journal of Business Venturing, 28(4), 489–510. https://doi.org/10.1016/j.jbusvent.2012.06.001
Croce, A., Tenca, F., & Ughetto, E. (2017). How business angel groups work: Rejection criteria in investment evaluation. International Small Business Journal, 35(4), 405–426. https://doi. org/10.1177/0266242615622675
Croce, A., Ughetto, E., & Cowling, M. (2020). Investment motivations and UK business angels’ appetite for risk taking: The moderating role of experience. British Journal of Management, 31(4), 728-751. https://doi.org/10.1111/1467-8551.12380
De Leeuw, E. D. (2005). To mix or not to mix data collection modes in surveys. Journal of Official Statistics, 21(2), 233–255.
Dillman, D. A., Smyth, J. D., & Christian, L. M. (2009). Internet, mail, and mixed-mode surveys: The tailored design method. Wiley & Sons.
Drover, W., Busenitz, L., Matusik, S., Townsend, D., Anglin, A., & Dushnitsky, G. (2017). A review and road map of entrepreneurial equity financing research: Venture capital, corporate venture capital, angel investment, crowdfunding and accelerators. Journal of Management, 43(6), 1820–1853. https://doi.org/10.1177%2F0149206317690584
Ehrlich, S., De Noble, A., Moore, T., & Weaver, R. (1994). After the cash arrives: A comparative study of venture capital and private investor involvement in entrepreneurial firms. Journal of Business Venturing, 9(1), 67–82. https://doi.org/10.1016/0883-9026(94)90027-2
Fiet, J. O. (1995). Risk avoidance strategies in venture capital markets. Journal of Management Studies, 32(4), 551–574. https://doi.org/10.1111/j.1467-6486.1995.tb00788.x