Contents lists available atScienceDirect
Infrared Physics & Technology
journal homepage:www.elsevier.com/locate/infraredLetter to the Editor
Is the maximum value in the region of interest a reliable indicator of skin temperature? Dear Editor,
The use of infrared thermal imaging in sport and exercise sciences has been growing continuously since the last decade. Applications have been found in the area of sports medicine [1,2], clothing design[3], exercise physiology [4,5], performance assessment [6,7], movement technique characterization[8,9]. Although it is now recognised by the scientific community, there are still numerous aspects that need to be investigated for ameliorating the reliability of its application, especially from a methodological perspective. Among them, the analysis of thermal images for extracting temperature values describing tempera-ture distribution of regions of interest has been little investigated[10]. We recently compared two image analysis methods for the assessment of the skin temperature with infrared thermal imaging following phy-sical exercise[11]. The two methods were denoted as Troi and Tmax. Troi is the average temperature within the region of interest (ROI), whereas Tmax hinges on a software-driven process that automatically selects the five hottest pixels within the ROI (having a minimum dis-tance of five pixels from each other) and then averages the temperature of the 5 × 5-pixels areas around them[12]. It is plausible that Tmax is less affected than Troi by the operator-dependent definition of the size and position of the ROI because it focuses exclusively on the largest extrema of the skin temperature distribution.
In the course of the review process, one of the anonymous referees suggested us to widen the scope of our paper by providing an extra comparison among Troi, Tmax and the maximum value of skin tem-perature within the ROI (denoted as MAX in the following). The re-viewer maintained that this comparison would have been of interest for the scientific community given that MAX is being used by some Authors in the literature[13–16]. We appreciated the referee’s suggestion and pondered whether to include this additional comparison. Eventually, given that the paper was already rather lengthy, we chose to pursue such comparison in a subsequent follow-up communication. This letter to the Editor has precisely this purpose. Specifically, the aim of our analysis is twofold. First, to compare the average time courses of MAX, Tmax and Troi, as well as to evaluate their degree of association by Pearson's correlation coefficient. Second, to establish whether MAX (which is the temperature of a single pixel) is noisier than Tmax (which is the average of 125 among the warmest pixels in the ROI) and Troi (which is the average of all the pixels within the ROI).
Fig. 1shows the average time courses of MAX, Tmax, and Troi, as well as the time courses of the average differences and Pearson's cor-relation coefficients between pairs of them. Apparently, the three skin temperature indicators changed almost in parallel (top panel), but the differences (middle panel) and correlations plots (bottom panel) added some valuable insights into the relationships among them. The differ-ence between MAX and Tmax was small and remained confined within a well-restricted range (0.2–0.4 °C) throughout the experiment. In ad-dition, the time course of Pearson's correlation coefficient between MAX and Tmax always remained excellent (exceeding r = 0.97). In
contrast, the relationships Tmax vs. Troi and MAX vs. Troi were non-negligibly influenced by the nonsteady state following the initiation of exercise. Specifically, the difference between Tmax and Troi increased from a basal value of approximately 0.6 °C to a maximum of approxi-mately 0.9 °C. The correlation coefficient between Tmax and Troi was above 0.95 in the basal state, but then decreased exhibiting a bowl-shaped pattern with a nadir of 0.88. The difference between MAX and Troi increased from a basal value of approximately 0.9 °C to a max-imum of approximately 1.2 °C. The correlation coefficient between MAX and Troi was above 0.90 in the basal state, but then decreased exhibiting a bowl-shaped pattern with a nadir of 0.83. The take-home message of this analysis is that, at the group level, MAX and Tmax re-mained proportional throughout the experiment and were similarly correlated with Troi.
To clarify whether MAX was noisier than Tmax and Troi, we com-pared the three indicators at the level of each individual subject. We started from the premise that the time course of skin temperature re-corded in each individual subject can be conceived as the superposition of two components: a smooth deterministic component (denoted in the following as “trend”) and a random component (that is, the natural time-to-time variability around the trend plus the variability associated to infrared imaging acquisition and processing, denoted in the fol-lowing as “noise”). We also made the hypothesis that such random component was Gaussian, with zero mean, constant variance and un-correlated. In the attempt to remove the trend from the time courses of Tmax and MAX, we used two alternative approaches. The first is a technique frequently used in the field of time series analysis called differencing[17]. The second approach is nonparametric regression [18]. In the following, we will briefly describe the two approaches and report the results generated by each of them. We will show that both approaches lead to the same conclusions about the relative size of the noise associated to MAX, Tmax and Troi.
Differencing consists in applying the difference operator to the original time series to obtain a new time series which ends up reflecting the random component only. Differencing can be performed succes-sively. Typically, for a bowl-shaped trend as the one observed in our study, differencing is applied twice. The analytical expression of the second difference is given by:
= − − = − − − − − − = − − + −
D y2t Dy Dyt t 1 (y yt t 1) (yt 1 yt 2) y yt 2t 1 yt 2 (1) where D is the difference operator and ytis the original time series collected at regularly spaced sampling times t = 1,2,…n. Using such an approach, we derived three de-trended sequences in each individual subject, one for each skin temperature indicator.
Fig. 2illustrates the results of this analysis in two representative subjects. The upper panels report the time courses of MAX and Tmax, while the lower panels display the profiles of the two sequences gen-erated by differencing. The results obtained for Troi were not included in the figure because this would have required a wider range of the
https://doi.org/10.1016/j.infrared.2018.06.017
temperature axis, thus making much more difficult to appreciate the differences between MAX and Tmax. The overall impression yielded by the visual inspection of the upper panels is that the time courses of MAX and Tmax changed almost in parallel, but that MAX was less smooth than Tmax. The two de-trended sequences reported in the lower panels exhibited the expected roughness typical of experimental noise. All the de-trended series of MAX, Tmax and Troi were then subjected to sta-tistical analysis. Student's one sample t-test showed that the mean of each sequence was not different from zero. No systematic pattern was evident and the Wald-Wolfowitz runs test[19], which was applied to the number of runs above and below the zero line, showed that each sequence was compatible with the hypothesis of randomness. In addi-tion, the variability of each sequence around the zero line did not bear any visible sign of increasing/decreasing variance. Finally, the Shapiro-Wilk test showed that each sequence was compatible with the hy-pothesis of normality. All in all, we had evidence that the de-trended sequences obtained from MAX, Tmax and Troi satisfied the typical statistical assumptions generally associated to the experimental noise. In order to assess the amount of noise associated to MAX, Tmax and Troi, we evaluated the standard deviation of each de-trended sequence. The distribution of such standard deviations across all subjects (n = 13) was examined by visual inspection. The distribution was not symmetric, but right skewed. As a result, the standard deviation was summarized using the median and the interquartile range (IQR). Likewise mean and standard deviation, the median and IQR measure the central tendency
and spread, respectively, but are robust against outliers and deviations from normality. The first row ofTable 1reports the results together with the comparison among the three temperature indicators performed by Friedman's nonparametric test for repeated measures followed by Dunn's post-hoc test. It was found that the median standard deviation of the sequence derived from MAX was significantly higher than the one derived from Tmax and Troi. These results support the hypothesis that MAX is noisier than Tmax and Troi, probably because the former latter indicator hinges on a single pixel, whereas the latter two indicators stem from an averaging process.
To provide supplementary evidence corroborating these findings, we performed the de-trending of the MAX, Tmax and Troi time series by using an alternative approach based on nonparametric regression. Nonparametric regression is adopted when the trend is curved, but its functional form is not known or not easily described by a parametric model. There are several techniques for nonparametric regression, but local polynomial regression and splines are the most widely used. In this study, we resorted to penalized splines, as implemented in the statistical software JMP®, Version 13 (SAS Institute Inc., Cary, NC, USA). A spline is a smooth function constructed by piecing together low-order polynomials (the order p is usually 2 or 3) at specific loca-tions (called knots), so that the resulting function possesses p-1 con-tinuous derivatives. The amount of smoothing (and thus the degree of stiffness/flexibility of the spline) is governed by a penalizing parameter (denoted asλ). We selected λ by trial and error in such a way that the
Fig. 1. This figure compares MAX, Tmax and Troi following a squat exercise in 13 subjects (data from Formenti et al., 2017 [[11]]). The top panel shows the profiles (Mean ± SEM) of MAX, Tmax and Troi. The middle panel shows the profiles (Mean ± SEM) of the deltas MAX-Troi, Tmax-Troi and MAX-Tmax. The bottom panel shows the profiles of the Pearson's correlation coefficients obtained by comparing MAX vs. Tmax, Tmax vs. Troi and MAX vs. Troi at each time point. The shaded area in each panel indicates the exercise duration.
resulting spline was able to highlight the overall trends in the data without overfitting them. Eventually, all the data sets were fitted using λ = 750,000.
Fig. 3 shows the results of the spline fit in the same two re-presentative subjects. The upper panels show the scatterplot of MAX and Tmax experimental data together with the respective spline fits. The lower panels display the profiles of the residuals associated to the two spline fits. The residuals exhibited the expected roughness typical of experimental noise. All the sequences of residuals associated to the MAX, Tmax and Troi spline fits were then subjected to statistical ana-lysis using the same methodology outlined above for the de-trended sequences obtained by differencing. At the end, we had evidence that the sequences of residuals obtained by fitting MAX, Tmax and Troi with penalized splines satisfied the typical statistical assumptions generally associated to the experimental noise. In order to assess the amount of noise associated to MAX, Tmax and Troi, we evaluated the standard deviation of the sequences of residuals. The distribution of such stan-dard deviations across all subjects (n = 13) was examined by visual
inspection. The distribution was not symmetric, but right skewed. As a result, the standard deviation was summarized using the median and the interquartile range (IQR). The second row ofTable 1reports the results together with the comparison among the three temperature in-dicators performed by Friedman's nonparametric test for repeated measures followed by Dunn's post-hoc test. It was found that the median standard deviation of the sequences of residuals derived from MAX was significantly higher than the one derived from Tmax and Troi (seeTable 1).
Visual inspection ofTable 1allows one to compare the results ob-tained with the two de-trending methods. Some comments are in order. First, the two methods provided different estimates of the amount of noise affecting MAX, Tmax and Troi. The amount of noise estimated by differencing resulted systematically higher (almost three times) than that estimated using spline fitting. It stands to reason that such dis-crepancy is related with the fact that differencing and spline fitting share the same goal, but hinge on different, albeit specular, approaches to data filtering. Whereas differencing is a high-pass filter aimed to
Fig. 2. This figure shows the de-trending results obtained with the differencing technique in two representative subjects. The upper panels display the time courses of MAX and Tmax. It can be seen that MAX and Tmax changed in parallel, but MAX was somewhat less smooth than Tmax. The lower panels show the profiles of the two de-trended sequences generated by second differencing MAX and Tmax. Such sequences exhibited the expected roughness typical of experimental noise. In both subjects, the de-trended sequence derived from MAX showed a higher variability than the one derived from Tmax.
Table 1
Magnitude of the noise affecting MAX, Tmax and Troia. This table shows the results of the data analysis aimed to estimate the size (i.e., the standard deviation) of the
noise affecting the three skin temperature indicators (MAX, Tmax, Troi). Two different data-filtering methods were employed to estimate the noise: differencing and spline fitting. The median and interquartile range values of the standard deviations of the noise obtained in n = 13 subjects are reported for the three skin tem-perature indicators and for the two data-filtering methods. For each data-filtering method, the results of the three skin temtem-perature indicators were compared by using Friedman's nonparametric test for repeated measures. Friedman's test resulted statistically significant for either data-filtering method and was thus followed by Dunn's post-hoc test for multiple contrasts. Only the statistically significant contrasts are shown in the table.
MAX (°C) Tmax (°C) Troi (°C)
Friedman's test Dunn's post-hoc contrasts
Differencing 0.288 (0.251–0.331) 0.251 (0.154–0.285) 0.189 (0.143–0.247) p = 0.001 MAX vs. Tmax (p = 0.03); MAX vs. Troi (p = 0.003)
Penalized spline fit 0.091 (0.075–0.138) 0.087 (0.065–0.119) 0.069 (0.057–0.094) p = 0.01 MAX vs. Tmax (p = 0.03); MAX vs. Troi (p = 0.02)
a The average results obtained with two de-trending methods are reported as medians. Each median is accompanied by the interquartile range (range between the
1st and the 3rd quartile) which is reported between parentheses. Letter to the Editor
obtain the fast oscillations in the data associated with noise, spline fitting is a low-pass filter aimed to preserve the smooth part of the signal (the trend) and derive the noisy part from the residuals of the fit. Despite different estimates of the absolute size of the noise, the two methods yielded similar descriptions of the relative size of the noise among the three skin temperature indicators. Indeed, both methods indicated that the noise affecting Tmax and Troi was lower than that affecting MAX. Such differences (MAX vs. Tmax and MAX vs. Troi) achieved the statistical significance with both methods. Such con-cordance between the two methods supports our initial hypothesis that the noise affecting MAX (which is based on a single pixel) is more elevated than that affecting Tmax and Troi (which both hinge on an averaging process involving many pixels). A final observation is that MAX resulted only slightly noisier that Tmax. Differencing indicated that the median standard deviation of the noise affecting MAX was only 15% higher than that associated to Tmax. The spline fit provided even a narrower gap (5%) between the magnitudes of the noise affecting the two indicators. These findings are consistent with the visual impression that can be gleaned from the inspection of the individual time courses of MAX and Tmax reported inFig. 2. The time courses of MAX are only slightly more jagged than those of Tmax. Thus, MAX appears as a fairly usable skin temperature indicator and this is good news for those in-vestigators planning to use MAX in their studies. A possible explanation for such good performance of MAX viz-à-viz Tmax is probably related with the fact that the noises affecting these two skin temperature in-dicators arise from the superposition of many components. Noise re-presents the natural time-to-time variability around the trend plus the variability associated to the acquisition of the infrared image and its subsequent processing. It is possible that the advantage of Tmax over MAX (i.e., being the average of 125 pixels vs. a single pixel measure-ment) may be partially masked by other common sources of variability (such as, for instance, spontaneous fluctuations in skin blood flow, as well as the slight changes in the ROI contour from one time to another).
Given the above results, should we conclude that, apart from a slightly higher sensitivity to noise, MAX is virtually interchangeable with Tmax? A full answer cannot come from the above analysis because the relationship between Tmax and MAX is likely to depend on many factors such as the type of heat source, composition of the body part beneath the investigated surface area, the size of the ROI. One may argue that MAX, representing the temperature of a single pixel, may be affected by the resolution of the employed infrared thermal camera. In this sense, an infrared resolution of 320 × 240 pixels is considered to be the minimum resolution required for satisfactory data in human as-sessments[1]. We stress that the present data derived from an experi-ment in which thermal images were recorded by a thermal camera with a thermal resolution of 320 × 240 pixels (AVIO, TVS-700, 320 × 240, Microbolometric Array, 8–14 µm spectral range, NETD 0.07 K, 35 mm lens; Nippon Avionics Co, Ltd, Tokyo, Japan). Nevertheless, we had the opportunity to throw additional light on this issue by applying the above analysis to the data of a previous study conducted by some of the same Authors of this letter[20].
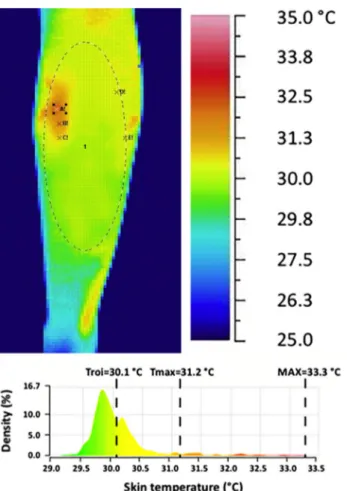
In that study, the effect of physical fitness on exercise-associated skin temperature changes was investigated in trained and untrained female subjects. The subjects performed standing calf rise exercise for 2 min. Skin temperature of the calves were measured before, during, and for 7 min after the exercise. The analysis of the thermal images was accomplished using Tmax. It was found that trained subjects increased their skin temperature more quickly than untrained controls. In the process of re-analysing those data with the above-described metho-dology, we found a trained subject displaying a thermal image that deserves to be brought to the attention of the investigators planning to use MAX in their studies. In this subject, the difference between MAX and Tmax was 2.1 °C, and thus much higher than that reported in Figs. 1 and 2. Such a huge gap between Tmax and MAX is a red flag. What is going on here? The ROI originating such anomaly is displayed inFig. 4. The ROI is drawn on the calf of the subject while she was
Fig. 3. This figure shows the de-trending results obtained with nonparametric regression (via penalized splines) in two representative subjects. The upper panels display the time courses of MAX and Tmax together with the corresponding splines fits. The lower panels show the profiles of the two sequences of residuals associated to the splines fitted to MAX and Tmax. Such sequences exhibited the expected roughness typical of experimental noise. In both subjects, the sequence of residuals associated to MAX showed a higher variability than the one associated to Tmax.
performing the calf rise exercise. It can be seen that the ROI is char-acterized by the presence of a single hot spot located close to the left border of the ROI. Of course, MAX is located inside the hot spot. However, the algorithm yielding Tmax spans the whole ROI and is in-structed to avoid the overlapping of the 5 × 5-pixels areas. As a result, three areas are located within the hot spot (A, B, C), whereas two other areas (D, E) are located outside the hot spot, where the skin tempera-ture is relatively more elevated than elsewhere. One can also appreciate the situation by looking at the histogram which exhibits an extremely long and flat right tail. This example is instructive for two reasons. First, it illustrates that derivation of a skin temperature indicator cannot be performed blindly, but should always be accompanied by visual in-spection of the thermal image. Second, it raises awareness about one potential pitfall in the use of MAX. Indeed, the presence of a single hot spot within the ROI may expose MAX to the risk of yielding an un-balanced perspective of the skin temperature within the ROI. It stands to reason that under such conditions, Tmax may represent a safer choice. Moreover, given than Tmax originates from 5 clusters of 25 neighbouring pixels, the size-of-source effect (SSE), as reported by Grgić and Pušnik[21], is likely to be negligible.
In summary, in the present follow-up communication we offered some insights into the reliability of the maximal temperature value within the ROI as a descriptor of skin temperature during the nonsteady state induced by physical exercise. We provided evidence that the as-sessment of skin temperature using MAX yields a description of skin temperature that is close and tightly associated with the one provided by Tmax. Two shortcomings of MAX that our analysis has contributed to uncover are a higher risk of noise corruption than Tmax, and a pe-culiar sensitivity to the presence of a single hot spot in the thermal
image. Given that the calculation of Tmax is software-driven and does not require particular efforts and expertise to the investigator, we purport that Tmax may be a reasonable choice to monitor the upper portion of the thermal distribution within the ROI. Some preliminary guidance about the choice between Tmax and Troi can also be offered. As we have shown in[11], and confirmed in this study, Tmax and Troi remain very well correlated during the nonsteady state following the initiation of physical exercise, but have specular strengths and short-comings. Because Tmax is sensitive to the warmest pixels within the ROI, it might be particularly suitable to investigate skin temperature changes related with blood perfusion and inflammation. On the other hand, given that Tmax only hinges on the extreme upper tail of the skin temperature distribution, it may become overly sensitive to the pre-sence of tiny hot spots within the ROI, such those accompanying sweating. Future studies examining the thermoregulatory responses produced by aerobic-type exercise and entailing the joint assessment of skin temperature and skin blood flow will probably shed light on these issues. In conclusion, the observations emerging from the present study can be useful for the investigators interested in quantifying the thermal effects of physical exercise, especially in the light of the increasing demand for a better definition of the domain of validity of skin tem-perature indicators.
Declarations of interest None.
Fig. 4. Thermal image and relative frequency distribution of temperature pixels within the ROI in a female athlete participating in the experimental study described in Formenti et al.[20]. The ROI, which is drawn on the calf of the subject while performing a calf rise exercise, is characterized by the presence of a single hot spot. This situation is reflected in a temperature histogram showing an extremely long and flat right tail. As a result, MAX is located very far away from both Tmax and Troi.
Acknowledgements
We thank Dr Pasquale Lo Bianco for the excellent technical assis-tance he provided as he was working for his Master Thesis in Exercise Sciences at the University of Milan, Italy. Andrea Caumo and Giampietro Alberti are recipients on an intramural grant of the Università degli Studi di Milano (Linea 2B) for a research project en-titled: Modellistica di dati termografici durante lo stato non stazionario indotto dall'esercizio fisico. This work has been partially funded by the EU project SoBigData grant n. 654024.
References
[1] C. Hildebrandt, C. Raschner, K. Ammer, An overview of recent application of medical infrared thermography in sports medicine in Austria, Sensors 10 (2010)
4700–4715,http://dx.doi.org/10.3390/s100504700.
[2] A. de A. Fernandes, E.M. Pimenta, D.G. Moreira, M. Sillero-Quintana, J.C.B. Marins, R.F. Morandi, T. Kanope, E.S. Garcia, Skin temperature changes of under-20 soccer
players after two consecutive matches, Sport Sci Health (2017) 1–9,http://dx.doi.
org/10.1007/s11332-017-0394-1.
[3] D. Fournet, L. Ross, T. Voelcker, B. Redortier, G. Havenith, Body mapping of thermoregulatory and perceptual responses of males and females running in the
cold, J. Therm. Biol. 38 (2013) 339–344,http://dx.doi.org/10.1016/j.jtherbio.
2013.04.005.
[4] J.I. Priego Quesada, N. Martínez, R. Salvador Palmer, A. Psikuta, S. Annaheim, R.M. Rossi, J.M. Corberán, R.M. Cibrián Ortiz de Anda, P. Pérez-Soriano, Effects of the cycling workload on core and local skin temperatures, Exp. Therm. Fluid Sci. 77
(2016) 91–99,http://dx.doi.org/10.1016/j.expthermflusci.2016.04.008.
[5] J.I. Priego Quesada, F.P. Carpes, R.R. Bini, R. Salvador Palmer, P. Pérez-Soriano, R.M. Cibrián Ortiz de Anda, Relationship between skin temperature and muscle activation during incremental cycle exercise, J. Therm. Biol. 48 (2015) 28–35, http://dx.doi.org/10.1016/j.jtherbio.2014.12.005.
[6] A. Trecroci, D. Formenti, N. Ludwig, M. Gargano, A. Bosio, E. Rampinini, G. Alberti, Bilateral asymmetry of skin temperature is not related to bilateral asymmetry of crank torque during an incremental cycling exercise to exhaustion, PeerJ 6 (2018)
e4438,http://dx.doi.org/10.7717/peerj.4438.
[7] N. Ludwig, A. Trecroci, M. Gargano, D. Formenti, A. Bosio, E. Rampinini, G. Alberti, Thermography for skin temperature evaluation during dynamic exercise: a case study on an incremental maximal test in elite male cyclists, Appl. Opt. 55 (2016)
D126,http://dx.doi.org/10.1364/AO.55.00D126.
[8] N. Ludwig, M. Gargano, D. Formenti, D. Bruno, L. Ongaro, G. Alberti, Breathing training characterization by thermal imaging: a case study, Acta Bioeng. Biomech. 14 (2012) 41–47.
[9] M. Chudecka, A. Lubkowska, K. Leźnicka, K. Krupecki, The use of thermal imaging in the evaluation of the symmetry of muscle activity in various types of exercises (symmetrical and asymmetrical), J. Human Kinet. 49 (2015) 141–147. [10] K. Ammer, D. Formenti, Does the type of skin temperature distribution matter?
Thermol. Int. 26 (2016) 51–54.
[11] D. Formenti, N. Ludwig, A. Rossi, A. Trecroci, G. Alberti, M. Gargano, A. Merla, K. Ammer, A. Caumo, Skin temperature evaluation by infrared thermography: comparison of two image analysis methods during the nonsteady state induced by
physical exercise, Infrared Phys. Technol. 81 (2017) 32–40,http://dx.doi.org/10.
1016/j.infrared.2016.12.009.
[12] N. Ludwig, D. Formenti, M. Gargano, G. Alberti, Skin temperature evaluation by infrared thermography: comparison of image analysis methods, Infrared Phys.
Technol. 62 (2014) 1–6,http://dx.doi.org/10.1016/j.infrared.2013.09.011.
[13] J.C. Bouzas Marins, A.A. Fernandes, D.G. Moreira, F. Souza Silva, C.M.A. Costa, E.M. Pimenta, M. Sillero-Quintana, Thermographic profile of soccer players’ lower
limbs, Revista Andaluza de Medicina Del Deporte 7 (2014) 1–6,http://dx.doi.org/
10.1016/S1888-7546(14)70053-X.
[14] J.T. Costello, K. Culligan, J. Selfe, A.E. Donnelly, Muscle, skin and core temperature
after −110°C cold air and 8°C water treatment, PLOS ONE 7 (2012) e48190,http://
dx.doi.org/10.1371/journal.pone.0048190.
[15] N. Maniar, A.J.E. Bach, I.B. Stewart, J.T. Costello, The effect of using different re-gions of interest on local and mean skin temperature, J. Therm. Biol. 49–50 (2015)
33–38,http://dx.doi.org/10.1016/j.jtherbio.2015.01.008.
[16] E. Skorupska bieta, M. Rychlik, W. Samborski, odzimierz, Validation and test-retest reliability of new thermographic technique called thermovision technique of dry needling for gluteus minimus trigger points in sciatica subjects and TrPs-negative
healthy volunteers, BioMed Res. Int. 2015 (2015) e546497,http://dx.doi.org/10.
1155/2015/546497.
[17] P. Diggle, Time Series: A Biostatistical Introduction, Oxford University Press, Oxford England, New York, 1996.
[18] W. Härdle, M. Müller, S. Sperlich, A. Werwatz, Nonparametric and Semiparametric Models, Springer-Verlag, Berlin Heidelberg, 2004 http://www.springer.com/la/ book/9783540207221 (accessed March 13, 2018)..
[19] P. Sprent, N.C. Smeeton, Applied Nonparametric Statistical Methods, 4th ed., Chapman and Hall/CRC, Boca Raton, 2007.
[20] D. Formenti, N. Ludwig, M. Gargano, M. Gondola, N. Dellerma, A. Caumo, G. Alberti, Thermal imaging of exercise-associated skin temperature changes in trained and untrained female subjects, Ann. Biomed. Eng. 41 (2013) 863–871, http://dx.doi.org/10.1007/s10439-012-0718-x.
[21] G. Grgić, I. Pušnik, Analysis of thermal imagers, Int. J. Thermophys. 32 (2011)
237–247,http://dx.doi.org/10.1007/s10765-011-0932-z.
Damiano Formenti⁎ Department of Biomedical Sciences for Health, Università degli Studi di Milano, Italy E-mail address:[email protected] Nicola Ludwig Department of Physics, Università degli Studi di Milano, Italy Alessio Rossi Department of Biomedical Sciences for Health, Università degli Studi di Milano, Italy Department of Computer Science, University of Pisa, Italy Athos Trecroci Department of Biomedical Sciences for Health, Università degli Studi di Milano, Italy Giampietro Alberti Department of Biomedical Sciences for Health, Università degli Studi di Milano, Italy Marco Gargano Department of Physics, Università degli Studi di Milano, Italy Arcangelo Merla Department of Neuroscience, Imaging and Clinical Sciences, University G. d’Annunzio of Chieti-Pescara, Italy Kurt Ammer Medical Imaging Research Unit, University of South Wales, Pontypridd, UK European Association of Thermology, Vienna, Austria Andrea Caumo Department of Biomedical Sciences for Health, Università degli Studi di Milano, Italy
⁎Corresponding author at: Department of Biomedical Sciences for Health, Università
degli Studi di Milano, Via Kramer, 4/A, 20129 Milano, Italy. Letter to the Editor
![Fig. 1. This figure compares MAX, Tmax and Troi following a squat exercise in 13 subjects (data from Formenti et al., 2017 [[11]])](https://thumb-eu.123doks.com/thumbv2/123dokorg/4956594.52837/2.892.270.616.110.666/figure-compares-tmax-troi-following-exercise-subjects-formenti.webp)