RED CELLS, IRON, AND ERYTHROPOIESIS
Decreasing TfR1 expression reverses anemia and hepcidin suppression
in
b-thalassemic mice
Huihui Li,1,2Tenzin Choesang,3Weili Bao,3Huiyong Chen,3,4Maria Feola,2,5Daniel Garcia-Santos,6Jie Li,7Shuming Sun,3,4 Antonia Follenzi,5Petra Pham,8Jing Liu,4,7Jinghua Zhang,7Prem Ponka,6Xiuli An,7Narla Mohandas,7Robert E. Fleming,9
Stefano Rivella,10Guiyuan Li,1and Yelena Z. Ginzburg1,2
1Hunan Key Laboratory of Carcinogenesis and Cancer Invasion, Cancer Research Institute, Central South University, Ministry of Education, Changsha, China;2Division of Hematology and Medical Oncology, Icahn School of Medicine at Mount Sinai, New York, NY;3Erythropoiesis Laboratory, New York Blood Center, New York, NY;4State Key Laboratory of Medical Genetics and School of Life Sciences, Central South University, Changsha, China; 5University of Piemonte Orientale, Amedeo Avogadro, Novara, Italy;6Jewish General Hospital, Lady Davis Institute, McGill University, Montreal, QC, Canada;7Laboratory of Membrane Biology, New York Blood Center, New York, NY;8Flow Cytometry Core Laboratory, Lindsley F. Kimball Research Institute, New York Blood Center, New York, NY;9Saint Louis University, Saint Louis, MO; and10Children’s Hospital of Philadelphia, Philadelphia, PA
Key Points
• Apotransferrin decreases TfR1 expression and alters TfR1 trafficking to normalize enucleation inb-thalassemic erythroid precursors.
• Decreased TfR1 upregulates hepcidin in an iron- and ERFE-independent manner, resulting in iron-restricted b-thalassemic erythropoiesis.
Iron availability for erythropoiesis and its dysregulation inb-thalassemia are incom-pletely understood. We previously demonstrated that exogenous apotransferrin leads to more effective erythropoiesis, decreasing erythroferrone (ERFE) and derepressing hepcidin inb-thalassemic mice. Transferrin-bound iron binding to transferrin receptor 1 (TfR1) is essential for cellular iron delivery during erythropoiesis. We hypothesize that apotransferrin’s effect is mediated via decreased TfR1 expression and evaluate TfR1 expression in b-thalassemic mice in vivo and in vitro with and without added apotransferrin. Our findings demonstrate that b-thalassemic erythroid precursors overexpress TfR1, an effect that can be reversed by the administration of exogenous apotransferrin. In vitro experiments demonstrate that apotransferrin inhibits TfR1 expression independent of erythropoietin- and iron-related signaling, decreases TfR1 partitioning to reticulocytes during enucleation, and enhances enucleation of defective b-thalassemic erythroid precursors. These findings strongly suggest that overexpressed TfR1 may play a regulatory role contributing to iron overload and anemia inb-thalassemic mice. To evaluate further, we crossed TfR11/2mice, themselves exhibiting iron-restricted erythropoiesis with increased hepcidin, withb-thalassemic mice. Resultant double-heterozygote mice demonstrate long-term improvement in ineffective erythropoiesis, hepcidin derepression, and increased erythroid enucleation in relation tob-thalassemic mice. Our data demonstrate for the first time that TfR11/2haploinsufficiency reverses iron overload specifically inb-thalassemic erythroid precursors. Taken together, decreasing TfR1 expression duringb-thalassemic erythropoiesis, either directly via induced haploinsufficiency or via exogenous apotransferrin, decreases ineffective erythropoiesis and provides an endogenous mechanism to upregulate hepcidin, leading to sustained iron-restricted erythropoiesis and preventing systemic iron overload inb-thalassemic mice. (Blood. 2017;129(11):1514-1526)
Introduction
b-Thalassemias result from mutations in the b-globin gene, reducing b-globin synthesis1
and consequently accumulating excessa-globin chains. This pathology leads to increased erythroid precursor apoptosis, causing ineffective erythropoiesis, extramedullary expansion, and splenomegaly, which together with shortened red blood cell (RBC) survival result in anemia.2,3 Normal erythropoiesis leads to the generation of RBCs from multipotent stem cells and involves (1) erythropoietin-sensitive proliferation, (2) differentiation from pro- to orthochromatophilic erythroblasts during iron-dependent hemoglobin synthesis, and (3) enucleation with release and maturation of reticulo-cytes into RBCs. Although the mechanisms involved in enucleation remain elusive, there is general consensus that it is the end result of erythropoiesis, and abnormalities in erythroid differentiation
(eg, ineffective erythropoiesis) are expected to decrease the number of end-terminal erythroblasts available to undergo enucleation.
In addition to ineffective erythropoiesis, patients with moderate or severeb-thalassemia have inappropriately low circulating hepcidin,4,5 the main negative regulator of body ironflows,6-8leading to increased intestinal iron absorption9and iron overload. Mouse models of b-thalassemia also exhibit relatively low hepcidin.10
Lack of appropri-ately increased hepcidin despite increased parenchymal iron stores suggests that a competing signal is counterregulating hepcidin expression,11-13establishingb-thalassemia as an important opportu-nity for evaluating erythroid regulation of hepcidin.14Several factors (eg, growth differentiation factor-15 [GDF-15]) secreted by erythroid precursors13,15-18 have been implicated as pathological hepcidin
Submitted 26 September 2016; accepted 12 January 2017. Prepublished online as Blood First Edition paper, 1 February 2017; DOI 10.1182/blood-2016-09-742387.
The online version of this article contains a data supplement.
The publication costs of this article were defrayed in part by page charge payment. Therefore, and solely to indicate this fact, this article is hereby marked “advertisement” in accordance with 18 USC section 1734. © 2017 by The American Society of Hematology
regulators in b-thalassemia19,20 but are likely not physiological hepcidin regulators in light of their expression remaining unchanged after phlebotomy in mice,21in iron deficiency,22,23in anemia of chronic inflammation,23
and in myeloproliferative diseases.24 Recently, erythroferrone was identified as a physiologic erythroid regulator of hepcidin, found to be increased in bone marrow fromb-thalassemic and phlebotomized wild-type (WT) mice.25Erythroferrone ablation in b-thalassemic mice normalized inappropriately suppressed hepcidin expression.25 Despite high confidence that erythroferrone regulates hepcidin, phlebotomized erythroferrone knockout mice exhibit de-creased hepcidin expression25; furthermore, despite increased hepcidin expression, anemia persists in erythroferrone knockout b-thalassemic mice.26We aim to evaluate in greater detail the molecules involved in iron delivery for erythropoiesis and assess additional mechanisms of hepcidin regulation inb-thalassemic mice.
Erythroid precursors obtain iron via the transferrin cycle. Diferric transferrin binds to transferrin receptor 1 (TfR1),27-29 ultimately recycling apotransferrin (apoTf, transferrin devoid of iron) and TfR1 back to the plasma membrane after iron transport to the cytosol/ mitochondria. TfR1 is characteristically expressed on erythroid precursors, progressively decreasing during erythroid differentiation.30 TfR1 is lost during both enucleation and reticulocyte maturation, the latter a consequence of proteolytic cleavage just external to the transmembrane domain,31leading to soluble TfR1 (sTfR1) circulation in plasma.32TfR1 expression itself is upregulated in iron deficiency33,34 and by increased erythropoiesis,35but its function in erythropoiesis beyond its canonical involvement in cellular iron uptake is in-completely understood. Prior investigation found no regulatory function of sTfR1 on hepcidin36; however, hepcidin expression in
TfR1 heterozygous mice (TfR11/2) is increased despite relative iron deficiency, iron-restricted erythropoiesis, and increased erythroferrone expression.37In light of this paradoxical regulation of hepcidin, we aim to evaluate the effect of decreased TfR1 in regulating ineffective erythropoiesis and iron overload inb-thalassemic mice.
Recent studies investigate mechanisms by which modulating systemic iron influences erythropoiesis. Iron-deficient diet is only partially beneficial in diseases of ineffective erythropoiesis,38
de-creasing liver iron without improving hemoglobin inb-thalassemic mice.38Furthermore, iron chelator deferiprone-treatedb-thalassemic
mice exhibit decreased liver iron with no improvement in erythropoi-esis.39 By contrast, increased hepcidin expression ameliorates in-effective erythropoiesis in b-thalassemic mice,38-40while reversing iron overload; however, transmembrane protease, serine 6 (Tmprss62/2) mice exhibit very low mean corpuscular volume (MCV), leading to extreme iron-restricted erythropoiesis, and Tmprss62/2b-thalassemic mice exhibit increased erythropoietin,41 suggesting that excessive hepcidin upregulation causes iron restriction38and prevents complete reversal of ineffective erythropoiesis. Thus, inducing iron-restricted erythropoiesis by decreasing TfR1 may provide endogenous
mechanisms for increasing hepcidin to maximize benefit for erythropoiesis and iron overload inb-thalassemia.
We previously demonstrated that exogenous apoTf ameliorates ineffective erythropoiesis, reverses anemia, and increases hepcidin expression in Hbbth1/th1 (th1/th1) mice,42a model ofb-thalassemia intermedia. Furthermore, apoTf-treated th1/th1 mice exhibit more iron-restricted erythropoiesis, decreased transferrin saturation,42and less liver iron deposition.43SimilarfindingswereevidentinHbbth3/1(th3/1) mice.44,45 b-Thalassemic humans15 and mice46 exhibit increased sTfR1 concentration; sTfR1 decreased after apoTf treatment in th1/th1 mice,46suggesting the possibility that changes in membrane TfR1, proportional to sTfR1, may be either a cause or a consequence of improved erythropoiesis inb-thalassemia. In this report, we confirm the suppressive effect of apoTf on erythroblast TfR1 expression in vivo and in vitro, independent of erythropoietin- and iron-related signaling. Furthermore, we generate double-heterozygote (TfR11/2crossed with th3/1) mice and demonstrate iron restriction specifically in erythroid precursors, improved erythroid enucleation, and hepcidin derepression in an iron- and erythroferrone-independent manner. These double-heterozygote mice provide compelling evidence that decreased TfR1 expression is central to mitigating defective erythroid enucleation in th3/1 mice. We also demonstrate that hepcidin derepression results in redistribution of iron to macrophages, where iron is less toxic,47
resulting in relatively iron-restricted erythropoiesis and preventing progressive systemic iron overload. Taken together, our data strongly support our hypothesis that decreased TfR1 reverses ineffective erythropoiesis inb-thalassemic mice.
Methods
MiceC57BL6 (WT) andb-thalassemic (th3/1)44mice were originally purchased from Jackson Laboratories. TfR11/2mice48were gifted by Nancy Andrews. All mice were backcrossed onto a C57BL6 background for more than 11 generations. All experiments were conducted using 5-month-old gender-matched mice unless otherwise noted. Progeny of TfR11/2crossed with th3/1 mice were generated to analyze characteristics of“double-heterozygote mice.” All mice were bred and housed in the animal facility under Association for Assessment and Accreditation of Laboratory Animal Care guidelines. Experimental protocols were approved by the Institutional Animal Care and Use Committee. Mice were treated with 10 mg (400 mg/kg/d) of human apoTf (Kamada, Israel) intraperitoneally daily for 20 days and sacrificed on day 3 after the last injection.43Samples were stored at280°C until further analysis.
Bone marrow samples and isolated bone marrow erythroid precursors were used to analyze the effect of TfR1 haploinsufficiency on erythroblasts. Bone marrow erythroid precursors were collected using CD45 beads (ie, CD45-negative cells). Furthermore, embryonic erythrocytes in circulation and fetal liver cells (FLCs) from embryonic day 18.5 (E18.5) were used as supporting evidence Table 1. RBC parameters in double-heterozygote mice reveal a significant increase in RBC number and hemoglobin with a decrease in reticulocyte count, MCV, MCH, and RDW in comparison with th3/1 mice
Hemoglobin (g/dL) RBCs (106cells/mL) Reticulocytes (109cells/L) RDW (%) MCV (fL) MCH (pg)
WT 156 0.7 116 0.4 3136 20 136 0.3 436 1.1 146 0.2 TfR11/2 146 0.3* 136 0.3** 3716 33* 166 0.5*** 366 1.1*** 116 0.2*** th3/1 96 0.2*** 106 0.1* 19586 128*** 366 0.4*** 326 1.2*** 96 0.1*** Double-het 116 0.2††† 136 0.3††† 9456 39††† 246 0.4††† 296 0.5† 86 0.1††
Data represent means6 standard errors of the mean; n 5 8 mice per group. Double-het, double-heterozygote mice.
*P, .05; **P , .01; ***P , .001 vs WT. †P, .05; ††P , .01; †††P , .001 vs th3/1.
A
20um double-het th3/+ WTTfR1+/-B
α-globin STD WT TfR1+/- th3/+ double-het β-globinC
double-het th3/+ WT TfR1+/-0 20 40 60 80 100 0 15 28 42 56 RBC survival (%) ** ** †† †† †† ††** * Time (d) double het th3/+ WT TfR1+/-0.000 0.004 0.008 0.012 0.016 Spleen/body weight (mg/g) ** †† *E
double-het th3/+ WTTfR1+/-D
F
Spleen Liver 200um 100um double-het th3/+ WTTfR1+/-H
double het th3/+ WT TfR1+/-0 500 1000 1500 2000 ** †† Serum erythropoietin (mg/mL) NSG
CD44 FSC WT 14% 69% 105 104 103 102 50 100 150 200 250 (x 1,000) TfR1+/-* 22% 64% 105 104 103 102 50 100 150 200 250 (x 1,000) th3/+ ** ** 105 104 103 102 50 100 150 200 250 (x 1,000) double-het †† †† 105 104 103 102 50 100 150 200 250 (x 1,000) 39% 42% 30% 55% Figure 1.of differences in enucleation among WT, th3/1, and double-heterozygote mice in vivo.
Cell culture
FLCs from E12.5 to E14.5 embryos, when the predominant cell type in the liver was erythroid, were isolated using anti-Ter119 beads49; these experiments provide additional in vitro support to our in vivo experiments. Hepatocytes were isolated from WT mice using two-step liver perfusion50and processed after 24-hour incubation at 37°C in 10% mouse sera.43
Peripheral blood analyses
RBC indices and serum samples were analyzed as previously described.42Serum mouse erythropoietin (Quantikine, R&D Systems), transferrin (Abcam), and hepcidin (Hepcidin-Murine CompeteTM, Intrinsic LifeSciences, LLC, La Jolla, CA) were measured by enzyme-linked immunosorbent assay (ELISA) according to the manufacturer’s instructions. The sandwich ELISA using mouse mono-clonal antibodies against mouse erythroferrone was performed as previously described26; 100 pg/mL was the assay’s lower limit of detection. Integra 800 Automated Clinical Analyzer (Roche Diagnostics, Indianapolis, IN) was used for other circulating iron-related parameters; serum transferrin saturation was measured as a ratio of serum iron to transferrin iron-binding capacity. Images were acquired on the Gel Logic 200 Imaging System with Kodak Molecular Imaging software (version 4.0.4).
Histology and immunohistochemistry
Immunohistochemical staining was performed using anti-TER119 antibodies (eBioscience, San Diego, CA). Images were acquired on a Zeiss Axioskop2 microscope with an AxioCamHRC camera using Plan-Neofluar objec-tives320/0.5 and Axiovision software.
Nonheme iron spectrophotometry
Quantification was performed via the Torrance and Bothwell method.51The absorption was measured at 540 nm by spectrophotometer (Multiskan MCC Microplate Reader, Fisher Scientific).
Flow cytometry
Bone marrow and spleen cells were processed as previously described46,52with minor modifications. FLCs and peripheral blood circulating cells were incubated with SYTO 60 and TER-119 to evaluate enucleation. Nucleated and enucleated cells were identified using SYTO 60 and forward scatter.53,54
Results were acquired and cells collected on a MoFloÒ XDP High-Speed Cell Sorter using Summit Software (Beckman Coulter).
Western blot analysis
Western blot was performed using phosphor extracellular signal-regulated kinase (pErk), Erk, pSmad1/5/8, Smad1, bone morphogenetic protein 2 (BMP2; Novus Biologicals), glyceraldehyde-3-phosphate dehydrogenase (GAPDH; Invitrogen), TfR1 andb-actin (Invitrogen), and TfR2 (gift from Robert Fleming) primary antibodies followed by secondary antibodies (horseradish peroxidase-consjugated; Thermo Scientific). Immunoreactive bands were visualized by enhanced chemiluminescence (Amersham Bioscience, GE Healthcare Life Sciences).
Quantitative real-time PCR
RNA was purified from erythroid precursors and hepatocytes using PureLink RNA Mini Kit (Ambion, Life Technology) and analyzed with SuperScript III Platinum SYBR Green One-Step quantitative real-time (qRT) polymerase chain reaction (PCR) Kit (Invitrogen). BMP2, Bmp6, TfR1, TfR2, Hfe, hepcidin, and erythroferrone messenger RNA (mRNA) levels were detected.25,55,56Primers for BMP2, Bmp6, TfR1, TfR2, Hfe, hepcidin, and erythroferrone were designed and confirmed.25,43 Target gene mRNA concentration was normalized to GAPDH.13,57
Statistics
Data are presented as mean6 standard error of the mean. When multiple comparisons were needed, statistical analysis was performed using one-way analysis of variance with Tukey and Welch’s tests, depending on whether the number of animals was comparable between groups. For comparisons between two groups, we used two-tailed Student paired t test.
Results
Double-heterozygote mice exhibit improved anemia and ineffective erythropoiesis
Double-heterozygote (TfR11/2 crossed with th3/1) mice exhibit increased circulating hemoglobin and RBC count and decreased reticulocyte count and red cell distribution width (RDW) in relation to th3/1 mice (Table 1). In addition, MCV and mean corpuscular hemoglobin (MCH) in double-heterozygote mice are further decreased, indicating relatively iron-restricted erythropoiesis (Table 1). Double-heterozygote mice also reveal improved RBC morphology (Figure 1A), decreaseda-globin precipitation on RBC membranes (Figure 1B), and normalized circulating RBC survival in comparison with th3/1 mice (Figure 1C). Spleen size is significantly reduced (Figure 1D-E) with largely normalized splenic architecture (Figure 1F), decreased proportion of erythroid precursors in the spleen (supplemental Figure 1A, available on the Blood Web site), reversal of extramedullary erythropoiesis in the liver (Figure 1F), and no change in splenic nonheme iron concentration (supplemental Figure 1B). Furthermore, in compar-ison with th3/1, the proportion of bone marrow erythroid precursors is reduced (Figure 1G). No differences in bone marrow erythroid precursor apoptosis or reactive oxygen species are observed between double-heterozygote and th3/1 mice (supple-mental Figure 1C-D). Lastly, double-heterozygote mice exhibit decreased serum erythropoietin concentration in relation to th3/1 mice (Figure 1H), although erythropoietin concentration remains somewhat higher than in WT mice (P 5 .06). These findings demonstrate improved ineffective erythropoiesis in double-heterozygote mice, with a significantly increased proportion of enucleated erythroblasts (Figure 1G).
Figure 1. Improved ineffective erythropoiesis in double-heterozygote mice. (A) Morphology of RBCs in peripheral blood smears (n5 5 mice per group). (B) Deposition of a-globin on RBC membranes as assessed by analyzing proteins derived from RBC membranes using nondenaturing gel analysis. Data are representative of an experiment independently repeated five times. Standard “localization control,” RBC cytoplasmic lysate was run on the gel to identify wherea- and b-globin migrate. (C) RBC survival in circulation from WT, TfR11/2, th3/1, and double-heterozygote mice as measured by the decaying percentage of biotinylated RBCs over time (n 5 4 mice per group). (D) Double-heterozygote mice exhibit smaller spleen size in comparison with th3/1 mice. (E) Statistical analysis of spleen/body weight (n 5 5-6 mice per group). (F) Ter119 immunohistochemistry staining reveals more normal splenic architecture with more surface area devoted to white pulp (Ter119 negative cells) in TfR11/2mice in relation to WT mice and in double-heterozygote mice in relation to th3/1 mice. In addition, Ter119 immunohistochemistry staining of liver sections reveals reversal of extramedullary erythropoiesis (circles) in double-heterozygote mice in relation to th3/1 mice (n 5 4-6 mice per group). (G) Flow cytometry analysis of percentages of bone marrow erythroid precursors (red) and enucleated cells (black) from WT, TfR11/2, th3/1, and double-heterozygote mice as identified by CD44 and forward scatter46,52(n5 4-5 mice per
group). (H) Serum erythropoietin concentration in WT, TfR11/2, th3/1, and double-heterozygote mice (n 5 4-5 mice per group). *P , .05 vs WT mice; **P , .01 vs WT mice; ††P, .01 vs th3/1 mice. Double-het 5 double-heterozygote mice; FSC, forward scatter; NS, not significant; STD, standard.
Increased enucleation in double-heterozygote mice
Erythroid precursor enucleation results in the formation of reticulocytes and extruded nuclei surrounded by a rim of membrane (ie, pyrenocyte). To explore the possibility that TfR1 haploinsufficiency influences enucleation, we evaluated E14.5 embryos at the start of enucleation and demonstrated that th3/1 embryos display fewer enucleated cells in peripheral circulation in relation to WT, partially restored in double-heterozygote embryos (Figure 2A). We also analyze enucleation in vivo in th3/1 E18.5 FLCs.58Enucleation is decreased in th3/1 in relation to WT and normalized in double-heterozygote FLCs (Figure 2B). Furthermore, enucleation of E12.5 to 14.5 th3/1 FLCs (when the majority of FLCs remain nucleated) after 24 hours in vitro49 is significantly decreased (Figure 2C) and partially restored in double-heterozygote FLCs (Figure 2C), suggesting that decreased TfR1 expression restores delayed erythroid enucleation. Our data support the hypothesis that, in light of in vivo and in vitro effects, improved enucleation is evidence of improved ineffective erythropoiesis in b-thalassemic mice as a consequence of TfR1 haploinsufficiency.
Systemic iron restriction, increased hepcidin, and decreased erythroferrone in double-heterozygote mice
Because erythropoiesis results in hepcidin suppression and increased hepcidin decreases circulating iron concentration, we hypothesized that improved erythropoiesis in double-heterozygote mice results in
hepcidin derepression and consequently relative systemic iron re-striction. Consistent with this expectation, double-heterozygote mice exhibit decreased serum iron (Figure 3A), transferrin iron-binding capacity (supplemental Figure 2A), and transferrin concentration (supplemental Figure 2B) in relation to th3/1 mice as well as transferrin saturation (supplemental Figure 2C) in relation to WT mice. Transferrin saturation is a calculated value; if both serum iron and transferrin iron-binding capacity are decreased, as they are in double-heterozygote mice in relation to th3/1 mice, then transferrin saturation remains unchanged. Furthermore, stainable iron in liver sections (Figure 3B) and nonheme liver iron concentration (Figure 3C) decrease in double-heterozygote mice in relation to th3/1 mice, consistent with the reversal of iron overload over time. Despite this, serum hepcidin is increased in double-heterozygote mice in relation to WT mice (Figure 3D).
Prior studies demonstrate that hepcidin expression increases as body iron stores increase in th3/1 mice.5,26We thus evaluated 1-, 5-, and 15-month-old mice. First, we demonstrate statistically increased hepcidin concentration in double-heterozygote mice in relation to th3/1 mice at 1 month of age (Figure 3D). Increased liver iron accumulates in th3/1 mice as they age (Figure 3C), resulting in insufficiently increased hepcidin and insensitivity to iron as measured by hepcidin/liver iron concentration in 15-month-old th3/1 mice (Figure 3E). Second, serum hepcidin concentration increases progressively in double-heterozygote mice with statistically significant differences in relation to WT mice (Figure 3D); no difference exists between WT and th3/1mice at1,5,and
A
double-het th3/+ WTB
WT 51% Syto60 50 102 103 104 105 100 150 FSC-A (x 1,000) 200 250 th3/+ 35% * 50 102 103 104 105 100 150 FSC-A (x 1,000) 200 250 double-het 46% †† 50 102 103 104 105 100 150 FSC-A (x 1,000) 200 250C
WT Syto60 48% 50 102 103 104 105 100 150 FSC-A (x 1,000) 200 250 double-het 40% † 50 102 103 104 105 100 150 FSC-A (x 1,000) 200 250 th3/+ 36% * 50 102 103 104 105 100 150 FSC-A (x 1,000) 200 250Figure 2. Increased enucleation in vivo and in vitro in double-heterozygote fetal liver cells. (A) Peripheral smears with nucleated and enucleated (arrow) erythrocytes from WT, th3/1, and double-heterozygote E14.5 embryos. (B) Flow cytometry analysis of nucleated and enucleated (circles; SYTO360 low cells53,54) E18.5 fetal liver cells in
vivo. (C) Flow cytometry analysis of nucleated and enucle-ated (circles; SYTO360 low cells53,54) E12.5 to E14.5 WT,
th3/1, and double-heterozygote fetal liver cells in vitro (n 5 3–5 mice per group). *P, .05 vs WT mice; †P , .05 vs th3/1 mice; ††P, .01 vs th3/1 mice.
15 months. Consequently, unlike those in th3/1 mice, iron stores do not increase in double-heterozygote mice as they age (Figure 3C), suggesting both that increased hepcidin prevents progressive iron accumulation and that hepcidin regulation is independent of systemic iron in double-heterozygote mice. Lastly, the effect of TfR1 haploinsufficiency on hematologic parameters is sustained in 15-month-old th3/1 mice (Table 2), further suggesting that progressive increase in serum hepcidin concentration is independent of systemic iron (Figure 3E).
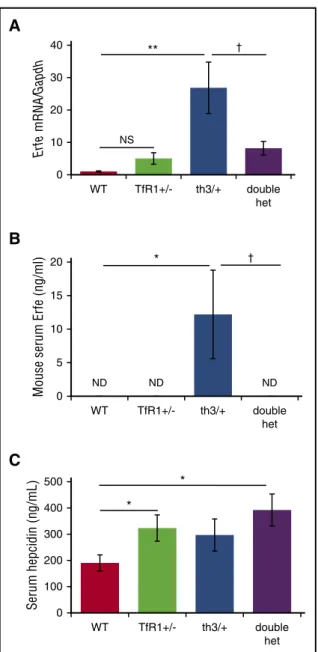
To further evaluate whether increased hepcidin is a consequence of a circulating factor, we treated WT hepatocytes in vitro with serum from WT, th3/1, and double-heterozygote mice. Hepcidin mRNA expres-sion was significantly increased in response to serum from double-heterozygote mice in relation to th3/1 mice (Figure 3F). Because erythroferrone suppresses hepcidin in th3/1 mice,25we postulate that increased hepcidin resulted from decreased erythroferrone in double-heterozygote mice. Our data demonstrate that erythroferrone mRNA expression and serum concentration are increased in th3/1 mice in comparison with WT mice, but significantly reduced (Figure 4A) and undetectable (Figure 4B) in double-heterozygote mice. Because erythroferrone functions as a hormone,25we emphasize the importance of serum erythroferrone concentration rather than its mRNA expres-sion. Furthermore, when analyzed concurrently with serum hepcidin concentration, increased hepcidin in TfR11/2mice in relation to WT mice does not reflect changes in erythroferrone, and decreased erythroferrone in double-heterozygote mice in relation to th3/1 mice does not result in significantly increased hepcidin concentration (Figure 4C). Lastly, no difference in GDF-15 mRNA expression is observed in double-heterozygote erythroblasts in relation to th3/1 erythroblasts (supplemental Figure 3).
Furthermore, because serum iron is decreased in double-heterozygote mice in relation to WT mice (Figure 3A) with significantly decreased spleen size, serum erythropoietin, and erythroferrone expression (Figures 1D-E,H, 4A-B), we anticipated that the dominant iron signal would decrease hepcidin expression in double-heterozygote mice. We thus pro-pose that counterintuitively increased hepcidin in double-heterozygote mice in comparison with th3/1 mice (Figure 3D-E) is a consequence of TfR1 haploinsufficiency or other yet unknown (nonerythroferrone related) erythroid regulators of hepcidin.
No change in hepatocyte TfR2 and Hfe expression or BMP/Smad and Mek/Erk signaling in double-heterozygote mice
Because our analysis of double-heterozygote mice indicates a potential novel mechanism of hepcidin regulation by the erythron and erythroid regulation of hepcidin is incompletely understood, we interrogate known iron-related signaling pathways, through cell surface TfR2, Hfe, and BMP receptor via BMP/Smad or Mek/Erk signaling pathways, in hepatocytes.59-62TfR2 and Hfe increase hepcidin ex-pression in response to systemic iron59,60through parallel pathways involving Mek/Erk1/2 and Smad1/5/8.63
Hfe and TfR2 mRNA expression (supplemental Figure 4A) and TfR2 protein concentration (supplemental Figure 4B-C) are no different in isolate hepatocytes from WT, TfR11/2, th3/1, and double-heterozygote mice. Further-more, signaling through Mek/Erk (supplemental Figure 4B,D) and Smad pathways (supplemental Figure 4E-F) are unchanged in double-heterozygote hepatocytes in comparison with th3/1 hepatocytes. Lastly, no changes in BMP2 mRNA expression (supplemental Figure 5A) and protein concentration (supplemental Figure 5B-C)
B
A
0 40 80 120 160 WT th3/+ double het Serum iron (ug/dL)** ††
D
0 500 1000 15001 month 5 months 15 months WT th3/+ double-het Serum hepcidin (ng/mL) †† * * NS NS 50 µm double-het th3/+ WT
C
0.0 0.5 1.0 1.5 2.01 month 5 months 15 months WT th3/+ double-het Non-heme liver iron (mg/g weight) ** † † * * 0 2 4 6 WT th3/+ double het P=0.04 Hepcidin mRNA/ Gapdh
F
E
0 1 2 31 months 5 months 15 months
Hepcidin/LIC (ug/ml)/(mg/g weight) WT th3/+ double-het † †† † * *
Figure 3. Increased hepcidin despite relative iron restriction in double-heterozygote mice. (A) Serum iron concentration (n5 4-6 mice per group) and (B) Prussian blue staining of liver samples (n5 3-4 mice per group) in WT, th3/1, and double-heterozygote mice. Nonheme liver iron (C), serum hepcidin (D), and hepcidin/liver iron (E) concentrations in 1-month-old mice (n5 3-4 per group), 5-month-old mice (n 5 4-8 per group), and 15-month-old mice (n 5 3-4 per group) in WT, th3/1, double-heterozygote mice. (F) Hepcidin mRNA in WT hepatocytes exposed in vitro to sera from WT, th3/1, and double-heterozygote mice (n 5 5-7 mice per group). *P , .05; **P , .01 vs WT mice; †P, .05; ††P , .01 vs th3/1 mice. LIC, liver iron concentration.
or Bmp6 expression in relation to liver iron concentration (supplemental Figure 5D) are evident in isolate hepatocytes from double-heterozygote mice in relation to th3/1 mice. These findings suggest that TfR1 haploinsufficiency regulates hepcidin indepen-dently of BMP/Smad and Mek/Erk signaling pathways and TfR2 or Hfe expression in th3/1 mice.
Double-heterozygote mice exhibit iron-restricted erythropoiesis and shift of iron contents between bone marrow
cell populations
We have previously shown that nonheme iron is decreased in th1/th1 mice bone marrow despite systemic iron overload.64As our current data reveal, this is also true of th3/1 mice, and nonheme iron remains unchanged in double-heterozygote mice in comparison with th3/1 mice (Figure 5A). We hypothesized that TfR1 haploinsufficiency results in disproportionally decreased iron uptake by erythroid precursors. To test this, we separated bone marrow samples into CD45-negative cells, an erythroid-enriched population,46and nonerythroid (CD45-positive) cells. Our results demonstrate that TfR11/2and th3/1 erythroid precursors have less nonheme iron than do WT (Figure 5B-C), and double-heterozygote erythroid precursors exhibit a further decrease in nonheme iron in relation to th3/1 (Figure 5C). Furthermore, in comparison with WT mice, th3/1 mice exhibit decreased bone marrow and erythroid precursor nonheme iron (Figure 5A-C), the latter normalized in double-heterozygote mice (Figure 5C). Lastly, we demonstrate that although nonheme iron concentration is further decreased in double-heterozygote erythroid precursors, it is increased in CD45-positive cells (Figure 5C). Our data strongly suggest that TfR1 haploinsufficiency disproportion-ally influences erythroid precursor iron concentration, redistributing iron from erythroid precursors to other cell types (eg, macrophages) within the bone marrow. In light of these results, we hypothesized that apotransferrin improves erythropoiesis inb-thalassemic mice42,43 by downregulating erythroid precursor TfR1 expression.
Apotransferrin enhances loss of reticulocyte TfR1 during enucleation, improves enucleation, and reduces TfR1 expression inb-thalassemic erythroid precursors independently of signaling via erythropoietin
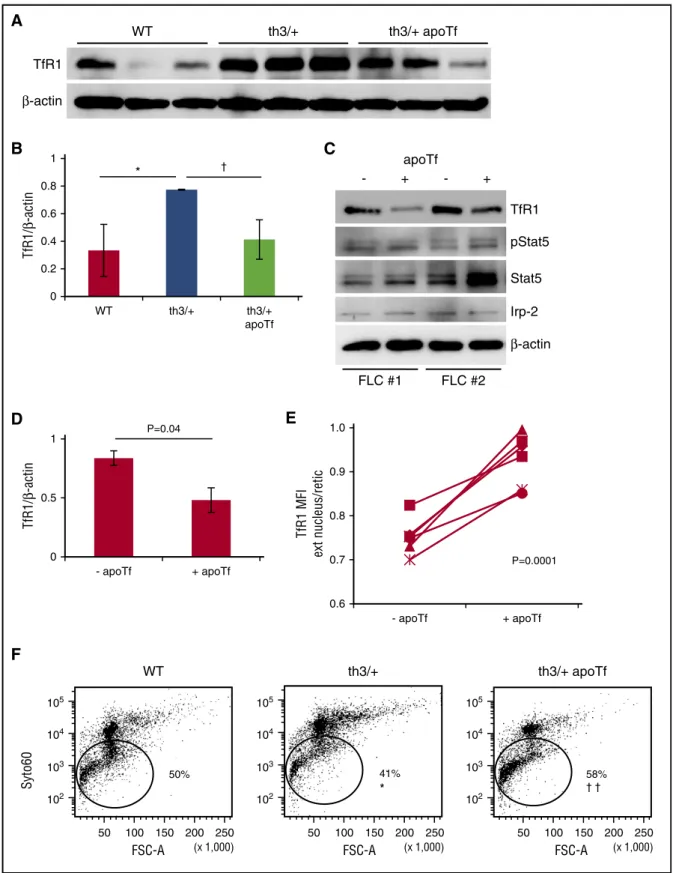
Similar to TfR1 haploinsufficiency, exogenous apoTf reverses in-effective erythropoiesis inb-thalassemic mice.42,43,45 In vivo, both TfR1 mRNA and protein expression in erythroid precursors are significantly increased in th3/1 mice in comparison with WT mice (Figure 6A-B; supplemental Figure 6A). Furthermore, because TfR1 is regulated by iron status via the binding of Irp2 at the 39 transcript, leading to TfR1 mRNA stabilization and increased translation during iron deficiency, we expected apoTf-induced iron-restricted erythropoi-esis to further increase TfR1 expression.65Despite this, exogenous apoTf reduced erythroid precursor TfR1 concentration without changing mRNA expression (Figure 6A-B; supplemental Figure 6A). We thus postulated that decreased erythroid precursor TfR1 expression in apoTf-treatedb-thalassemic mice is a consequence of decreased erythropoietin (Figure 1H) and Stat5 signaling, known to transcrip-tionally regulate TfR1.35,66To test this, we evaluate in vitro apoTf-treated FLCs and demonstrate decreased TfR1 mRNA and protein concentration without changes in Stat5 signaling or Irp-2 concentration (Figure 6C-D; supplemental Figure 6B-D), suggesting that apoTf has a direct effect on decreasing TfR1 expression in erythroid precursors.
Table 2. RBC parameters in 15-month-old double-heterozygote mice reveal a significant increase in RBC number and hemoglobin with a decrease in reticulocyte count and RDW in comparison with th3/1 mice
Hemoglobin (g/dL) RBCs (106cells/mL) Reticulocytes (109cells/L) RDW (%) MCV (fL) MCH (pg)
th3/1 76 0.3 86 0.2 15446 64 366 0.2 386 1.4 86 0.1 Double-het 106 0.3*** 126 0.4*** 9656 113*** 276 1.9** 356 0.4 86 0.1
Data represent means6 standard errors of the mean; n 5 3–4 mice per group. Double-het, double-heterozygote mice.
**P, .01; ***P , .001 vs th3/1 mice. 0 10 20 30 40 WT TfR1+/- th3/+ double het Er fe mRNA/ Gapdh ** † NS
A
B
ND ND ND 0 5 10 15 20 WT TfR1+/- th3/+ double het Mouse serum Er fe (ng/ml) * †C
0 100 200 300 400 500 WT TfR1+/- th3/+ double het Serum hepcidin (ng/mL) * *Figure 4. Significantly decreased erythroferrone in double-heterozygote mice. (A) Erythroferrone mRNA expression in erythroid-enriched bone marrow from WT, TfR11/2, th3/1, and double-heterozygote mice (n 5 3-6 mice per group). Concurrently assessed serum erythroferrone (B) and hepcidin (C) concentrations in WT, TfR11/2, th3/1, and double-heterozygote mice (n 5 5-6 mice per group). *P , .05; **P, .01 vs WT mice; †P , .05 vs th3/1 mice. ND, not detected.
To explore the possibility that apoTf decreases partitioning of TfR1 to reticulocytes during enucleation, we evaluated the effect of apoTf on E12.5 to E14.5 FLCs in vitro. Our data demonstrate that the ratio of membrane TfR1 on extruded nuclei and reticulocytes is significantly increased in apoTf-treated th3/1 FLCs (Figure 6E). Furthermore, our results demonstrate increased enucleation in apoTf-treated E12.5 th3/1 FLCs (Figure 6F). Taken together, these results provide evidence that exogenous apoTf alters TfR1 expression, is associated with decreased partitioning of TfR1 to reticulocytes, and correlates with improved enucleation of th3/1 erythroid precursors.
Discussion
Because transferrin-bound iron uptake via TfR1 is the major source of iron for erythropoiesis, we hypothesized that exogenous apoTf operates by decreasing TfR1 in erythroid precursors to compensate for ineffective erythropoiesis inb-thalassemic mice. We developed a mouse model with TfR1 haploinsufficiency in b-thalassemic mice and demonstrate that these double-heterozygote mice alleviate anemia by reversing ineffective erythropoiesis and promoting enucleation. Furthermore, TfR1 haploinsufficiency derepresses hepcidin, resulting in reversal of iron overload, redistributing iron from erythroid precursors to bone marrow CD45-positive cells (ie, macrophages). Lastly, we demonstrate that apoTf decreases TfR1 partitioning to
reticulocytes during enucleation, improving erythroid enucleation, and suppresses TfR1 inb-thalassemic FLCs independently of erythropoi-etin, Stat5 signaling, and regulation by Irp-2. Taken together, our results suggest that decreased TfR1 expression during erythroid differentiation is a novel potential target to ameliorate ineffective erythropoiesis, derepress hepcidin, and reverse iron overload inb-thalassemia.
We inadvertently examined the effects of decreasing TfR1 expression in apoTf-treatedb-thalassemic mice42,45with reversal of ineffective erythropoiesis.42We anticipate that iron-restricted erythro-poiesis is a central underlying mechanism for these observations. Accordingly, we demonstrate decreased transferrin saturation, MCV, and MCH in apoTf-treated b-thalassemic mice42,45 and decreased cellular iron and heme concentrations in apoTf-treated mouse erythroleukemia (MEL) cells (supplemental Figure 7). Why cellular iron concentration is decreased in th3/1 precursors in relation to WT erythroid precursors remains incompletely understood, but we hypothesize that the increased number of b-thalassemic erythroid precursors limit iron availability per cell and, in conjunction with increased serum erythropoietin concentration, result in increased TfR1 expression in vivo. The effects of transferrin treatment and TfR1 haploinsufficiency on b-thalassemic mice thus provide evidence of an additional mechanism for increasing hepcidin by erythroid regulation, not a direct effect of hepcidin expression that results in iron restriction and improves erythropoiesis as a secondary effect.38,40,41
B
0 0.5 1 WT TfR1+/-P=0.01Non-heme iron (mg/g weight)
CD45-negative 0 10 20 30 WT TfR1+/-CD45-positive
C
Non-heme iron (mg/g weight) 0 0.5 1 WT th3/+ double het †† * CD45-negative CD45-positive 0 10 20 WT th3/+ double het † **
A
0.0 0.5 1.0 1.5 2.0 WT TfR1+/- th3/+ double hetNon-heme bone marrow
iron (mg/g weight)
** **
NS NS
Figure 5. Changes in bone marrow iron distribution associated with TfR1 haploinsufficiency. (A) Bone marrow nonheme iron concentration in WT, TfR11/2, th3/1, and double-heterozygote mice (n 5 4-6 mice per group). Bone marrow CD45 negative cells (erythroid precursor enriched population) in WT and TfR11/2mice (n5 4-6 mice per group) (B) as well as th3/1 and double-heterozygote mice (n5 4-6 mice per group) (C). *P , .05; **P , .01 vs WT mice; †P, .05; ††P , .01 vs th3/1 mice.
In addition, we surmise that due to excess TfR1 inb-thalassemic precursors in relation to WT erythroid precursors, TfR1 haploinsuffi-ciency induces further iron-restricted erythropoiesis inb-thalassemic
mice. We hypothesize that both exogenous apoTf and TfR1 haploinsufficiency result in decreased a-globin production and precipitation on RBC membranes,42enabling heat shock protein 70
A
WT th3/+ th3/+ apoTf TfR1 β-actin WT 105 104 102 103 50 100 150 200 250 FSC-A (x 1,000) 50% Syto60F
th3/+ 105 104 102 103 50 100 150 200 250 FSC-A (x 1,000) 41% * th3/+ apoTf 105 104 102 103 50 100 150 200 250 FSC-A (x 1,000) 58% † †B
0 0.2 0.4 0.6 0.8 1 WT th3/+ th3/+ apoTf * † TfR1/ β -actin FLC #1 FLC #2 - + - + apoTf TfR1 pStat5 Stat5 β-actin Irp-2C
D
0 0.5 1 - apoTf + apoTf P=0.04 TfR1/ β -actinE
0.6 0.7 0.8 0.9 1.0 - apoTf + apoTf TfR1 MFI ext nucleus/retic P=0.0001Figure 6. Apotransferrin decreases TfR1 and enhances enucleation inb-thalassemic erythroid precursors. (A) Protein concentration for TfR1 in CD45 negative bone marrow cells from WT, th3/1, and apotransferrin treated th3/1 mice. (B) Statistical analysis of TfR1/b-actin (n 5 4-5 mice per group). (C) Protein expression of TfR1, pStat5, Stat5, Irp-2, andb-actin in fetal liver cells treated with apotransferrin in vitro (experiment repeated twice). (D) Statistical analysis of TfR1/b-actin in fetal liver cells treated with apoTf in vitro. (E) Proportion of TfR1 on extruded nuclei in relation to reticulocytes during in vitro enucleation of th3/1 fetal liver cells with and without additional apotransferrin (n5 6 pups per group). (F) Erythroid enucleation in WT, th3/1, and apotransferrin-treated th3/1 fetal liver cells (n 5 3-4 pups per group). *P , .05; **P , .01 vs WT mice; †P, .05; ††P , .01 vs th3/1 mice. Ext nucleus, extruded nucleus; retic, reticulocyte; MFI, mean fluorescence index.
translocation into the nucleus to prevent GATA-1 cleavage by caspase-3,67 and restore terminal erythropoiesis in b-thalassemic mice. Consequently, double-heterozygote mice and apoTf-treated b-thalassemic42,43
mice exhibit decreased splenomegaly and erythroferrone, the latter derepressing hepcidin and preventing reversal of iron-restricted erythropoiesis by inhibiting iron absorption and sequestering iron in macrophages (Figure 7). We postulate that improved RBC survival in double-heterozygote mice results from decreased splenomegaly (Figure 1D-E) as in apoTf-treated in b-thalassemic mice.42
Inb-thalassemia, the enlarged spleen is the site for extramedullary erythropoiesis, serving as a reservoir for erythroid precursors that cannot undergo apoptosis (due to elevated erythropoi-etin concentration) or differentiation (due to ineffective erythropoie-sis). Both exogenous apotransferrin and TfR1 haploinsufficiency decrease extramedullary erythropoiesis, and thus splenomegaly, which in turn results in decreased serum erythropoietin concentrations. Additional experiments are required to fully elucidate this effect.
Although iron restriction by multiple means has been assessed previously, neither iron-restricted diet nor iron chelation reverse ineffective erythropoiesis inb-thalassemic mice despite a measurable
decrease in liver iron overload. Several interpretations are possible. First, iron-deficient diet leads to transient iron-restricted erythropoiesis; however, because hepcidin is suppressed,38,68the effect on erythro-poiesis is not as robust as other means of inducing iron-restricted erythropoiesis. In addition, systemic iron deficiency results in TfR1 upregulation, counteracting iron-restricted erythropoiesis by increasing iron uptake in erythroid precursors.69,70Iron chelation, on the other hand, causes increased hepcidin expression,39,68changing the distri-bution of iron by moving it out of parenchymal cells and loading it onto circulation transferrin. Why it has no effect on erythropoiesis is unclear, but several possibilities exist. First, lack of effect on erythropoiesis may be a consequence of the dose used. Also, hepcidin may be insufficiently increased, or increased hepcidin may take time to enable an observable iron-restricted erythropoiesis; however, as systemic iron overload decreases, hepcidin expression is also likely to decrease, enhancing iron absorption and recycling. Our models predict that iron-restricted erythropoiesis as a consequence of exogenous apotransferrin or TfR1 haploinsufficiency with increased hepcidin expression is essential to ameliorate ineffective erythropoiesis inb-thalassemia (Figure 7). thal apoTf-tr e at ed thal TfR1 haplo-insufficien t thal hepcidin macrophage ERFE erythroblast hepcidin ERFE ERFE TfR1 FPN1 Fe Fe-Tf hepcidin
Figure 7. Proposed working model of iron-restricted erythropoiesis in apotransferrin-treated and TfR1 haploinsufficient b-thalassemic mice. Both TfR1 haploinsufficiency and exogenous apoTf result in de-creased cellular iron in erythroid precursors, leading to decreased splenomegaly and ineffective erythropoiesis, which in turn causes decreased erythroferrone and hepdicin derepression. Increased hepcidin provides positive feedback to sustain iron-restricted erythro-poiesis by preventing increased iron absorption and locking recycled iron within macrophages. ERFE, erythroferrone; Fe, iron; Fe-Tf, transferrin-bound iron; FPN1, ferroportin 1; thal,b-thalassemia.
Induction of TfR1 expression during erythroid differentiation is incompletely understood. Although iron is known to negatively modulate TfR1 expression in nonerythroid cells,69,71,72iron concen-tration in hemoglobin-synthesizing cells only mildly alters TfR1 expression.70 More recent data demonstrate that Stat5 signaling is required for expression of Irp-2, itself the major TfR1 transcriptional regulator in erythroid precursors.66Thus, erythroid precursor TfR1 expression is decreased in apoTf-treatedb-thalassemic mice because iron-restricted erythropoiesis reverses ineffective erythropoiesis and provides feedback to decrease erythropoietin. Consequently, decreased erythropoietin results in decreased Stat5 signaling and TfR1 expres-sion,66providing a rationale for decreased TfR1 expression in apoTf-treated mice; however, apoTf added in vitro also results in decreased TfR1 expression inb-thalassemic erythroid precursors, in the absence of changes in erythropoietin, Stat5 signaling, and Irp-2 expression, suggesting that apoTf directly influences TfR1 expression, independent of these factors. Taken together, the current study demonstrates the central regulatory role of TfR1 in iron-loading anemias. Although additional experiments are required to fully elucidate this complicated set of interactions and their effects on enucleation, we anticipate that exogenous apotransferrin and TfR1 haploinsufficiency significantly improve erythroid differentiation, most clearly visible in the proportion of enucleated erythroblasts. In other words, because b-thalassemic mice exhibit expanded erythropoiesis, improved erythroid differentiation could result in a larger proportion of enucleating erythroblasts than even in WT mice. Although TfR1 haploinsufficiency is decreased systemically in double-heterozygote mice, the disproportionately high concentration of TfR1 on erythroblasts (in relation to other cell types) causes their particular vulnerability in the haploinsufficient condition, strongly suggesting that the observed effects are a consequence of haploinsufficient TfR1, specifically in erythroid precursors.
With the discovery of erythroferrone, hepcidin regulation by erythropoiesis has recently received renewed attention.25,26In light of the systemic iron restriction without decrease in erythroferrone, we propose that increased hepcidin in TfR11/2mice cannot be explained without postulating an alternative hypothesis for hepcidin regulation.37 This prior evaluation in hematopoiesis-specific TfR1 haploinsufficient mice following bone marrow transplant further enhanced the effect on hepcidin upregulation.37We anticipate equivalent results using double-heterozygote bone marrow as a source of hematopoietic cells.
Patients withb-thalassemia exhibit varying degrees of ineffective erythropoiesis and iron overload. Recently, expanded knowledge of disease modifiers has focused attention on manipulating mechanisms to reverse ineffective erythropoiesis. Several sources suggest that increasing hepcidin concentration is key to improving disease severity; however, the appropriate hepcidin concentration is individualized, and an excessive increase results in iron deficiency, preventing complete reversal of ineffective erythropoiesis. We set out to explore indirect means of increasing hepcidin in vivo to enable individualized self-regulation of hepcidin and demonstrate improved ineffective erythro-poiesis and iron overload inb-thalassemic mice using multiple means of decreasing TfR1 expression. On the basis of our results in b-thalassemic mice, we suggest that apoTf is an important potential therapeutic alternative, most obviously for patients withb-thalassemia but also other diseases in which hepcidin is suppressed by expanded
erythropoiesis with upregulation of TfR1. In these circumstances, exogenous apoTf could reverse ineffective erythropoiesis by suppressing TfR1 expression to, in parallel, induce iron-restricted erythropoiesis, derepressing hepcidin, and prevent systemic iron overload. Because upregulation of TfR1 is observed in other diseases of ineffective erythropoiesis with concurrent anemia and iron overload,73we propose that TfR1 antagonists would be rational and apparent therapeutic targets, potentially useful to improve erythropoiesis and derepress hepcidin, simultaneously reducing RBC transfusion requirements and preventing/ reversing iron overload. A new treatment approach would greatly benefit this patient population, for whom standard management over the last half-century has consisted of transfusion followed by chelation therapy.
Acknowledgments
TfR11/2 mice were generously gifted by Nancy Andrews. The authors extend special thanks to Jacobi Medical Center for sample analysis; Elizabeta Nemeth, Janis Abkowitz, and Merav Socolovsky for stimulating discussions; and Tomas Ganz for unparalleled guidance and support. The authors also sincerely appreciate the efforts of Tomas Ganz and Elizabeta Nemeth in measuring serum erythroferrone concentration using a novel noncommercially avail-able ELISA developed in their laboratories.
This work was supported by the National Institutes of Health, National Heart, Lung, and Blood Institute (HL105682) (Y.Z.G.), by the National Institutes of Health, National Institute of Diabetes and Digestive and Kidney Diseases (DK095112 to Y.Z.G., S.R., and R.F.; and DK107670 to Y.Z.G.), and by New York Blood Center funding to the Erythropoiesis Laboratory.
Authorship
Contribution: H.L., T.C., W.B., M.F., and D.G.-S. performed experiments and analyzed results; H.C., J. Li, S.S., A.F., P. Pham, J. Liu, J.Z., and P. Ponka provided experimental support; X.A., N.M., R.E.F., S.R., and G.L. assisted with experiment design; H.L. and Y.Z.G. designed research, analyzed results, and drafted the initial version of the manuscript; and H.L., T.C., W.B., H.C., M.F., D.G.-S., J. Li, S.S., A.F., P. Pham, J. Liu, J.Z., P. Ponka, X.A., N.M., R.E.F., S.R., G.L., and Y.Z.G. edited the manuscript.
Conflict-of-interest disclosure: S.R. has restricted stocks in Merganser Biotech and is a member of the scientific advisory board of Meira GTx, Merganser Biotech, and Ionis Pharmaceuticals. R.E.F. has served on the scientific advisory board for Protagonist, a biotechnology company developing products to manipulate the hepcidin-ferroportin axis. The remaining authors declare no competingfinancial interests.
Correspondence: Yelena Z. Ginzburg, Division of Hematol-ogy and Medical OncolHematol-ogy, Icahn School of Medicine at Mount Sinai, 1 Gustave L. Levy Pl, P.O. Box 1079, New York, NY 10029; e-mail: [email protected].
References
1. Weatherall DJ. Pathophysiology of thalassaemia. Baillieres Clin Haematol. 1998;11(1):127-146. 2. Pootrakul P, Kitcharoen K, Yansukon P, et al. The
effect of erythroid hyperplasia on iron balance. Blood. 1988;71(4):1124-1129.
3. Centis F, Tabellini L, Lucarelli G, et al. The importance of erythroid expansion in determining the extent of apoptosis in erythroid precursors in patients with beta-thalassemia major. Blood. 2000;96(10):3624-3629.
4. Raja KB, Simpson RJ, Peters TJ. Intestinal iron absorption studies in mouse models of iron-overload. Br J Haematol. 1994;86(1):156-162. 5. Gardenghi S, Marongiu MF, Ramos P, et al.
is characterized by increased iron absorption mediated by down-regulation of hepcidin and up-regulation of ferroportin. Blood. 2007; 109(11):5027-5035.
6. Park CH, Valore EV, Waring AJ, Ganz T. Hepcidin, a urinary antimicrobial peptide synthesized in the liver. J Biol Chem. 2001; 276(11):7806-7810.
7. Krause A, Neitz S, M ¨agert HJ, et al. LEAP-1, a novel highly disulfide-bonded human peptide, exhibits antimicrobial activity. FEBS Lett. 2000; 480(2-3):147-150.
8. Ganz T. Hepcidin—a regulator of intestinal iron absorption and iron recycling by macrophages. Best Pract Res Clin Haematol. 2005;18(2): 171-182.
9. Pippard MJ, Callender ST, Warner GT, Weatherall DJ. Iron absorption and loading in beta-thalassaemia intermedia. Lancet. 1979; 2(8147):819-821.
10. Adamsky K, Weizer O, Amariglio N, et al. Decreased hepcidin mRNA expression in thalassemic mice. Br J Haematol. 2004;124(1): 123-124.
11. Finch C. Regulators of iron balance in humans. Blood. 1994;84(6):1697-1702.
12. Kattamis A, Papassotiriou I, Palaiologou D, et al. The effects of erythropoetic activity and iron burden on hepcidin expression in patients with thalassemia major. Haematologica. 2006;91(6): 809-812.
13. Vokurka M, Krijt J, Sulc K, Necas E. Hepcidin mRNA levels in mouse liver respond to inhibition of erythropoiesis. Physiol Res. 2006;55(6): 667-674.
14. De Franceschi L, Daraio F, Filippini A, et al. Liver expression of hepcidin and other iron genes in two mouse models of beta-thalassemia.
Haematologica. 2006;91(10):1336-1342. 15. Origa R, Galanello R, Ganz T, et al. Liver iron
concentrations and urinary hepcidin in beta-thalassemia. Haematologica. 2007;92(5): 583-588.
16. Weizer-Stern O, Adamsky K, Amariglio N, et al. Downregulation of hepcidin and haemojuvelin expression in the hepatocyte cell-line HepG2 induced by thalassaemic sera. Br J Haematol. 2006;135(1):129-138.
17. Kearney SL, Nemeth E, Neufeld EJ, et al. Urinary hepcidin in congenital chronic anemias. Pediatr Blood Cancer. 2007;48(1):57-63.
18. Kemna EH, Kartikasari AE, van Tits LJ, Pickkers P, Tjalsma H, Swinkels DW. Regulation of hepcidin: insights from biochemical analyses on human serum samples. Blood Cells Mol Dis. 2008;40(3):339-346.
19. Tanno T, Bhanu NV, Oneal PA, et al. High levels of GDF15 in thalassemia suppress expression of the iron regulatory protein hepcidin. Nat Med. 2007;13(9):1096-1101.
20. Tanno T, Porayette P, Sripichai O, et al. Identification of TWSG1 as a second novel erythroid regulator of hepcidin expression in murine and human cells. Blood. 2009;114(1): 181-186.
21. Casanovas G, Vuji´c Spasic M, Casu C, et al. The murine growth differentiation factor 15 is not essential for systemic iron homeostasis in phlebotomized mice. Haematologica. 2013;98(3): 444-447.
22. Tanno T, Rabel A, Lee YT, Yau YY, Leitman SF, Miller JL. Expression of growth differentiation factor 15 is not elevated in individuals with iron deficiency secondary to volunteer blood donation. Transfusion. 2010;50(7):1532-1535.
23. Theurl I, Finkenstedt A, Schroll A, et al. Growth differentiation factor 15 in anaemia of chronic
disease, iron deficiency anaemia and mixed type anaemia. Br J Haematol. 2010;148(3):449-455. 24. Tarkun P, Mehtap O, Ateso ˘glu EB, Geduk A,
Musul MM, Hacihanefioglu A. Serum hepcidin and growth differentiation factor-15 (GDF-15) levels in polycythemia vera and essential thrombocythemia. Eur J Haematol. 2013; 91(3):228-235.
25. Kautz L, Jung G, Valore EV, Rivella S, Nemeth E, Ganz T. Identification of erythroferrone as an erythroid regulator of iron metabolism. Nat Genet. 2014;46(7):678-684.
26. Kautz L, Jung G, Du X, et al. Erythroferrone contributes to hepcidin suppression and iron overload in a mouse model ofb-thalassemia. Blood. 2015;126(17):2031-2037.
27. Richardson DR, Ponka P. The molecular mechanisms of the metabolism and transport of iron in normal and neoplastic cells. Biochim Biophys Acta. 1997;1331(1):1-40. 28. van Renswoude J, Bridges KR, Harford JB,
Klausner RD. Receptor-mediated endocytosis of transferrin and the uptake of fe in K562 cells: identification of a nonlysosomal acidic compartment. Proc Natl Acad Sci USA. 1982; 79(20):6186-6190.
29. Huebers HA, Finch CA. The physiology of transferrin and transferrin receptors. Physiol Rev. 1987;67(2):520-582.
30. Iacopetta BJ, Morgan EH, Yeoh GC. Transferrin receptors and iron uptake during erythroid cell development. Biochim Biophys Acta. 1982; 687(2):204-210.
31. Ahn J, Johnstone RM. Origin of a soluble truncated transferrin receptor. Blood. 1993;81(9): 2442-2451.
32. Pan BT, Johnstone RM. Fate of the transferrin receptor during maturation of sheep reticulocytes in vitro: selective externalization of the receptor. Cell. 1983;33(3):967-978.
33. Hentze MW, Muckenthaler MU, Andrews NC. Balancing acts: molecular control of mammalian iron metabolism. Cell. 2004;117(3):285-297. 34. Schranzhofer M, Schifrer M, Cabrera JA, et al.
Remodeling the regulation of iron metabolism during erythroid differentiation to ensure efficient heme biosynthesis. Blood. 2006;107(10): 4159-4167.
35. Zhu BM, McLaughlin SK, Na R, et al. Hematopoietic-specific Stat5-null mice display microcytic hypochromic anemia associated with reduced transferrin receptor gene expression. Blood. 2008;112(5):2071-2080.
36. Flanagan JM, Peng H, Wang L, et al. Soluble transferrin receptor-1 levels in mice do not affect iron absorption. Acta Haematol. 2006;116(4): 249-254.
37. Keel SB, Doty R, Liu L, et al. Evidence that the expression of transferrin receptor 1 on erythroid marrow cells mediates hepcidin suppression in the liver. Exp Hematol. 2015;43(6):469-78.e6. 38. Gardenghi S, Ramos P, Marongiu MF, et al.
Hepcidin as a therapeutic tool to limit iron overload and improve anemia inb-thalassemic mice. J Clin Invest. 2010;120(12):4466-4477. 39. Casu C, Aghajan M, Oikonomidou PR, Guo S,
Monia BP, Rivella S. Combination of Tmprss6-ASO and the iron chelator deferiprone improves erythropoiesis and reduces iron overload in a mouse model of beta-thalassemia intermedia. Haematologica. 2016;101(1):e8-e11. 40. Guo S, Casu C, Gardenghi S, et al. Reducing
TMPRSS6 ameliorates hemochromatosis and b-thalassemia in mice. J Clin Invest. 2013;123(4): 1531-1541.
41. Nai A, Pagani A, Mandelli G, et al. Deletion of TMPRSS6 attenuates the phenotype in a mouse
model ofb-thalassemia. Blood. 2012;119(21): 5021-5029.
42. Li H, Rybicki AC, Suzuka SM, et al. Transferrin therapy ameliorates disease in beta-thalassemic mice. Nat Med. 2010;16(2):177-182.
43. Chen H, Choesang T, Li H, et al. Increased hepcidin in transferrin-treated thalassemic mice correlates with decreased hepatocyte ERK activation. Haematologica. 2016;101(3):297-308. 44. Yang B, Kirby S, Lewis J, Detloff PJ, Maeda N,
Smithies O. A mouse model for beta 0-thalassemia. Proc Natl Acad Sci USA. 1995; 92(25):11608-11612.
45. Gelderman MP, Baek JH, Yalamanoglu A, et al. Reversal of hemochromatosis by apotransferrin in non-transfused and transfused Hbbth3/1 (heterozygous B1/B2 globin gene deletion) mice. Haematologica. 2015;100(5):611-622. 46. Liu J, Zhang J, Ginzburg Y, et al. Quantitative
analysis of murine terminal erythroid differentiation in vivo: novel method to study normal and disordered erythropoiesis. Blood. 2013;121(8):e43-e49.
47. Viatte L, Nicolas G, Lou DQ, et al. Chronic hepcidin induction causes hyposideremia and alters the pattern of cellular iron accumulation in hemochromatotic mice. Blood. 2006;107(7): 2952-2958.
48. Levy JE, Jin O, Fujiwara Y, Kuo F, Andrews NC. Transferrin receptor is necessary for development of erythrocytes and the nervous system. Nat Genet. 1999;21(4):396-399.
49. Zhang J, Socolovsky M, Gross AW, Lodish HF. Role of Ras signaling in erythroid differentiation of mouse fetal liver cells: functional analysis by a flow cytometry-based novel culture system. Blood. 2003;102(12):3938-3946.
50. Lin L, Valore EV, Nemeth E, Goodnough JB, Gabayan V, Ganz T. Iron transferrin regulates hepcidin synthesis in primary hepatocyte culture through hemojuvelin and BMP2/4. Blood. 2007; 110(6):2182-2189.
51. Torrance JD, Bothwell TH. In: Cook JD, ed. Methods in Hematology. Vol 1. New York: Churchill Livingstone; 1980:90-115. 52. Chen K, Liu J, Heck S, Chasis JA, An X,
Mohandas N. Resolving the distinct stages in erythroid differentiation based on dynamic changes in membrane protein expression during erythropoiesis. Proc Natl Acad Sci USA. 2009; 106(41):17413-17418.
53. Konstantinidis DG, Pushkaran S, Johnson JF, et al. Signaling and cytoskeletal requirements in erythroblast enucleation. Blood. 2012;119(25): 6118-6127.
54. Becker B, Clapper J, Harkins KR, Olson JA. In situ screening assay for cell viability using a dimeric cyanine nucleic acid stain. Anal Biochem. 1994;221(1):78-84.
55. Dussiot M, Maciel TT, Fricot A, et al. An activin receptor IIA ligand trap corrects ineffective erythropoiesis inb-thalassemia. Nat Med. 2014; 20(4):398-407.
56. Fung E, Nemeth E. Manipulation of the hepcidin pathway for therapeutic purposes. Haematologica. 2013;98(11):1667-1676. 57. Pfaffl MW. A new mathematical model for relative
quantification in real-time RT-PCR. Nucleic Acids Res. 2001;29(9):e45.
58. McGrath KE, Koniski AD, Malik J, Palis J. Circulation is established in a stepwise pattern in the mammalian embryo. Blood. 2003;101(5): 1669-1675.
59. Gao J, Chen J, Kramer M, Tsukamoto H, Zhang AS, Enns CA. Interaction of the hereditary hemochromatosis protein HFE with transferrin receptor 2 is required for transferrin-induced
hepcidin expression. Cell Metab. 2009;9(3): 217-227.
60. Schmidt PJ, Toran PT, Giannetti AM, Bjorkman PJ, Andrews NC. The transferrin receptor modulates Hfe-dependent regulation of hepcidin expression. Cell Metab. 2008;7(3):205-214. 61. Wang RH, Li C, Xu X, et al. A role of SMAD4 in
iron metabolism through the positive regulation of hepcidin expression. Cell Metab. 2005;2(6): 399-409.
62. Babitt JL, Huang FW, Wrighting DM, et al. Bone morphogenetic protein signaling by hemojuvelin regulates hepcidin expression. Nat Genet. 2006; 38(5):531-539.
63. Wallace DF, Summerville L, Crampton EM, Frazer DM, Anderson GJ, Subramaniam VN. Combined deletion of Hfe and transferrin receptor 2 in mice leads to marked dysregulation of hepcidin and iron overload. Hepatology. 2009; 50(6):1992-2000.
64. Ginzburg YZ, Rybicki AC, Suzuka SM, et al. Exogenous iron increases hemoglobin in beta-thalassemic mice. Exp Hematol. 2009;37(2):172-183.
65. Rouault TA. The role of iron regulatory proteins in mammalian iron homeostasis and disease. Nat Chem Biol. 2006;2(8):406-414.
66. Kerenyi MA, Grebien F, Gehart H, et al. Stat5 regulates cellular iron uptake of erythroid cells via IRP-2 and TfR-1. Blood. 2008;112(9):3878-3888. 67. Arlet JB, Ribeil JA, Guillem F, et al. HSP70
sequestration by freea-globin promotes ineffective erythropoiesis inb-thalassaemia. Nature. 2014;514(7521):242-246.
68. Schmidt PJ, Racie T, Westerman M, Fitzgerald K, Butler JS, Fleming MD. Combination therapy with a Tmprss6 RNAi-therapeutic and the oral iron chelator deferiprone additively diminishes secondary iron overload in a mouse model of b-thalassemia intermedia. Am J Hematol. 2015; 90(4):310-313.
69. M ¨ullner EW, K ¨uhn LC. A stem-loop in the 39 untranslated region mediates iron-dependent regulation of transferrin receptor mRNA stability in the cytoplasm. Cell. 1988;53(5):815-825. 70. Chan RY, Seiser C, Schulman HM, K ¨uhn LC,
Ponka P. Regulation of transferrin receptor mRNA
expression. Distinct regulatory features in erythroid cells. Eur J Biochem. 1994;220(3):683-692. 71. Koeller DM, Casey JL, Hentze MW, et al. A
cytosolic protein binds to structural elements within the iron regulatory region of the transferrin receptor mRNA. Proc Natl Acad Sci USA. 1989; 86(10):3574-3578.
72. Binder R, Horowitz JA, Basilion JP, Koeller DM, Klausner RD, Harford JB. Evidence that the pathway of transferrin receptor mRNA degradation involves an endonucleolytic cleavage within the 39 UTR and does not involve poly(A) tail shortening. EMBO J. 1994;13(8): 1969-1980.
73. Zhang B, Donga PZ, Corral M, Sasane M, Miller JD, Pashos CL. Pharmacoeconomic considerations in treating iron overload in patients withb-thalassaemia, sickle cell disease and myelodysplastic syndromes in the US: a literature review. Pharmacoeconomics. 2011;29(6): 461-474.