Qualitative evaluation of fermented olives grown in
Southern Italy (cvs. Carolea, Grossa of Gerace and
Nocellara Messinese)
Alessandra De Bruno*, Angela Zappia, Amalia Piscopo, Marco Poiana
Department of AGRARIA, University Mediterranea of Reggio Calabria, 89124 Vito, Reggio Calabria, Italy
*Corresponding author:
Alessandra De Bruno, Department of AGRARIA, University Mediterranea of Reggio Calabria, 89124 Vito (Reggio Calabria), Italy.
Tel.: +39 09651694381/2. E-mail: [email protected] Received: 11 April 2019; Accepted: 29 July 2019
INTRODUCTION
Table olives are one of the most popular fermented traditional food products in Mediterranean countries and their world consumption is continuously increasing. Spain, Greece, and Italy are among the world’s leading manufacturers, together supply almost 30% of annual world olive production which exceeds 2.4 million tons/year (IOC 2016; Rodríguez-Gómez et al., 2017). Italy is the third most important producer in the world; with about 96,000 tons/year of table olives (D’Antuono et al., 2018). Olives, represent an important source of nutrients and bioactive compounds with health benefits due to the presence of high level of mono-unsaturated fatty acids and phenolic compounds (Gamli, 2016). The composition of some chemical constituents, as phenolic compounds, and also biometric parameters of olive fruits and derived products are affected by several factors as: geographical origin (Garcìa et al., 2018; Piscopo et al., 2016a), variety (Romero et al., 2004; Giuffrè, 2017), degree of olive ripeness (Piscopo et al., 2018a; Conte et al., 2019) and
processing (Mele et al., 2018; Piscopo et al., 2018b; Sicari et al., 2010; Romeo et al., 2009; Pires-Cabral et al. 2018). The unprocessed table olives are rich in oleuropein and ligstroside, compounds responsible of their characteristic bitter taste (Ryan and Robards, 1998), so they undergo transformation processes to be more palatable (Aka-Kayguluoglu et al., 2014; Piscopo et al., 2014). One of the most important steps in the production of table olives is degradation of their excessively high levels of polyphenolic compounds (Cosmai et al., 2018). The aim of table olive processing is to hydrolyse the oleuropein by different treatments, for example the olives can be treated in sodium hydroxide solutions, put into brine and successively rinsed in water, or they can also be directly fermented in brine (natural method or spontaneous fermentation) (Aponte et al., 2010; Fadda et al., 2014; Piscopo et al., 2016b; Romeo et al., 2012). Spontaneous fermentation lasts 8–12 months and it is carried out by population of several microorganisms, mainly the epiphytic yeasts and lactic acid bacteria (LAB) (Brenes et al., 2004; Garrido Fernández et al., 1997; Medina et al., 2008), which play an important role in the production of treated and
The aim of this work was to evaluate the quality of olives of three typical cultivars of Southern Italy and correspondent brines after different fermentation variables: two NaCl concentrations with and without acidification up to pH 4). In particular, physicochemical parameters, microbiological counts and antioxidant activity of olive samples and brines were monitored and compared. The obtained results showed a good fermentation performance of studied olive cultivars , with a brine pH inside the legal limit of 4.3, also in samples were the pH correction was not performed. The pH lowering was slower in brine samples treated with the lowest salt concentration. Moreover, all samples manifested higher antioxidant activity after 240 days of brining, and total phenol content ranged from 9.22 to 20.78 g gallic acid kg-1 in olives. Among samples, Carolea olives showed the highest total phenolic content and the highest antioxidant activity after 240 days of fermentation.
Keywords: Antioxidant capacity; Brining; Phenolic compounds; Table olives.
http://www.ejfa.me/
R E S E A R C H A R T I C L E
natural table olives (Arroyo-López et al., 2012; Sidari et al., 2019). As reported by Romeo et al. (2010), the successful fermentation of brined vegetables is influenced by numerous chemical and physical factors, including: cultivar, the skin colour, the flesh firmness of the drupe and the time of processing. Besides the use of starter cultures and different salt levels, the application of acidified solution, could be an alternative to preserve the product.
To this purpose, the aim of the present study was to determine the influence of different treatments such as acidification and salt addition on the quality of table olives. These treatments were performed on three cultivars typical of southern Italy, namely Carolea, Grossa of Gerace and Nocellara Messinese, in order to study the fermentative evolution and to define the better method to obtain table olives with improved sensorial, textural and microbiological quality for the studied cultivar.
MATERIALS AND METHODS
MaterialsOlives from Carolea (C), Grossa of Gerace (G) and Nocellara Messinese (N) cultivars were harvested in the province of Reggio Calabria (Italy) at mature-green stage and immediately transported to the laboratory to be processed. Calibration by weight was performed to have uniform fruit sizes and carpological analyses were carried out on 50 fruits randomly sampled within the lot. Moisture content (MC), water activity (aw), pH, Titratable acidity (TA), Total Soluble Solids (TSS), Total Phenolic Compounds (TPC) and DPPH assay were carried out on fresh olives.
Olive processing
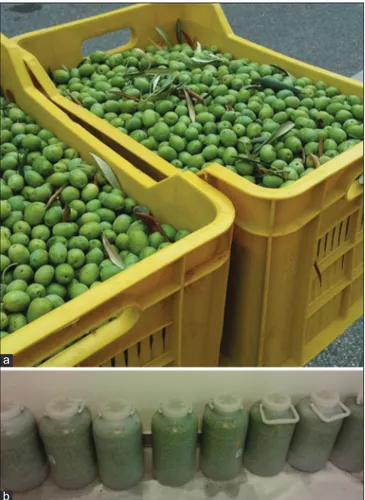
After washing, the olives were subjected to natural fermentation. The lab-scale fermentations were performed in cylindrical fermenters made of polyethylene (11 kg olives in 16.5 L of brine): each fermentation was performed twice (Fig. 1 a,b). The experimental plan adopted different levels of salt concentration (5 and 8 % NaCl) and the acidification with lactic acid (90%, Fluka) to pH 4.3 or no acidification. The containers were filled up with fresh prepared brine and the samples were named with the initial “C” for Carolea cv, “G”
for Grossa of Gerace cv and “N” for Nocellara Messinese cv followed as reported below:
• 8% NaCl not acidified brine (8% NA); • 8% NaCl acidified brine (8% A);
• 5% NaCl for 20 days and the salt concentration was after increased to 8% not acidified brine (5% NA); • 5% NaCl for 20 days and the salt concentration was
after increased to 8% acidified brine (5% A).
The olives were brined at ambient temperature, adopting correction of salinity and acidity for 8 months during different time corresponding to 7, 15, 30, 45, 90, 120, 180, 240 days. The salt concentration and pH values in the brines were adjusted respectively by adding solid NaCl and lactic acid to guarantee good preservation during the post fermentation stage.
Methods
Physicochemical and microbiological analyses of brines
Analyses of brines for pH and Total Acidity (TA) were carried out by the routine methods (Fernández-Diez et al., 1985); while chlorides analysis (% NaCl) through the use of a digital refractometer (DBR 047 SALT), in order to correct salt and maintain the concentration at 8% over time. The analysis of the colour was performed on 10 mL of brine using a reflection colorimeter (Minolta CR 300, Osaka, Japan) with reference to CIE L*a*b* coordinates by using of a D65 illuminant. The viable populations of the principal groups of microorganisms were determined by plating the brines. In the following selective media: total mesophilic bacteria in Plate Count Agar (Oxoid) (PCA) incubated at 32 °C for 24 h, lactic acid bacteria in MRS
Fig 1. (a) Carolea olives before the treatments, (b) Carolea olives during the brining process.
a
Agar (LAB) (Oxoid) added with 50 mg/L of Nystatin at 32 °C for 48 h in anaerobiosis, yeasts and moulds in OGYA (Oxoid) at 25 °C for 48 h (expressed as Log10 CFU mL-1).
Physicochemical analyses of olives
For pH and free acidity values were carried out by the routine methods (Fernández-Diez et al., 1985) and the results were expressed as g Lactic acid 100 g-1 olives). a
w
was measured by an Aqua lab (3TE, Decagon devices Inc., Washington) apparatus which uses the chilled-mirror
dew point technique to measure the aw of homogenized
samples. MC was determined by oven drying at 105 °C up to constant weight. The colour of the olives was measured using a reflection colorimeter (Minolta CR 300, Osaka, Japan) with reference to CIE L*a*b* coordinates. This analysis was assessed on two points of each olive and for ten olives randomly chosen for each sample.
Total phenol content (TPC) and antioxidant activity of olives and brines
The olive extracts were obtained according to the method reported by Othman et al. (2009), with some modifications. The TPC of olive extracts and brines were quantified spectrophotometrically at 725 nm after reaction with the Folin Ciocalteu reagent. The results were obtained by means of a calibration plot using pure gallic acid as standard at different concentrations and expressed as g gallic acid equivalent (GAE) kg-1 of fresh
weight (f.w.) for olives and mg gallic acid equivalent (GAE) L-1 for brines.
The total antioxidant activity determination was performed using the Brand-Williams et al. (1995) method. The decrement of absorbance was determined by a spectrophotometer at 515 nm (after 30 minutes) at the temperature of 20 °C to eliminate the risk of thermal degradation of the molecules tested (Bondet et al., 1997). The results were expressed as percentage of inhibition and calculated by applying the following formula:
% Inhibition= ((At0-Ate)/At0) *100
Moreover, the Trolox Equivalent Antioxidant Capacity (TEAC) method was performed using the method reported by Re et al. (1999). The decrement of absorbance was measured after 6 minutes at 734 nm. The TEAC value was expressed as μM Trolox g-1.
Sensory analysis
The procedure for the classification of table olives is based on official parameters of quality (IOC, 2011). The test was performed by a panel of 8 judges (males and females) from 25 to 50 years old, recruited among researchers and technicians of the Food Science and Technology Unit of
Reggio Calabria University with previous experience in the sensory analysis of table olives. The guidelines for taster and panel leader training in accordance with IOC standard (IOC, 2011) were used for the sensory analysis of table olives. The judges were trained during some preliminary sessions for identification of gustatory attributes (saltiness, bitterness, acidity) and for kinaesthetic or texture attributes (hardness, fibrousness, crunchiness). Sensory data were elaborated by calculating the median of results. The principles of Quantitative Descriptive Analysis (QDA) were utilized to define the typical sensory profile of each end-product.
Statistical analysis
All experimental results in this study were expressed as mean values ± standard deviation (SD) of three measurements (n=3). The significant differences (p<0.05) among treatment means were determined by analysis of variance (Multivariate and ANOVA analysis) with
Tukey’s post-hoc test. SPSS Software (Version 15.0, SPSS
Inc., Chicago, IL, USA) was used for data processing. In addition, Pearson’s correlation coefficients (r) to determine the relation between two variables were analysed.
RESULTS AND DISCUSSIONS
Physicochemical characteristics of fresh olives
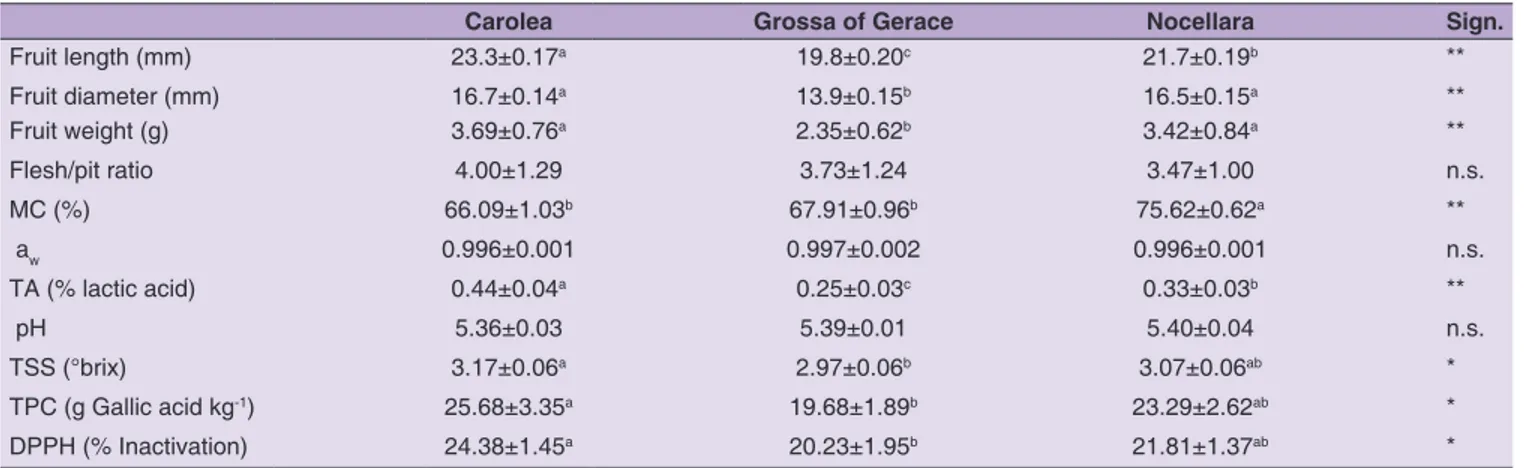
The characteristics of fresh olives of three cultivars have been reported in Table 1.
The carpological parameters of two samples (Carolea and Nocellara Messinese) reveal that are suitable for processing as table olives according to the IOC (2000) limits that define the olive’s suitability for table consumption in function of weight between 3 and 5 g. The size is in fact important for the product presentation and olives showed different weight among cultivars: 2.35 g, 3.42 g and 3.69 respectively in G, N and C. The flesh to pit ratio equal or higher to 4 and a percentage of flesh higher than 80 respect the whole fruit are considered optimal for table olives with No significant differences were observed among the three cultivars which showed a ratio near 4% (p>0.05).
Some differences were instead observed among cultivars for MC percentage (p<0.05), in particular the olives of
Nocellara Messinese cv showed the highest moisture
content (75.62%±0.62), whereas cultivars did not differ for aw and pH value (p>0.05). The brining promoted the release of water, sugar and other nutrients from olives. TSS are an interesting parameters because the olive sugars transferred into the brine. make it an appropriate growth medium for the microorganisms responsible for lactic fermentation (Maldonado et al., 2008). Carolea olives showed the higher total soluble content 3.17 °Brix than other samples before
the brining.
Total phenolic compounds (TPC) and antioxidant capacity of fresh olives were determined in the different cultivars. Significant differences were found between the cultivars for the TPC and DPPH assays (p <0.05). The Carolea
cv showed higher values for both antioxidant assays
(TPC: 25.68 ± 3.35 and DPPH: 24.38 ± 1.45); follows
the Nocellara Messinese cv with slightly lower values
(TPC: 23.29 ± 2.62; DPPH: 21.81 ± 1.37); while lower values were detected in Grossa of Gerace cv (TPC: 19.68
± 1.89; DPPH: 20.23 ± 1.95).
Physicochemical characteristics and antioxidant capacity of brine during fermentation
The colour parameters were measured in brine samples at the end of fermentation: significant differences were observed among samples for the brightness value (L*), that
increased in all samples after 240 days of fermentation. The same trend was observed for b* value, denoting a tendency to the yellow tone at the end of fermentation, whereas the measured a* values generally did not strongly differ during the time. The ΔE* parameter, that measures the colour differences, was significantly different among all the treated olives. The highest value (10) was found in Grossa of Gerace cv (data not shown).
pH and TA values were also monitored as indicators of the evolution of the fermentation (Fig. 2 a,b,c, Table 2). The pH of brine is an important parameter in technological and safety terms, and the measured values were lower than the limits (4.3) for marketing table olives in most of the samples (IOC, 2004) . The pH values decreased more clearly and particularly in Carolea and Geracese cv. within the first 30
days of fermentation, also in not acidified samples. These cultivars, treated with a higher concentration of salt with
Table 1: Compositional characteristics of fresh olives of the three cultivars
Carolea Grossa of Gerace Nocellara Sign.
Fruit length (mm) 23.3±0.17a 19.8±0.20c 21.7±0.19b ** Fruit diameter (mm) 16.7±0.14a 13.9±0.15b 16.5±0.15a ** Fruit weight (g) 3.69±0.76a 2.35±0.62b 3.42±0.84a ** Flesh/pit ratio 4.00±1.29 3.73±1.24 3.47±1.00 n.s. MC (%) 66.09±1.03b 67.91±0.96b 75.62±0.62a ** aw 0.996±0.001 0.997±0.002 0.996±0.001 n.s. TA (% lactic acid) 0.44±0.04a 0.25±0.03c 0.33±0.03b ** pH 5.36±0.03 5.39±0.01 5.40±0.04 n.s. TSS (°brix) 3.17±0.06a 2.97±0.06b 3.07±0.06ab * TPC (g Gallic acid kg-1) 25.68±3.35a 19.68±1.89b 23.29±2.62ab * DPPH (% Inactivation) 24.38±1.45a 20.23±1.95b 21.81±1.37ab *
The data are presented as means±SDs.**Significance at p<0.01; *Significance at p<0.05; n.s. not significant.
Fig 2. Changes in pH value in brine during fermentation of Carolea (a), Grossa of Gerace (b) and Nocellara Messinese (c) olives. Legenda: C = Carolea; G= Geracese; N= Nocellara Messinese; A= acidified; NA = not acidified.
a b
and without acidification, showed a pH decrease from 5 to 4 after 30 days of brining). Moreover, no further significant variations were observed up to 240 days of fermentation.
A different trend was found for Nocellara Messinese cv,
where the safety parameters have been reached at the end of fermentation (240 days, Fig. 2c). The TA values increased progressively during the fermentation process, with a corresponding decrease in pH, which reached values of 4.1–4.3 at the end of fermentation (8 months). The increase in acidity from 180 to 240 days, showed in all the treated samples, was very important to prevent microbial spoilage and for a general accuracy of the fermentative process, as reported by other authors (Sánchez et al., 2018). Therefore, both acidified and no acidified olives showed in this experimentation a correct fermentation according to the microbiological rule for table olives parameters (IOC, 2004).
The counts of PCA, LAB, yeasts and moulds are shown in Table 3. The microbiological analysis at the end of fermentation did not show significant differences for
Carolea and Grossa of Gerace cvs (p>0.05), only the
moulds were significant in all the olives treated (p<0.01). All the samples showed a reduction of PCA during the
monitoring time (data not shown). After 240 days of fermentation the samples showed values between 5.15 and 5.80 (log10 CFU mL-1), significant differences were found for Nocellara Messinese cv and for samples treated without
acidification. LAB were present from the first weeks of fermentation in all cultivars and their contents were higher than yeasts: this showed that fermentation has taken place
Table 2: Results of Tukey’s post-hoc test for pH and TA analysis on brines of treated olives
Analysis Cultivars 8% NA 8% A 5% NA 5% A pH C ** ns ** * pH G ** ** ** ns pH N ** ns * ** TA C ** ** ** * TA G ** ** ** ** TA N ** ** ** *
Table 3: Microbiological analysis of brines (expressed as Log10 CFU mL-1) after 240 days of the three cultivars
Analysis Cultivars 8% NA 8% A 5% NA 5% A Sign.
PCA C 5.36b 5.46 5.15b 5.43 ns G 5.41b 5.34 5.24b 5.69 ns N 5.80aA 5.15C 5.65aAB 5,44B ** Sign. * ns ** ns LAB C 5.26b 5.49 5.26b 5.29 ns G 5.31bAB 5.30AB 5.21bB 5.42A * N 5.81aA 5.17C 5.61aAB 5.43BC ** Sign. * ns ** ns Moulds C 0B 0cB 0bB 3.48aA ** G 0B 3.69aA 0bB 3.3aA ** N 0D 3.48bB 3.96aA 3.00bC ** Sign. ns ** ** ** Yeast C 4.25bB 4.84A 4.61bAB 4.31AB ns G 4.80a 4.48b 4.39b 4.63 ns N 5.06aB 4.61abC 6.03aA 4.81BC ** Sign. * * ** ns
The data are presented as means±SDs. ** Significance at p<0.01. * Significance at p<0.05; n.s. not significant. By Tukey’s multiple range test, small letters show differences among the cultivars and capital letters show differences among the treatments.
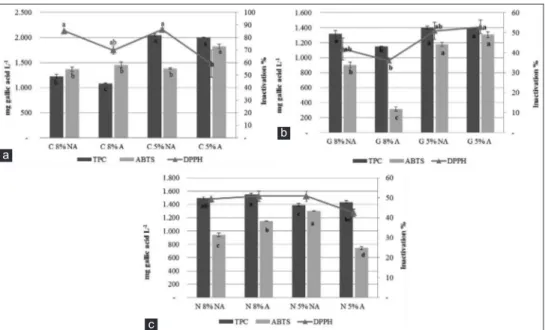
Fig 3. TPC and antioxidant activity in brines after 240 days in Carolea (a), Grossa of Gerace (b) and Nocellara Messinese (c) cv. The data are
presented as means ± SDs.** Significance at P < 0.01; * Significance at P < 0.05; n.s. not significant
a
b
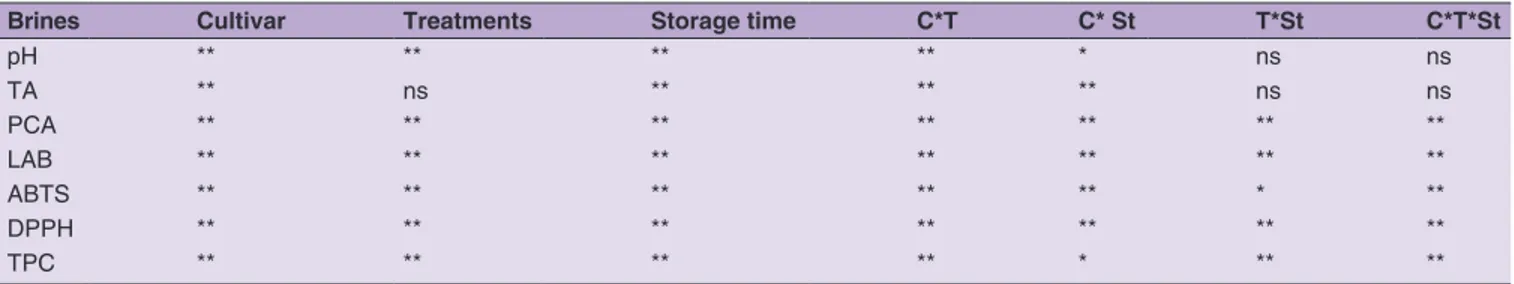
Table 4 (a): Results of multivariate analysis for some physicochemical, microbiological and antioxidant parameters respect to different factors on brines
Brines Cultivar Treatments Storage time C*T C* St T*St C*T*St
pH ** ** ** ** * ns ns TA ** ns ** ** ** ns ns PCA ** ** ** ** ** ** ** LAB ** ** ** ** ** ** ** ABTS ** ** ** ** ** * ** DPPH ** ** ** ** ** ** ** TPC ** ** ** ** * ** **
**Significance at p<0.01; *Significance at p<0.05; n.s. not significant.
Table 4 (b): Results of multivariate analysis for some physicochemical and antioxidant parameters respect to different factors on olives
Olives Cultivar Treatments Storage time C*T C* St T*St C*T*St
ss ** * ** ns ns ns ns aw ** ns ** ns ns ns * pH ** ns ** ns ** ns ns TA ** ns ** * ** ns ns ABTS ** ns * ** ns ns ** DPPH ** ** ** ** ** ** ns TPC ** ** ** * ** ** ns
**Significance at p<0.01; *Significance at p<0.05; n.s. not significant.
adequately. However, all the brines showed a decrease of LAB during the time: probably the reduction was due to the natural competition among microbiota present in the treated olives. After 9 months of fermentation,
LAB showed variable values from 5.17 to 5.81 log10 CFU
mL-1 for all the cultivars and treatments, with statistical
differences in Grossa of Gerace (p<0.05) and Nocellara Messinese (p<0.01) samples and for the not acidified samples (8% NA and 5% NA). Yeasts and moulds were monitored only at the end of the fermentation process. The moulds were particularly present in the samples in the acidified samples (5% A and 8% A) in all the cultivars (except for Carolea cv).
TPC and antioxidant capacity in brines at the end of the monitoring period are shown in Figure 3 (a, b, c). The level of phenolic compounds and antioxidant capacity determined with DPPH assay increased significantly during the fermentation process. The increase of these parameters was due to the diffusion of phenolics from the olive to the brine during fermentation as observed in other papers (Romeo et al., 2010; Chranioti et al., 2018). The TPC in brines showed significant differences between treatments and among cultivars and showed values that ranged from
1083 to 2046 mg L-1 at the end of fermentation. DPPH
assay showed a similar trend to that highlighted by TPC, and particularly brines of Carolea cv olives expressed the highest
antioxidant activity at the end of fermentation (Fig. 3 a). Tab. 4 (a) shows that most of the monitored qualitative parameters in brines were significantly influenced by all the variables (cultivar, treatments and storage time) by Multivariate analysis (p<0.01).
Physicochemical characteristics and antioxidant capacity of olives during fermentation
Data of physicochemical characteristics (Table 5) of treated olives were analysed at the end of fermentation (240 days). Not significant differences of pH values were observed among cultivars and treatments applied: the monitored values ranged from 4.22 to 4.61. Concerning the TA results, significant differences (p<0.05) were observed among cultivars and treatments with the only exception of the 5% A olives of the three cultivars that possessed the same values (0.5 Lactic acid %).
Colour is also an important quality attribute of table olives for the consumer. In this study, the colour parameters were measured in order to evaluate the chromatic variations following the application of the four technological treatments in the different cultivars. Not significant variations were observed in the same cultivar after the treatments, but there were little differences between the cultivar especially for the chromatism a* that in all treated G olives had the highest value, reflecting a tendency to red colour.
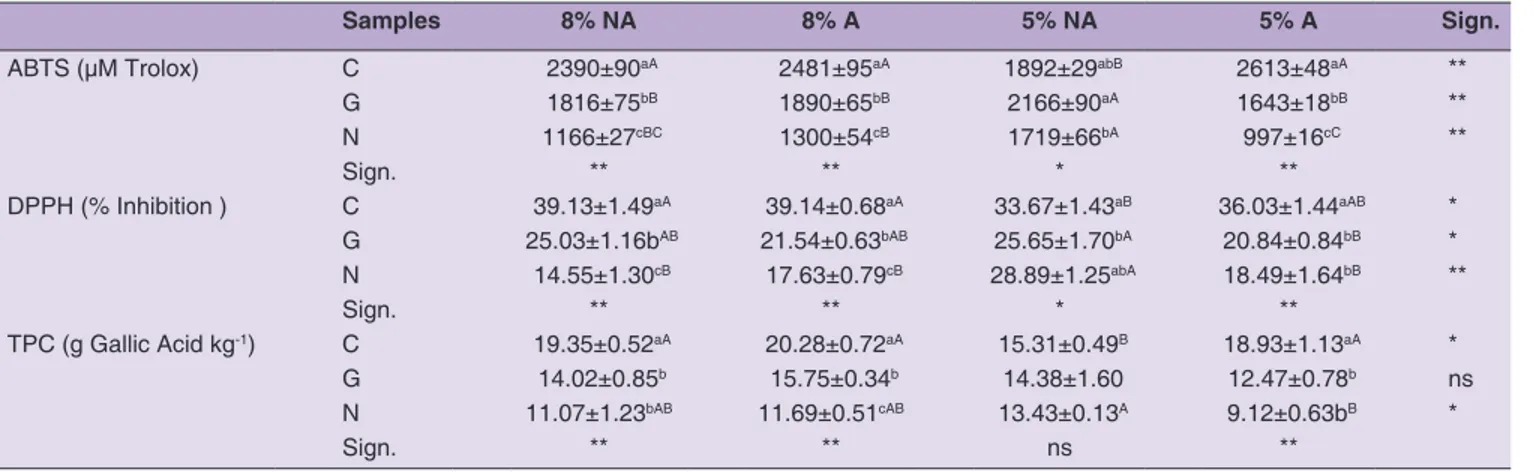
The One-way ANOVA of TPC and antioxidant activity of fermented table olives after 240 days were represented in Table 6. The phenolic content is cultivar dependent: among studied cultivars, the highest values of TPC were counted in general in Carolea olives that showed significant differences among treatments and the highest content in olives brined with 8% NaCl and acidification (20.28±0.72 g gallic acid kg-1). The lowest values were instead measured
Table 5: One-way Anova data of the effect of treatment on physicochemical analyses of the three cultivars (240 days) Cultivar 8% NA 8% A 5% NA 5% A Sign. pH C 4.40±0.01 4.43±0.04 4.49±0.07 4.61±0.06 ns G 4.32±0.04AB 4.22±0.01B 4.47±0.04A 4.40±0.07AB * N 4.58±0.10 4.42±0.11 4.31±0.07 4.44±0.08 ns Sign. ns ns ns ns TA (g lactic acid 100 g-1pulp) C 0.69±0.01aA 0.71±0.05bA 0.67±0.01bA 0.51±0.03B * G 0.70±0.00aB 1.11±0.02aA 0.52±0.01bC 0.51±0.04C ** N 0.48±0.04bB 0.61±0.08bB 1.20±0.13aA 0.55±0.07B ** Sign. ** ** ** ns aw C 0.957±0.016 0.956±0.006 0.952±0.001 0.949±0.006 ns G 0.948±0.001B 0.946±0.001B 0.955±0.002A 0.954±0.001A ** N 0.956±0.004 0.961±0.006 0.968±0.007 0.964±0.008 ns Sign. ns ns ns ns MC (%) C 65.87±0.74bB 67.07±0.45cAB 69.33±0.74bA 68.20±0.01bAB * G 66.93±0.64bB 70.82±0.71bA 68.42±1.00bAB 68.17±0.22bAB * N 74.4±0.92aB 74.50±0.25aB 75.24±0.50aAB 77.67±1.04aA * Sign. ** ** ** ** L* C 50.24±1.68 51.12±0.67a 49.02±0.17 49.16±0.46ab ns G 50.11±0.47 48.85±0.67ab 49.49±0.69 50.62±0.18a ns N 49.31±0.50 47.96±0.53b 49.85±1.14 48.04±0.40b ns Sign. ns * ns * a* C 6.51±0.12c 6.63±0.06c 5.98±0c 6.38±0.29c ns G 9.94±0.35a 10.40±0.37a 10.18±0.23a 10.26±0.40a ns N 8.16±0.42b 8.00±0.12b 8.72±0.36b 8.19±0.41b ns Sign. * ** ** ** b* C 26.54±1.26 27.94±0.01a 24.55±0.16 25.20±1.23 ns G 25.22±0.15 25.26±0.02b 24.21±1.02 24.53±0.80 ns N 25.00±1.51 23.79±0.62b 25.35±1.45 22.82±0.25 ns Sign. ns ** ns ns
The data are presented as means ± SDs. ** Significance at p<0.01. * Significance at p<0.05; n.s. not significant. By Tukey’s multiple range test, small letters show differences among cultivars and capital letters show differences among treatments.
Table 6: TPC and Antioxidant activity on treated olive samples after 240 days
Samples 8% NA 8% A 5% NA 5% A Sign.
ABTS (µM Trolox) C 2390±90aA 2481±95aA 1892±29abB 2613±48aA **
G 1816±75bB 1890±65bB 2166±90aA 1643±18bB ** N 1166±27cBC 1300±54cB 1719±66bA 997±16cC ** Sign. ** ** * ** DPPH (% Inhibition ) C 39.13±1.49aA 39.14±0.68aA 33.67±1.43aB 36.03±1.44aAB * G 25.03±1.16bAB 21.54±0.63bAB 25.65±1.70bA 20.84±0.84bB * N 14.55±1.30cB 17.63±0.79cB 28.89±1.25abA 18.49±1.64bB ** Sign. ** ** * ** TPC (g Gallic Acid kg-1) C 19.35±0.52aA 20.28±0.72aA 15.31±0.49B 18.93±1.13aA * G 14.02±0.85b 15.75±0.34b 14.38±1.60 12.47±0.78b ns N 11.07±1.23bAB 11.69±0.51cAB 13.43±0.13A 9.12±0.63bB * Sign. ** ** ns **
The data are presented as means±SDs.**Significance at p<0.01. *Significance at <0.05; n.s. not significant. By Tukey’s multiple range test, small letters show differences among cultivars and capital letters show differences among treatments.
acidification (9.12±0.63 g gallic acid kg-1). Not significant
differences were found in the Grossa of Gerace olives among treatments. Comparing the results of fresh to the fermented olives (Table 1), it is possible to observe that the fresh olives showed higher TPC values. These values decreased during the conservation period even if they remain high especially in the Carolea cultivar (Table 6).
A reduction greater than 50% occurs in the Nocellara cv
(23.29±2.62 in N and 9.12±0.63 in N5%A). The highest antioxidant capacity values determined with ABTS assay,
were measured in Carolea cv for all the treatments (the
values ranged between 1892 and 2613 µM Trolox), these values with is in agreement with the results of TPC and DPPH assay (the values ranged between 33 and 39%). The lowest data were measured for Nocellara Messinese
cv, for all the treatments and for all the antioxidant assays.
The antioxidant compounds were significantly influenced by the different parameters of experimentation, only the ABTS assays was not influenced by the treatments (p>0.05), (Tab.4 b).
Positive Pearson correlations were found between TPC and the total antioxidant activity assays (ABTS and DPPH),
especially in Carolea cv (ABTS/TPC: r= 0.848; DPPH/
TPC: r= 0.926) and Nocellara cv (ABTS/TPC: r= 0.973;
DPPH/TPC: r= 0.729).
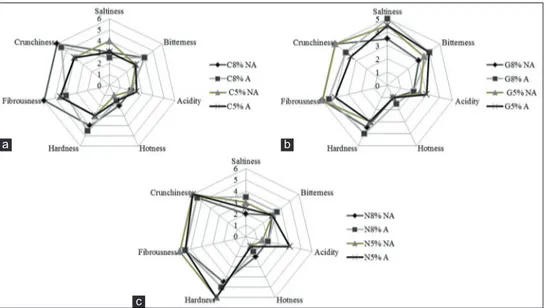
Sensory evaluation of table olives
The sensory aspects are very important because have an impact on the acceptability by the consumer, particularly the gustative and kinaesthetic attribute. The results of sensory analysis are shown in Figure 4 (a, b, c). Grossa of Gerace cv showed after 240 days of fermentation higher
values of saltiness (5 in G8%A); the saltiness is the basic taste produced by aqueous solutions of sodium chloride.
Probably the highest perception of salty in this cultivar is due to the smaller size of the olives. Nocellara Messinese olives at the end of fermentation were characterized by the highest kinaesthetic sensations such as hardness (force required to attain the deformation of the product) with value 6 in the samples brined with 5% NaCl with and without acidification. The crunchiness parameter was instead higher in all the olives of Nocellara Messinese
cv and in Carolea treated at 8% NaCl (with and without
acidification). In Geracese olives the kinaesthetic sensations were lower in most of the samples. Except for acidity, Nocellara Messinese samples possessed similar sensorial attributes with no differences due to the fermentation conditions.
CONCLUSION
This work reports an investigation on the physicochemical, sensory and antioxidant characteristics of table olives obtained from typical cultivars (Carolea, Grossa of Gerace and Nocellara Messinese) grown in Southern Italy (Calabria). The physicochemical evolution trend during fermentation was similar for all the cultivars, with the best results for the samples treated with a higher concentration of salt (8%). Among applied treatment conditions, the olives in brines with initial 5% of NaCl manifested worse qualitative characteristics, in particular for the minor
reduction of pH during fermentation. Carolea cv showed
the best characteristics both from the physicochemical and antioxidant point of view.
Authors’ contributions
Marco Poiana and Amalia Piscopo have developed the experimental plan. Alessandra de Bruno and Angela Zappia performed the analysis. Alessandra De Bruno performed
Fig 4. Sensory attributes of table olives after 240 days of fermentation in Carolea (a), Grossa of Gerace (b) and Nocellara Messinese (c) cv
a b
the computations, verified the analytical methods and discussed the results and wrote the final manuscript. Marco Poiana and Amalia Piscopo supervised the findings of this work.
REFERENCES
Aka-Kayguluoglu, A., A. Akpinar-Bayizit and O. I. Sahin-Cebeci. 2014. Evaluation of physicochemical and sensory properties of green olive pastes. Indian J. Tradit. Know. 13: 654-658.
Aponte M., V. Ventorino, G. Blaiotta, G. Volpe, V. Farina, G. Avellone, C. M. Lanza and G. Moschetti. 2010. Study of green Sicilian table olive fermentations through microbiological, chemical and sensory analyses. Food Microbiol. 27: 162-170. Arroyo-López, F. N., J. Bautista-Gallego, J. Domínguez-Manzano,
V. Romero-Gil, F. RodriguezGómez, P. García-García, A. Garrido-Fernández and R. Jiménez-Díaz. 2012. Formation of lactic acid bacteria-yeasts communities on the olive surface during Spanish-style Manzanilla fermentations. Food Microbiol. 32: 295-301.
Bondet, V., W. Brand-Williams and C. Berset. 1997. Kinetics and mechanism of antioxidant activity using the DPPH free radical method. Lebensm Wiss Technol. 30: 609-615.
Brand-Williams W., M. E. Cuvelier and C. Berset. 1995. Use of a free radical method to evaluate antioxidant activity. Lebensm. Wiss. Technol. 28: 25-30.
Brenes, M., C. Romero and A. Castro. 2004. Combined fermentation and evaporation processes for treatment of washwaters from Spanish-style green olive processing. J. Chem. Technol. Biotechnol. 79: 253-259.
Chranioti, C., P. Kotzekidou and D. Gerasopoulos. 2018. Effect of starter cultures on fermentation of naturally and alkali-treated cv. Conservolea green olives. J Food Sci. Technol. 89: 403-408. Conte, P., G. S. G. Caponio, C. F. A. Urgeghe, L. Montanari, A. Montinaro
and A. Piga. 2019. Change in quality during ripening of olive fruits and related oils extracted from three minor Autochthonous Sardinian cultivars. Emir. J. Food Agr. 31: 196-205.
Cosmai L., D. Campanella, M. De Angelis, C. Summo, V. M. Paradiso, A. Pasqualone and F. Caponio. 2018. Use of starter cultures for table olives fermentation as possibility to improve the quality of thermally stabilized olive-based paste. LWT Food Sci. Technol. 90: 381-388.
D’Antuono, I., A. Bruno, V. Linsalata, F. Minervini, A. Garbetta, M. Tufariello, G. Mita, A. F. Logrieco, G. Bleve and A. Cardinali. 2018. Fermented apulian table olives: Effect of selected microbial starters on polyphenols composition, antioxidant activities and bioaccessibility. Food Chem. 248: 137-145.
Fadda, C., A. Del Caro, A. M. Sanguinetti and A. Piga. 2014. Texture and antioxidant evolution of naturally green table olives as affected by different sodium chloride brine concentrations. Grasas Aceites, 65.
Fernández-Diez, M. J., R. Castro, A. Fernández, F. G. Cancho, F. G. Pellissó, M. N. Vega, A. H. Moreno, I. M. Mosquera, L. R. Navarro, M. C. D. Quintana, F. S. Roldàn, P. G. Garcìa and A. Castro. 1985. Biotecnologìa de la Aceituna de Mesa, CSIC, Spain. Gamli, Ö. F. 2016. The health effects of oleuropein, one of the major
phenolic compounds of olives. Olea europaea L. Ital. J. Food Sci. 28: 178-189.
Garcìa, P., C. Romero and M. Brenes. 2018. Bioactive substances in black ripe olives produced in Spain and the USA. J. Food Compos. Anal. 66: 193-198.
Garrido Fernández A., M. J. Fernández Díez and M. R. Adams. 1997. Table Olive Production and Processing. Vol. 67. Chapman and Hall, United Kingdom, p. 109.
Giuffrè, A. M. 2017. Biometric evaluation of twelve olive cultivars under rainfed conditions in the region of Calabria, South Italy. Emir. J. Food Agric. 29: 696-709.
IOC. 2000. International Olive Oil Council World Catalogue of Olive Cultivars. IOC, Madrid, Spain.
IOC. 2004. International Olive Oil Council Trade Standard Applying to Table Olives. IOC, Madrid, Spain.
IOC. 2011. International Olive Oil Council Sensory Analysis of Table Olives. Document COI/OT/MO No 1/Rev. 2. IOC, Madrid, Spain. IOC. 2016. International Olive Council World Table Olive Figures.
Available from: http://www.internationaloliveoil.org/estaticos/ view/132-world-table-olivefigures.
Maldonado, M. B., C. A. Zuritz and N. Miras. 2008. Influence of brine concentration on sugar and sodium chloride diffusion during the processing of the green olive variety Arauco. Grasas Aceites. 59: 267-273.
Medina, E., C. Romero, M. Brenes, P. García, A. de Castro and A. García. 2008. Profile of anti-lactic acid bacteria compounds during the storage of olives which are not treated with alkali. Eur. Food. Res. Technol. 228: 133-138.
Mele, M. A., M. Z. Islam, H. M. Kang and A. M. Giuffrè. 2018. Pre-and post-harvest factors Pre-and their impact on oil composition Pre-and quality of olive fruit. Emir. J. Food Agric. 30: 592-603.
Othman, N. B., D. Roblain, N. Chammen, P. Thonart and M. Hamdi. 2009. Antioxidant phenolic compounds loss during the fermentation of Chétoui olives. Food Chem. 116: 662-669. Pires-Cabral, P., T. Barros, P. Nunes and C. Quintas. 2018.
Physicochemical, nutritional and microbiological characteristics of traditional table olives from Southern Portugal. Emir. J. Food Agric. 30: 611-620.
Piscopo, A., A. De Bruno, A. Zappia and M. Poiana. 2014. Antioxidant activity of dried green olives (Carolea cv.). LWT-Food Sci. Technol. 58: 49-54.
Piscopo, A., A. De Bruno, A. Zappia, C. Ventre and M. Poiana. 2016a. Characterization of monovarietal olive oils obtained from mills of Calabria region (Southern Italy). Food Chem. 213: 313-318. Piscopo, A., A. De Bruno, A. Zappia, and M. Poiana. 2016b Increase
in antioxidant activity of brined olives (Carolea cv.) thermally treated in different packaging types. Eur. J. Lipid Sci. Technol. 118: 1132-1140.
Piscopo, A., A. Zappia, A. De Bruno and M. Poiana. 2018a. Effect of the harvesting time on the quality of olive oils produced in Calabria. Eur. J. Lipid Sci. Technol. 120: 1700304.
Piscopo, A., A. De Bruno, A. Zappia, G. Gioffre, N. Grillone, R. Mafrica and M. Poiana. 2018b. Effect of olive storage temperature on the quality of carolea and ottobratica oils. Emir. J. Food Agric. 30: 563-572.
Re, R., N. Pellegrini, A. Proteggente, A. Pannala, M. Yang and C. Rice-Evans. 1999. Antioxidant activity applying an improved ABTS radical cation decolorization assay. Free Radic. Biol. Med. 26: 1231-1237.
Rodríguez-Gómez, F., M. Á. Ruiz-Bellido, V. Romero-Gil, A. Benítez-Cabello, A. Garrido-Fernández and F. N. Arroyo-López. 2017. Microbiological and physicochemical changes in natural green heat-shocked aloreña de málaga table olives. Front. Microbiol. 8: 2209. Romeo, F. V., S. De Luca, A. Piscopo, E. Perri and M. Poiana. 2009.
Effects of post-fermentation processing on the stabilisation of naturally fermented green table olives (cv nocellara etnea). Food Chem. 116: 873-878.
Romeo, F. V., A. Piscopo and M. Poiana. 2010. Effect of acidification and salt concentration on two black brined olives from Sicily (cv Moresca and Giarraffa). Grasas Aceites. 61: 1-3.
Romeo, F. V., A. Piscopo and M. Poiana. 2012. Effect of drying, chemical and natural processing methods on black biancolilla olives. Grasas Aceites. 63: 223-230.
Romero, C., M. Brenes, K. Yousfi, P. Garcia, A. Garcia and A. Garrido. 2004. Effect of cultivar and processing method on the contents of polyphenols in table olives. J. Agric. Food Chem. 52: 479-484. Ryan, M. and K. Robards. 1998. Critical review. Phenolic compounds
in olives. Analyst. 123: 31R-44R.
Sánchez, A. H., A. López-López, A. Cortés-Delgado, V. M. Beato, E. Medina, A. de Castro and A. Montaño. 2018. Effect of post-fermentation and packing stages on the volatile composition of Spanish-style green table olives. Food Chem. 239: 343-353. Sicari, V., A. M. Giuffrè, L. Louadj and M. Poiana. 2010. Evolution of
phenolic compounds of virgin olive oil during 12 months storage. Riv. Ital. Delle Sostanze Grasse. 87: 109-116.
Sidari, R., A. Martorana and A. De Bruno. 2019. Effect of brine composition on yeast biota associated with naturally fermented nocellara messinese table olives. LWT Food Sci. Technol. 109: 163-170.