65
Beneish M-score and detection of
earnings management in Italian SMEs
Christian Corsi
a, Daniela Di Berardino
b, Tiziana Di Cimbrini
ca Faculty of Communication Sciences, University of Teramo,
Italy, [email protected]
b Department of Management and Business Administration, University
of Chieti-Pescara, Italy, [email protected]
c Faculty of Political Sciences, University of Teramo,
Italy, [email protected]
Abstract
Accounting literature on the reliability of financial information presents several mathematical models whose purpose is to identify the existence of values manipulations. The phenomenon is described as earnings management and presents a broad discussion concerning the search for suitable models to measure the distortions in values. In this respect, the present paper aims to compare the ability of two versions of the same mathematical model of classify the risk of earnings manipulation in a discriminant way.
Keywords: Beneish M-score; accounting ratios; regression analysis; earnings
management
2010 AMS subject classification: 03H10; 62P20; 91B02; 91G70. doi: 10.23755/rm.v28i1.28
1 Introduction
The paper aims to compare the ability of two Beneish models, the M-score5 and the modified M-scoreIt, to detect earnings management. These methods have not been evaluated by prior research, and it is unclear which type of model dominates, as each models relies on the same assumptions and only empirically we can verify which of them is more descriptively valid. Davidson, Stickney and Weil (1987) [1] define the earnings management as the process by which managers, staying within accepted accounting principles, try to get at a certain desired level of profit to be marked on the
66
outside. Healy and Wahlen (1999) [2] state that earnings management occurs when “managers use their own judgment in reporting the financial data and in structuring transactions in order to alter financial reports to deceive stakeholders on the fundamental economic performance the company or to influence the consequences of contracts that depend on accounting data reported”. This perspective focuses on the matter to the judgment of the managers in the definition of financial data. Technically, earnings management activities include a spectrum of activities ranging from conservative accounting fraud through aggressive accounting and the neutral, through a wide range of accounting choices [3]. There are several ways in which managers can apply judgment to influence the financial reports. For example by means of the estimates that relate to the final value and duration of a certain good, or about possible future expenses are not yet done. For this reason this phenomenon is linked to the discretionary-accruals components present in the financial statement. Literature on earnings management has extensively examined a set of models to estimate discretionary accruals. These models range from the simple mathematical equation, in which total accruals are used as a measure of discretionary accruals, to sophisticated regression models, which decompose accruals into discretionary and nondiscretionary components and aim to forecast the presence of fraud and financial distress. Conversely, other models consider only a set of interrelated accounting ratios, comparing the values among several years in order to find some abnormalities. Attention to earnings management policies comes from the social and financial consequences which produces the distortion of information on the financial results of the company. Famous scandals of major companies are proof, for that reason more than thirty years research on mathematical methods able to adequately identify the phenomenon showed continued growth. Prior studies concluded that managers use discretionary accruals to convey their private information to investors, examining the time-series of discretionary-accruals (Hansen, 1996) [4] or the association between stock returns, discretionary accruals and nondiscretionary earnings [5]. Several studies are focused on listed firms or on financial statements based on US GAAP. In this study we observe a sample of 99 Italian academic spin offs, with homogeneous activity and omogeneous accounting rule system. These firms are mainly small and medium and not listed, for these reasons all the statistic models linked to market price of equity, stock volatility and US GAAP principles may be inadequate in detecting earnings management practices. In the next section we describe the main attribute of academic spin offs, followed by the concept and the consequences of earnings management and from the properties of Beneish model. Descriptive statistics, the comparative calculation and the regression analysis will be presented in section 5.
67
Finally we drawn some conclusion about the ability of two versions of Beneish model in detecting earnings management within Italian SME.
2 Academic spin-offs: an overview
The current improvement of the spin-off phenomenon in Europe has provided a treasured approach to spread new technologies and knowledge [6], driving up the business prospects for the academics and other players involved in projects directed to increase the outcome of the university scientific research [7;8]. Simultaneously, the spin-off process from a parent organization, especially from universities, has recently received growing attention both from the academic literature [9;10;11;12] and in the practice [13]. Furthermore, thanks to their capability in generating wealth and inspiring the development of scientific knowledge, policy-makers have showed an emergent interest in the academic spin-offs, considering them an active tool to encourage the development of knowledge-based economies in different institutional settings [14;15] so that their creation has become a crucial matter for policy-makers all around the world [16]. This is also due to the fact that either academicians, policy-makers either practitioners agree about the role played by universities as one of the main sources of innovations and their successful diffusion in the society [17;18]. Indeed, several scholars [19;20;21; 22] underline that the formation of a firm by a research institution is an outstanding method to commercialize the outcomes of the public research, as well as in contributing to the economic and social welfare and to the regional development. Scholars usually highlight the eminence of the foundation and diffusion of knowledge by universities as a noteworthy driving force for technological innovation in an economy, both at local and at national level [23]. The existing literature remarks that the new model of "open innovation", embraced by numerous organizations with the aim to contribute to the dissemination of knowledge, [24;25] has become a critically method in cooperating either with New Technology-Based Firms (NTBFs) either with scientific foundations, such as academics spin-offs, which provide new research settings and a multidisciplinary approach for the development of innovation processes [26;27]. Academic spin-offs (ASOs) are firms generated in order to exploit knowledge originated within universities. More specifically, the current literature defines academic spin-offs as “those companies that germinate from a University, where a group of researchers composes the entrepreneurial unit aiming at the exploitation of skills and results from the research developed within the University” [28] or “company composed by individuals who were former employees of the parent organization, and where the technology and the academic inventors may spin-off both from the institution, or where the technology spins out from the institution but the academic inventor is employed in the University, or, lastly, where only the technology spins out, while the
68
academic inventor does not maintain relationships with the new firm but may have equity” [29].
The establishment of the knowledge/technology employed by an academic spin off is a multi-stage process. Generally, literature identified three main models of academic spin-off creation and development. In the first model, Ndonzuau, Pirnay, and Surlemont [30] recognized four central stages in the growth of academic spin-offs: i) creating a sustainable business idea, ii) converting the idea into a business process, iii) building a firm and iv) contributing value to customers, employees, investors and all other stakeholders. These four stages are reciprocally dependent, since choices made in the earlier stages may effective influence the later stages. The second model, developed by Shane [7], embraces five stages in typifying a distinctive process to build an academic spin off. The first state is merely academic but the model also allows for tangential technologies that have the prospective to easily enable the development of new products. In cases where the researcher considers that their new technology is an invention which can be commercialized, then, they reveal it to the Technology Transfer Offices (TTO). Next, in the third stage, the prospective for intellectual property protection is estimated and a patent application may be made. Based on the limited monopoly via the patent, the TTO can either license the technology to a foundation firm or the researcher may start an academic start-up. Moving from the models by Ndonzuau et al. and Shane, Vohora, Wright and Lockett [31] provided a new perspective on the expansion of academic spin offs. Their model also has five stages, but it stresses four pivotal junctures that must be overlapped before transitioning to the next stage: i) Research (Opportunity recognition), ii) Opportunity framing (Entrepreneurial commitment), iii) Pre-organization (Threshold of credibility), iiii) Re-orientation, iiiii) Threshold of sustainability (Sustainable returns). Considering the above arguments, it is worthwhile to observe that the awareness demonstrated by literature in the success factors and supporting mechanisms of university entrepreneurship, through ASOs, has increased in the last years [15]. Indeed, several scholars [32;33] deal with the elements fostering their creation and growth, which are classified into different categories. A first category refers to the institutional supporting measures [26] such as government laws, financial and non-financial incentives. A second type is associated to university policies [34] such as business plan competitions, spin-off regulations, university business incubators. The third, instead, refers to the external critical factor of the spin off activity [35] such as, for example, entrepreneurial support mechanisms, venture capital, science parks, proximity to parent organization and prospects available from industry. Finally, a fourth type is related to the technology features [36], e.g. the prospective of commercialization, the appropriability and the value to customers. Often scholars [37] associate features affecting the growth dynamics of academic spin-offs with three different levels of analysis, employed to
69
investigate the phenomenon with a more comprehensive approach: micro, meso and macro levels. Regarding the first level of analysis, the macro one, the focus is on the national systems of innovation and, above all, on the role that policy-makers may have in the foundation of academic spin-offs [26;32]. Hence, the studies on the creation of academic spin-offs focus on the occurrence of venture capitalists, legal protection of innovations, regional infrastructures and on the business environment in which the universities are regulated but, at the same time, they are less interested in what is happening within the parent organization, which is the university. That’s the reason why the theoretical framework that helps to explain the effects generated at the macro level of analysis – particularly as regards the NTBFs, of which the ASOs are a specific typology – is the Knowledge Spillover Theory of Entrepreneurship applied to the regional context [38]. As for the meso level of analysis, this is focused on the study of university and the TTO and tries to identify the fostering mechanisms or factors by which universities promote the effective creation/development of academic start-ups [39;40], as well as, it tries to explore the success of spinning out processes such as a university technology transfer mechanism. Frequently, the theoretical framework used to carry out this type of analysis is the Resource-Based View, according to which internal factors define or influence the formation of academic spin-offs. Lastly, the last level of analysis, the micro one, concerns the role played by the individual characteristics of the entrepreneurs or the managerial team, jointly with their social ties, in encouraging the spinout foundation process. In this case, the theoretical framework of reference involves the field of Entrepreneurial
Theories [41;42], which studies the individual characteristics, in conjunctions
with the Resource-Based View which explores the personal assets influencing and affecting the foundation of the academic spin-offs [43]. Following a theoretical approximation, the first two levels of analysis can be attributed to those ones which the literature defines university fostering mechanisms of academic entrepreneurship [26;32;35], while the second may be included in those contextual elements which form the local context factors in the development of the academic spin-offs [15].
3 Earnings management in SMEs
Earnings management can be loosely defined as a strategy of generating accounting earnings, which “is accomplished through managerial discretion over accounting choices and operating cash flows” [44]. It occurs when managers use judgment in financial reporting and in structuring transactions to alter financial reports to either mislead some stakeholders about the underlying economic
70
performance of the company or to influence contractual outcomes that depend on reported accounting numbers [45]. Earnings management is an umbrella for acts that affect the reported accounting earnings or their interpretation, starting from production and investment decisions that partly determine the underlying economic earnings, going through the choice of accounting treatment and the size of accruals when preparing the periodic reports, and ending in actions that affect the interpretation of the reported earnings. Not all earnings management is misleading. Investors, for example, prefer to separate persistent earnings from one-time shocks. Firms that manage earnings in order to allow investors to better distinguish between the two components do not distort earnings. On the contrary, they enhance the informational value of their reported earnings. Thus, depending on the will to signal of hide the short or long term performance, it can be beneficial, pernicious or neutral [46]. The studies usually relate the level and type of the earning management adopted by firms with the interests of the key players on the financial accounting scene, which can be grouped into three main categories: management, users and gatekeepers or monitors [46]. Management reports earnings, users use earnings as an input to their decision making, and gatekeepers provide valuable signals to other users regarding the credibility and the informational value of the reported earnings [47]. The literature about earnings management has mainly explored the effect of these key players in large firms because financial information published by these firms is easily accessible. Large companies are generally listed companies with publicly available financial information while SMEs are subject to less demand for financial information. In the last years. the literature is focusing on the level and type of earnings management in SMEs as a result of intuition that firm size affects the incentives to this practice. There should be a little interest of management in managing earnings in SMEs for its own advantages because small companies are less subject to agency problems, especially when shareholders and managers are the same people, like in family firms. However, incentives to manage earnings also exist in SMEs when the company needs external financing, for example from banks. Also tax purposes are often advanced to explain accounting choices in small firms, especially when alignment between financial and tax reporting is high [48]. On one hand, several studies tried to explain the objectives of financial reporting in SMEs. Lavigne [49] shows that, according to the managers of Canadian SMEs, financial reporting respond to both internal management and tax purposes. He shows that structural factors, such as firm size, ownership structure and debt also influence accounting policies. In the same context of Canadian firms, Maingot and Zeghal [50] find that the objectives of financial reporting are linked to taxes and debt. The performance of the firm can also influence financial reporting. Saboly [51] shows that managers of small distressed firms can manage earnings to influence stakeholders. In Australia, McMahon [52] finds that financial reporting quality
71
in SMEs is associated with firm size, but not with performance and growth. On the other hand, literature has also focused on the issue of earnings management’s intensity and typology in comparative terms between SME’s and large firms. Moses [53] finds evidence that large firms have a bigger incentive to smooth earnings than small firms and Michaelson, James, and Charles [54] also find consistent evidence. Differently, Albrecht and Richardson [55] find evidence that large firms have less incentive to smooth earnings than small firms. Burgstahler and Dichev [56] analyze the impact of earnings management on the company's losses, in a sample of 300 companies and the results show that large firms and small ones manage their earnings in order to avoid small losses or small profits decline. Rangan [57] finds a significant relationship between earnings management and performance of experienced equity offerings. He suggests that older and largest firms were maneuvering the current accruals to exaggerate the earnings of the experienced equity offerings. Degeorge, Patel, and Zeckhauser [58] indicate that large companies manipulate the earnings of the company to avoid the negative earnings. Lee and Choi [59] also find that firm size is a variable that could influence a firm's tendency to manage earnings: smaller firms are more likely to manage earnings to avoid reporting losses than larger firms. Barton and Simko [60] show that big companies face more influence to get the analysts’ demands to manage earnings more effectively. Nelson, Elliott, and Tarpley [61] showed that sometimes auditors might ignore the earnings management of large sized firms. He argues that, since audit fees increase with client size, the probability of adjustments in the financial statements by the auditor becomes lower when increasing the client size. Ching, Firth, and Rui, [62] examine that whether unrestricted current accruals forecasted the returns and earnings performance and resulted that larger firms manipulate current accruals to overstate earnings than the small sized firms. Siregar and Utam [63] find inconsistent evidence with regard to the impact of firm size on type of earnings management while Persons [64] analysis of frauds reveals evidence of more fraudulent activity in smaller firms. The contributions above outlined testify that literature do not converge towards a homogeneous scenario and demonstrate that there is still much to say about SME’s propensity to earnings management.
4 Beneish Manipulation-Score for Italian ASOs
Literature on earnings management examines the amount of discretionary and non discretionary accruals within the financial statement, considering these values the main sources of manipulation. The pioneering Healy [65] contribution assumes that profits derive from a cash part and accruals, the72
increase of which denotes the presence of a not really cashed income and hence more maneuverable. Accruals include revenue and expenditure that have taken place in a certain period, but that did not generate a cash flow during the same period. Discretionary accruals are measured as the accruals that cannot be explained by a change in sales and the level of fixed assets, thus, their measure will capture changes in any number of expenses, some revenues, and changes in various working capital accounts. Marquardt and Wiedman [66] demonstrate that firms issuing equity manage accruals by increasing revenue and decreasing depreciation expense. In other researches [67] emerge that changes to pension assumptions, inventory method, depreciation method and estimates, as well as LIFO liquidations are used to manage earnings. Other researches associate manipulation of results sudden adoption of more favourable credit terms, the increase in product inventories, the increase in discretionary spending such as research and development, advertising and maintenance [68]. As a result of the earnings management research the analyst will understand that some firms manipulate accounting numbers to manage earnings and that the vehicles chosen for manipulation vary in predictable ways. Other than the earnings number, however, it is not known in any given context which numbers are likely to have been manipulated. DeAngelo et al. [69] state that abnormal changes in accruals between one year and the other are associated with intentional distortion of income, related to the managers’ desire to increase their profit margins in order to achieve their goals. There are different models that estimate accruals, based on statistic index or accounting ratios. The most popular models are the DeAngelo Model (1986), Healy Model (1985), Jones Model (1991) and the Modified Jones Model (Dechow, Sloan, and Sweeney 1995), the Industry Model [45], the Cross-Sectional Jones Model [70] and the Beneish M-score [71]. The first seven models attempt to measure the earning manipulation through the ratio between the discretionary and non discretionary accruals and three of them, the Industry Model, the Healy Model and the Jones Model, are estimated over an eight-year period ending just prior to the event year. In this analysis we use the Beneish model adapted to Italian SMEs by Giunta, Bini and Dainelli [72], which consider the disparate effects on accruals played by the Italian accounting principles. Beneish M-Score is a mathematical model that adopts some financial metrics to identify the extent of a company’s earnings. This model observes the value alteration phenomena in non-listed companies, where value emerges mainly from the financial statements. The original Manipulation score (M-score) includes an intercept and eight variables that capture the financial statement distortions that can result from earnings manipulation or that indicate a predisposition to engage in earnings manipulation [73]. One advantage of the M-score is that the treatment sample consists of firm that have indeed managed earnings and that determination is independent of abnormal accrual models [71]. The formula is as follows:
73
1) M-score8= -4,840 + 0.920DSRI + 0.528GMI + 0.0404AQI + 0.892SGI + 0.115DEPI – 0.172SGAI - 0.327LVGI + 4.679TATA
Days Sales in Receivables Index (DSRI) measures the ratio of days that sales are in accounts receivable in a year compared to that of a prior year and an index higher than 1 describes the increased percentage of non cash sales compared to the prior year. A disproportionate increase in accounts receivable may be indicative of inflated revenues. Gross Margin Index (GMI) measures the variation of gross operating margin and when it’s greater than 1 shows that the profit has worsened in the period under review with the consequence that the firm is likely to manipulate its revenues. Asset Quality Index (AQI) is the ratio of current (CA) and non current asset (property, plants and equipments-PPE) to total assets in one year to a prior year. An increase in AQI index may represent additional expenses that are being capitalized to preserve profitability [71]. Indeed, an index greater than 1indicates that the firm has potentially increased its cost deferral or increased its intangible assets, implementing a potential earnings manipulation. Sales Growth Index (SGI) is a measure of growth in revenue and if it’s greater than 1 there is a positive growth in the year under review. Callen et al. [74] show that the likelihood of revenue manipulation is increasing with the credit loss ratio, leverage and with the volatility of equity returns and with the ratio of accounts receivable to sales. Depreciation Index (DEPI) is the ratio of depreciation expense and gross value of PPE in one year over a prior year. An index above 1 could be a reflection of an upward adjustment of the useful life of PPE. Leverage Index (LVGI) measures the ratio of total debt to total assets, describing the long-term risks of a company. An index of greater than 1 is interpreted as an increase in the gearing of the company and for that matter exposed to manipulation. Total Accruals to Total Assets Index (TATA) measures the quality of cash flows of the firms. The total accruals metric is computed as change in current assets (except cash and equivalent) less depreciation and the current portion of debts. An increasing degree of accruals as part of total assets would indicate a higher chance of manipulation. Another version of the index was empirically derived from the University of Lille with another European companies samples [72]. In this case only 5 variables were significant for the purpose of earning manipulation. The formula assumes the following definition:
2) M-score5 = -6,065 + 0.823DSRI + 0.906GMI + 0.593AQI + 0.717SGI + 0.107DEPI
Empirically, when the M-score5 is greater than -2.22 is high the probability of earning manipulation. Some of these variables (DSRI, GMI and TATA) describe the firms’ ability to generate cash and profits from their business
74
operations. Two of them (SGI and LVGI) try to capture the company’s skills and motivations that could lead to the manipulation of accounting rules. Finally, the others (AQI, DEPI and SGAI) evaluate investments in assets of the firm and the ability to control costs. The application of models based on the estimation of accounting parameters affected by accounting principles applicable in Italy requires a revision in the calculation of the indicators and in their selection. Applying the initial formula to a sample of Italian listed companies, Giunta et al. [73] found a large number of false positives and a predictive power of less than 47%. For this reason the model has been adapted to the Italian system, dominated by SMEs who base their financial statements on the Civil Code rules, on national accounting principles (OIC) based on the principle of prudent estimates of costs and provisions. Readjustment affected the structure and the number of variables and related weights. SGI and TATA indicators were removed considering their low significance in the sample for the earning manipulation event. Therefore, the formula that we could consider for Italian SMEs is the following [72]:
3) M-scoreIt = - 6,2273 + 0.448DSRI + 0.1871GMI + 0.2001AQI + 0.2819DEPI + 0.6288LVGI
The variable weights were estimated using the maximum likelihood analysis, starting from a sample of manipulative society compared with a control group of non-manipulative firms. In this case, the cut-off value for M-score is -4.14. Giunta et al. (2014) shows that with this value the model reduces the errors for false positive at level 7.14% and correctly identifies the 92% of manipulations.
Table 1 describes the formula for each variable considered for M-score; in this analysis we compare M-score5 and M-scoreIt.
Table 1 – Variables description
Code Name Formula
DSRI Days Sales in
Receivables Index (Accounts receivables1) t/Salest) / (Accounts receivablest-1/Sales
t-GMI Gross Margin
Index [(Revenues [(Revenues t – Costs of Goods sold t-1 – Costs of Goods sold t)/ Revenues t-1)/ Revenues t ] t-1 ] /
AQI Asset Quality
Index {1 – [(CA 1)/Total assets t +PPE t-1]} t)/Total assets t] } / {1 – [(CA t-1 +PPE
t-where CA = Current assets
PPE = property, plant and equipment
DEPI Depreciation Index [Depreciation and amortizationt-1 / (Depreciation and
amortizationt-1 + PPE t-1)] / [Depreciation and amortizationt /
(Depreciation and amortizationt + PPE t)]
LVGI Leverage Index (Total Debts t / Total Assets t) / (Total Debts t-1 / Total Assets
t-1)
75
5 Research model and results
In order to analyse the effects of Beneish model in signalling the manipulative firms, the research observes a sample of Italian academic spin offs born in 2004 and 2005 and existing until 2015, taken from the database of national network of Italian academic spin offs and patents (Netval). This analysis considers the performances during the period 2009-2010, just after the beginning of the financial crisis, that is considered a pivotal event for earning managements. Data were collected through Infocamere database (the national register of Italian companies), AidaBvdep system and from company websites. We excluded the inactive firms, those with no financial statements after the 2010, distressed firms and others in liquidations. The final sample includes 99 firms, around the 12% of those academic spin offs existing on Netval database in 2010 and 66% of those born in 2004-2005. The variation index of the net income in the period t-t-1
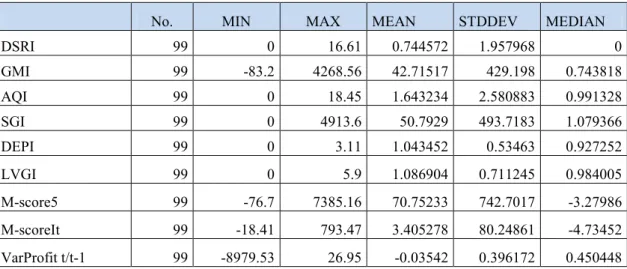
is the proxy used to estimate the manipulation risk. Descriptive statistics in Table 2 show the higher volatility of GMI and SGI indicators that affect the value of M-score5. The mean value of In table 2 we compare the M-score5 model with M-scoreIt. Always for SGI index, the median value exceeds the unit, showing for it a high associated risk of earnings manipulation related to the revenues management.
Table 2 – Descriptive statistics
No. MIN MAX MEAN STDDEV MEDIAN
DSRI 99 0 16.61 0.744572 1.957968 0 GMI 99 -83.2 4268.56 42.71517 429.198 0.743818 AQI 99 0 18.45 1.643234 2.580883 0.991328 SGI 99 0 4913.6 50.7929 493.7183 1.079366 DEPI 99 0 3.11 1.043452 0.53463 0.927252 LVGI 99 0 5.9 1.086904 0.711245 0.984005 M-score5 99 -76.7 7385.16 70.75233 742.7017 -3.27986 M-scoreIt 99 -18.41 793.47 3.405278 80.24861 -4.73452 VarProfit t/t-1 99 -8979.53 26.95 -0.03542 0.396172 0.450448
76
Table 3 – Comparative analysis for M-score
High Risk Low risk
M-score5 33% 66%
M-scoreIt 31% 69%
According to model based on 5 variables, the 33% of the sample presents a high risk of earnings manipulation, while the M-scoreIt identifies a lower number of potentially manipulative firms, despite it assumes a lower threshold value. Thinking about possible sources of bias, we may assume that the variable with the greatest impact on the difference of the two scores is associated with fluctuations in sales revenue (SGI), considering the high standard deviation that takes in the sample. The reasons can be adduced both to the fact that SGI is not scaled by total assets, as happens for the other and also for the nature of academic spin offs. In fact, the instability in sales is quite common and frequent in these firms, whereas many of them have to wait long periods before concluding the development of research and bring to market the goods obtained. However, the gap between the two indices is rather small, is to be concluded that the classification to which they lead is quite similar, therefore emerges not a significant contribution from the M-scoreIt model in discriminating manipulative companies compared to the M-score5 based on accruals. Considering that the Beneish M-score is a probabilistic model, its limit is that the ability to detect potential fraud is not with 100% accurancy. For this reasons in this analysis we consider only the risk of profit manipulation, linking the variation of net income to the M-score variables, examining the linear regression as follows:
4) VarProfit = β0 + β1DSRI+ β2GMI + β3AQI+ β4DEPI + β5LVGI + β6SGI +
εi
The stepwise procedure (Table 4) shows that only the AQI is significant to explain the variation of net income in the period observed. AQI in the sample assumes a mean value greater than 1 and a median value close to 1 that could indicate that the academic spin offs have potentially increased the deferred cost. The negative coefficient in the regression analysis shows that when the firms increase the capitalization of cost related to intangible assets, such as R&D costs, the variability of profit decreases between one period and another, leaving to hypothesize that the budgeting of costs related to R&D could ensure a certain stability in the level of profit. Therefore, the systematic capitalization of these deferred costs would allow to homogenize the income levels over time, leaving to assume the existence of an earnings management policy.
77
Table 4 – Regression analysis
Model
non-standardized
coefficients standardized coefficients
t Sig.
B std.error Beta
1 Costant 64,384 102,790 ,626 ,533
AQI -92,196 33,884 -,264 -2,721 ,008
Stepwise selection: prob F in <=0,050; prob F out>=0,100
Model R R-Square R-Square Adj Std. error
1 ,264(a) ,070 ,060 866,29650
a. (Constant), AQI
6
Conclusion
Literature on earning management has largely focused on methods able to detect manipulative companies, minimizing classification errors, considering that the inadequacy of the calculation method can lead to important social and economic consequences. If on one hand the statistic accrual prediction models neglect some operational dynamics of the company and don’t describe in a significant way the phenomena when the samples are small, on the other hand, the accounting models are less stringent, and built on the basis of accounting standards adopted in selected countries. This paper assumes that in earnings management analysis is important consider the contingent features of the business, of corporate governance, the economic situation and the specific accounting rules of each country. These items affect the business trend of the firms, influencing the accounting policies and favouring opportunistic behaviour. Applying the Beneish M-score model to a sample of Italian SME, in order to detect earnings management, rather than forecasting fraud and financial distress, we didn’t found deep differences between the adjusted version of M-scoreIt and the simplified model for the European firms. Regression analysis also confirmed that the typicality of economic activity, from which descend the investment decisions, is the most effective on the variability of profit margins so for the purpose of detection of earnings management should be considered also expressive variables of this situation. An appropriate weighting system could adequately quantify the impact of sectoral differences, as well as the company size, then the complexity of corporate governance.
78
Bibliography
[1] Davidson S., Stickney, C.P. and Weil, R.L. (1987) Accounting: The
Language Of Business, Sun Lakes, Ariz.: T. Horton.
[2] Healy P., and Wahlen, J. (1999). A Review of the Earnings Management Literature and Its Implications for Standard Setting. Accounting Horizons, 13(4), 365–383.
[3] Giroux G. (2004) Detecting Earnings Management, New York: John Wiley & Sons.
[4] Hansen, G. A. (1996) Do discretionary accrual proxies measure earnings management?, Working paper, University of Rochester.
[5] Subramanyam K. R., (1996), The Pricing of Discretionary Accruals, Journal
of Accounting and Economics, vol. 22, 1-3, pp. 249-281
[6] Wright M., S. Birley, and S. Mosey (2004), Entrepreneurship and technology transfer, The Journal of Technology Transfer, vol. 29, no. 3–4, pp. 235–246. [7] Shane S. (2004), Academic entrepreneurship: University spinoffs and wealth creation. Edward Elgar Publishing, Northampton, MA.
[8] Wright M., B. Clarysse, P. Mustar and A. Lockett (2007), Academic Entrepreneurship in Europe. Edward Elgar, Cheltenham, UK.
[9] Roberts E. B. and D. E. Malone (1996), Policies and structures for spinning off new companies from research and development organizations, R&D Management, vol. 26, no. 1, pp. 17-48.
[10] Mustar P. (1997), How French academics create hi-tech companies: the conditions for success or failure, Science and Public Policy, vol. 24, no. 1, pp. 37-43.
[11] Carayannis E. G., E. M. Rogers, K. Kurihara and M. M. Allbritton (1998), High-technology spin-offs from government R&D laboratories and research universities, Technovation, vol. 18, no. 1, pp. 1-11.
[12] Steffensen M., E. M. Rogers and K. Speakman (2000), Spin-offs from research centers at a research university, Journal of Business Venturing, vol. 15, no. 1, pp. 93-111.
[13] Clarysse B., M. Wright, A. Lockett, E. Van de Velde and A. Vohora (2005), Spinning out new ventures: a typology of incubation strategies from European research institutions, Journal of Business venturing, vol. 20, no. 2, pp. 183-216.
79
[14] Pirnay F., and B. Surlemont (2003), Toward a typology of university spin-offs, Small Business Economics, vol. 21, no. 4, pp. 355-369.
[15] Sternberg R. (2014), Success factors of university-spin-offs: Regional government support programs versus regional environment, Technovation, vol. 34, no. 3, pp. 137-148.
[16] Lockett A. and M. Wright, “Resources, capabilities, risk capital and the creation of university spin-out companies”, Research Policy, vol. 34, no. 7, pp. 1043-1057, 2005.
[17] Bessant J., and J. Tidd (2011), Innovation and entrepreneurship. John Wiley & Sons, UK.
[18] Wright M., and Fu, K. (2016). University Spin-outs: What do we know and what are the policy implications? Evidence from the UK. Journal of Innovation
Management, 3(4), 5-15
[19] Degroof J. J. and E. B. Roberts (2004), Overcoming weak entrepreneurial infrastructures for academic spin-off ventures, The Journal of Technology Transfer, vol. 29, no. 3-4, pp. 327-352.
[20] Mustar P., M. Wright and B. Clarysse (2008), University spin-off firms: lessons from ten years of experience in Europe, Science and Public Policy, vol. 35, no. 2, no. 67-80.
[21] Iacobucci D. and A. Micozzi (2014), How to evaluate the impact of academic spin-offs on local development: an empirical analysis of the italian case, The Journal of Technology Transfer, pp. 1-19.
[22] Kenney M. and D. Patton (2011), Does inventor ownership encourage university research-derived entrepreneurship? A six university comparison, Research Policy, vol. 40, no. 8, pp. 1100-1112.
[23] Dahlstrand A.T.L., Smith, H.L. and Baines, N. (2016). Academic Entrepreneurship: Spin-offs in Sweden and the UK. In University Evolution,
Entrepreneurial Activity and Regional Competitiveness, pp. 127-150, Springer
International Publishing.
[24] Tödtling F., L. Lengauer and C. Höglinger (2011), Knowledge sourcing and innovation in “thick” and “thin” regional innovation systems— comparing ICT Firms in two Austrian regions, European Planning Studies, vol. 19, no. 7, pp. 1245-1276.
[25] Dahlander L. and D. M. Gann, D. M. (2010), How open is innovation?, Research policy, vol. 39, no. 6, pp. 699-709.
80
[26] O’Shea R. P., T. J. Allen, A. Chevalier and F. Roche (2005), Entrepreneurial orientation, technology transfer and spinoff performance of US universities, Research Policy, vol. 34, no. 7, pp. 994-1009.
[27] Villasalero M. (2014), University knowledge, open innovation and technological capital in Spanish science parks: Research revealing or technology selling?, Journal of Intellectual Capital, vol. 15, no. 4.
[28] Conti G., Granieri M., Piccaluga A., (2011), La gestione del trasferimento tecnologico. Strategie, Modelli e Strumenti. Springer, Milano.
[29] Nicolaou N. and Birley, S. (2003). Academic networks in a trichotomouscategorisation of university spinouts. Journal of Business
Venturing, 18(3), 333-359.
[30] Ndonzuau F. N.,, Pirnay, F., and Surlemont, B. (2002). A stage model of academic spin-off creation. Technovation, 22(5), 281-289.
[31] Vohora A., Wright, M., and Lockett, A. (2004). Critical junctures in the development of university high-tech spinout companies. Research policy, 33(1), 147-175.
[32] Di Gregorio D. and S. Shane (2003), Why do some universities generate more start-ups than others?, Research policy, vol. 32, no. 2, pp. 209-227.
[33] Grimaldi R.and A. Grandi (2005), Business incubators and new venture creation: an assessment of incubating models, Technovation, vol. 25, no. 2, pp. 111-121.
[34] Link A. N. and J. T. Scott, “Opening the ivory tower's door: An analysis of the determinants of the formation of US university spin-off companies”, Research Policy, vol. 34, no. 7, pp. 1106-1112, 2005.
[35] Fini R., R. Grimaldi, S. Santoni and M. Sobrero (2011), Complements or substitutes? The role of universities and local context in supporting the creation of academic spin-offs, Research Policy, vol. 40, no. 8, pp. 1113-1127.
[36] Lehoux P., G. Daudelin, B. Williams-Jones, J. L. Denis and C. Longo (2014), How do business model and health technology design influence each other? Insights from a longitudinal case study of three academic spin-offs, Research Policy, vol. 43, no. 6, pp. 1025-1038.
[37] Djokovic D.and V. Souitaris (2008), Spinouts from academic institutions: a literature review with suggestions for further research, The Journal of Technology Transfer, vol. 33, no. 3, pp. 225-247.
[38] Audretsch D. B. and E. E. Lehmann (2005), Does the knowledge spillover theory of entrepreneurship hold for regions?, Research Policy, vol. 34, no. 8, pp. 1191-1202.
81
[39] Carayol N. and M. Matt (2004), Does research organization influence academic production?: Laboratory level evidence from a large European university”, Research Policy, vol. 33, no. 8, pp. 1081-1102.
[40] Muscio A (2008). Il trasferimento tecnologico in Italia: risultati di un’indagine sui dipartimenti universitari. L’industria, rivista di economia e
politica industriale, n. 245.
[41] Cuevas J. G. (1994), Towards a taxonomy of entrepreneurial theories, International Small Business Journal, vol. 12, no. 4, pp. 77-88.
[42] Ardichvili A., R. Cardozo and S. Ray, “A theory of entrepreneurial opportunity identification and development”, Journal of Business venturing, vol. 18, no. 1, pp. 105-123, 2003.
[43] Landry R., N. Amara and M. Ouimet (2007), Determinants of knowledge transfer: evidence from Canadian university researchers in natural sciences and engineering, The Journal of Technology Transfer, vol. 32, no. 6, pp. 561-592. [44] Phillips J., Pincus, M., and Rego, S. O. (2003). Earnings Management: New Evidence Based on Deferred Tax Expense. The Accounting Review, 78(2), 491–521. [45] Dechow, P.M., R.G. Sloan and A.P. Sweeney. (1995). Detecting Earnings Management, The Accounting Review, 70, 193-225.
[46] Ronen J. and Yaari, V. (2008). Earnings Management Emerging Insights in Theory, Practice and Research, Springer, New York.
[47] Coffee J. C. Jr, (2002). Understanding Enron: It’s About the Gatekeepers, Stupid. The Business Lawyer, (207), 1403–1420.
[48] Ball R., Kothari, S. P., and Robin, A. (2000). The effect of international institutional factors on properties of accounting earnings. Journal of Accounting and Economics, 29(1): 1-51.
[49] Lavigne B. (1994), Contribution a l’e tude de la gene se des e tats financiers des PME. Comptabilite -Contro le-Audit, 8 (1): 25-44.
[50] Maingot M. and Zeghal, D. (2006). Financial reporting of small business entities in Canada. Journal of Small Business Management, 44(4), 513–530. [51] Saboly M. (2001). Information comptable et de faillance des entreprises: le cas franc ais. Comptabilite -Contro le-Audit, 7 (2): 67-86.
[52] McMahon R., (2001). Business growth and performance and the financial reporting practices of Australian manufacturing SMEs. Journal of Small Business Management, 39(2), 152–164.
[53] Moses O.D.(1987). Income smoothing and incentives: Empirical tests using accounting changes. Accounting Review, 62(2), 358–377.
82
[54] Michaelson S. E., James, J. W., and Charles, W. (1995). A market based analysis of income smoothing. Journal of Business Finance and Accounting, 8(4), 1179−1195.
[55] Albrecht W. D. and Richardson, F. M. (1990). Income smoothing by economy sector. Journal of Business Finance & Accounting, 17(5), 713–730. [56] Burgstahler D. and Dichev, I. (1997). Earnings management to avoid earnings decreases and losses. Journal of Accounting and Economics, 24(1), 99– 126.
[57] Rangan S., (1998). Earnings management and the performance of seasoned equity offerings. Journal of Financial Economics, 50(1), 101–122.
[58] Degeorge F., Patel, J., and Zeckhauser, R. (1999). Earnings Management to Exceed Thresholds. The Journal of Business, 72(1), 1–33.
[59] Lee B.B. and Choi, B. (2002). Company size, auditor type, and earnings management. Journal of Forensic Accounting, III, 27−50.
[60] Barton J. and Simko, P. J. (2002). The balance sheet as an earnings management constraint. Accounting Review (Vol. 77, pp. 1–27).
[61] Nelson M.W., Elliott, J. A. and Tarpley, R. L. (2002). Evidence from auditors about managers’ and auditors' earnings management decisions. Accounting Review. Vol. 77, pp. 175–202.
[62] Ching K.M.L., Firth M. and Rui, O. M. (2006). Earnings Management, Corporate Governance and the Market Performance of Seasoned Equity Offerings in Hong Kong. Journal of Contemporary Accounting & Economics, 2(1), 73–98.
[63] Siregar S.V. and Utama, S. (2008). Type of earnings management and the effect of ownership structure, firm size, and corporate-governance practices: Evidence from Indonesia. International Journal of Accounting, 43(1), 1–27. [64] Persons O. S., (2011). Using Financial Statement Data To Identify Factors Associated With Fraudulent Financial Reporting. Journal of Applied Business Research, 11, 38–46.
[65] Healy, P.M. (1985). The Effect Of Bonus Schemes On Accounting Decisions. Journal of Accounting and Economics, 7: 85-107.
[66] MarquardtC.A. and C.I. Wiedman (2004), The Effect of Earnings
Management on the Value Relevance of Accounting Information, Journal of Business Finance & Accounting,Vol.31, n. 1-2: 297–332.
[67] Sweeney A.P. (1994), Debt-covenant violations and managers’ accounting responses. Journal of Accounting and Economics, May: 281-308.
83
[68] Cohen D.A and Zarowin P. (2010). Accrual-based and real earnings management activities around seasonal equity offerings. Journal of Accounting and Economics 50: 2-19.
[69] Deangelo H., Deangelo L. and Skinner, D.J. (1994), Accounting choices of troubled companies. Journal of Accounting and Economics 17:1l3- 143.
[70] Defond M.L and Jiambalvo, J. (1994). Debt covenant violation and
manipulation of accruals, Journal of Accounting and Economics 17: 145-176.
[71] Beneish M.D., (1999). The Detection Of Earnings Manipulation, Financial
Analysts Journal, vol. 55: pp. 24-36.
[72] Giunta F., Bini L., and Dainelli F. (2014), Verifica della base informativa per l’analisi di bilancio: le azioni di manipolazione contabile, in Controllo di gestione, n.2: 5-17.
[73] Beneish M.D.(2001). Earnings Management: A Perspective, Managerial
Finance, vol. 27:3-17.
[74] Callen J., S. Robb, and D. Segal. (2008). Revenue manipulations and restatements by loss firms. Auditing: A Journal of Practice and Theory 27(2), 1-29.