SAPIENZA Università di Roma
Dipartimento Medico-chirurgico di Scienze Cliniche, Tecnobiomediche e Medicina Traslazionale
DOTTORATO DI RICERCA IN ONCOLOGIA
Curriculum: Oncologia Digestiva
XXX Ciclo (A.A. 2016/2017)
Genetic background dictates pro-angiogenic factor
production in preclinical models of colorectal cancer
DottorandaFabiana Conciatori
Tutor: Coordinatore:
Contexts
1. Introduction 3
1.1 Colorectal cancer. 3
1.1.1. Origin and epidemiology. 3 1.1.2. Molecular and genetic features. 4 1.2 Inflammation and microenvironment. 8
1.3 Interleukin-8. 11
1.3.1. Roles and regulation of IL-8 expression. 11 1.3.2. IL-8 signaling. 13 1.3.3. Role of IL-8 in CRC progression and metastasis. 16
2. Aim of the study 18
3. Materials and Methods 20
3.1 Cell lines. 20
3.2 Drug treatments. 21
3.3 Cell viability assay. 21 3.4 Standardization and assessment of cell culture media. 22 3.5 Western blot analysis. 23
3.6 RNA analysis. 24
3.7 Statistical analysis. 25
4. Results 26
4.1 PTEN profiling in human CRC. 26 4.2 BRAFV600E and PTEN-lossare significantly associated with
IL-8 production. 29
4.3 Analysis of VEGF and IL-6 expression. 32 4.4 BRAF inhibition modulates IL-8, but not VEGF, expression
according to the genetic background. 42 4.5 Trametinib and dabrafenib transcriptionally regulate IL-8
expression. 47
4.6 Molecular analysis of ERK and STAT3 in response to
targeted inhibitors. 50
5. Discussion and conclusions 54
6. Future prospects 63
1 INTRODUCTION
1.1 Colorectal cancer.
1.1.1 Origin and epidemiology.
Colorectal cancer (CRC) has the third highest frequency among the tumors in the Western world and represents 13% of the causes of cancer death in Italy, almost equally split between males and females [1, 2]. During the past 20 years, there has been a progressive increase in the survival and decrease in mortality, due to greater advances in surgical techniques, use of a combination of chemotherapy with targeted therapy and campaigns for primary and secondary prevention. Unfortunately, in some cases the diagnosis of CRC occurs late and after the formation of metastasis, which appear at a variable distance from surgery.
The pathogenesis of CRC is very complex and is influenced by multiple factors, some of which are related to diet and lifestyle (i.e. smoke, environmental factors, sedentary lifestyle, obesity and/or hormones) while others are related to genetic predisposition (i. e. Chron’s disease and/or colon polyps) [3]. Indeed, three types of CRC can be distinguished by their forms of origin and expression: the sporadic form (60-80%), the familial (10-20%) and the hereditary type (15%), which can be associated with familial
adenomatous polyposis (FAP) or not associated with polyposis, hereditary nonpolyposis CRC (HNPCC) [4].
1.1.2 Molecular and genetic features.
Even at the molecular level, CRCs are a very heterogeneous group of diseases and progress in a stepwise manner through dysregulation of various pathways [5]. Chromosomal instability (CIN), microsatellite instability (MSI), aberrant DNA methylation and DNA repair defects are all mechanisms involved in colorectal epithelial cell transformation and all play a significant role during the development of CRCs [6]. Moreover, during cancer development, epithelial cells from the gastrointestinal trait acquire sequential genetic and epigenetic mutations in oncogenes and/or tumor suppressor genes, leading to proliferation and metastasis (Figure 1).
Figure 1. Sequential genetic and epigenetic mutations acquired during neoplastic transformation from normal intestinal epithelium to colorectal carcinoma [5].
Several altered molecular signaling pathways are involved in CRC initiation and progression, such as Wnt/APC/b-catenin, PI3K/AKT/mTOR, RAS/RAF, MAPK pathways, p53 and
mismatch repair (MMR) [7]. APC gene mutations have been detected in 60% of sporadic colon cancers, FAPs and variants, although their distribution within the gene is different [8].
KRAS is involved in CRC initiation and progression, with mutations occurring quite early in 40-60% of cases and its mutations are identified as mechanisms of resistance to anti-EGFR monoclonal antibodies (cetuximab and panitumumab), which are currently used in therapy [9]. RAS family includes also HRAS and NRAS: NRAS mutations are found in about 3-5% of CRC and also contribute to EGFR-antibodies resistant mechanisms development [10]. Further studies have also shown that KRAS mutations are not the same: indeed, as opposed to KRAS G12V, patients with mutation in the KRASG13D codon on exon 2 may respond to EGFR monoclonal antibodies, although not to the same extent as the patients with wild-type (wt) KRAS [11]. Activating mutations in BRAF have been found in about 10% of sporadic CRC and are rare in familiar CRC. Patients with BRAFV600E mutation appear to have a poorer prognosis: indeed, BRAF is downstream of activated KRAS protein in the EGFR pathway, so the constitutive activation of BRAF renders therapeutic inhibition of EGFR ineffective. Moreover, when KRAS, BRAF, PI3K, and PTEN, the downstream effectors of EGFR signaling, are not mutated (quadruple negative) cetuximab and panitumumab show the best response in CRC [12].
Many cancer types are associated with alterations of receptor tyrosine kinases (RTKs), which are the first receivers of extracellular signals. EGFR is considered a proto-oncogene, but somatic EGFR mutations are found in less than 5% of CRC [13]. Activating mutations in PIK3CA, the gene encoding the catalytic subunit of PI3K, are somatically mutated in over 25% of CRC and represent an alternative EGFR-mediated signaling pathway [14]. PI3K signaling is deregulated through a variety of mechanisms, including the loss of phosphatase and tensin homolog deleted on chromosome 10 (PTEN), which ranges from 4 to 40 % of all CRCs. In patients with CRC, promoter hypermetilation, decreased DNA copy number and reduction of protein expression, all concur to causing an increasing inactivation of PTEN: as a consequence, loss of PTEN expression has been shown to be associated with the occurrence of metastasis and progression of disease [15].
More recently it has been discovered that also microRNA (miRNA) can actively contribute to angiogenesis, cell invasion and metastasis in CRC [16]. This complex network of different pathways, genetic and/or epigenetic changes, with the presence of a strong chronic inflammation are all involved in the pathogenesis of CRC, underlying the complexity of potential new biomarkers identification [17].
1.2 Inflammation and microenvironment.
A major contributor to the limited therapeutic success achieved by only targeting tumor cells is the tumor microenvironment (TME), with inflammation and inflammatory mediators. The connection between inflammation and tumorigenesis is well-established and in the last decade has received a great deal of supporting evidence from genetic, pharmacological, and epidemiological data. To date, it is clear that tumor stroma (including fibroblasts, inflammatory cells and endothelial cells) plays an important role in promoting tumor progression, however many of the mechanisms underlying tumor-stroma interaction (TSI) are to be identified.
Tumor stroma consists of the non-malignant cellular component of the tumor, such as cancer-associated fibroblasts (CAFs), tumor-infiltrating cells, vasculature with endothelial cells and the extracellular matrix (ECM) consisting of structural proteins and other matrix-associated molecules, such as growth factors, chemokines and cytokines [18]. Solid tumors are commonly infiltrated by immune cells, including T cells, B cells, natural killer (NK) cells, macrophages, dendritic cells (DCs), neutrophils, eosinophiles, basophiles and mast cells. Macrophages are a major component of innate immune cells and they are an example of how the immune system can act as a tumor suppressor disrupting cancer cells recognized as non-self on one hand and of how tumors can
derive benefits for survival and proliferation from the immune system itself on the other [19]. Indeed, macrophages have dual roles in neoplastic progression: they inhibit tumor growth by secreting lytic enzymes such as lysosomal enzymes and TNF-a after activation, but a distinct M2 polarized population promotes tumor cell proliferation and angiogenesis, tumor invasion and metastasis [20].
Many studies have contributed to the characterization of TME and it is now evident that tumors differ by mutations and also by their microenvironmental composition, and stromal cell proportions or activation states [21]. Numerous cell culture studies and xenograft models have shown evidence that mesenchymal stromal cells (MSCs) are recruited into the tumor site, as it happens during the healing process of wounds and scarring: in this way, inflammation promotes cancer progression and cell proliferation [22]. Similarly to MSCs, also CAFs, through the secretion of growth factors and chemokines, induce an extracellular matrix alteration and provide further oncogenic signals of proliferation and invasion to cancer cells [23]. The active contribution of tumor-associated stromal cells in tumor progression is well-known and the inflammatory cytokines, released by both cancer and stromal cells, may act as an initiator and promoter of carcinogenesis by directly increasing proliferation of epithelial cells [24]. In response to specific chemokines, different immune cell subsets migrate into the tumor
microenvironment and regulate tumor immune responses; for example, CD8+ T and NK cells are recruited by CXCL9 and CXL10, regulatory T (Treg) cells by CCL22, released mainly by macrophages and tumor cells, or macrophages by CCL2-CCR2 signaling [25].
Not only TME promotes cancer invasion and metastasis, but it also provides resistance to chemotherapy, and cancer cells upregulate chemokines expression proportionally to the progression of the disease. Although currently there is no therapy targeting chemokines to prevent CRC invasion and/or metastasis, understanding the mechanisms involved in TSI thoroughly in order to achieve a comprehensive therapy in advanced and metastatic CRC remains crucial [26].
Figure 2. Signaling of chemokines in TSI [26].
1.3 Interleukin-8.
1.3.1 Roles and regulation of IL-8 expression.
Chemokines, a family of structurally related 8-10 kDa proteins, are secreted in several tissue environments and are involved in the
regulation of inflammatory processes [27]. Chemokines are divided in 4 subfamilies (C, CC, CXC and CX3C) based on their primary structure and function: all have the main cysteine residues in their N-terminal regions.
Interleukin-8 (IL-8), alternatively known as CXCL8, is a pro-inflammatory CXC chemokine containing the ELR (Glu-Leu-Arg) motif, associated with the promotion of neutrophil chemotaxis and degranulation [28]. Indeed, IL-8 is also known as “neutrophil chemotactic factor”, because of its role in inducing chemotaxis in target cells, primarily neutrophils but also other granulocytes, causing them to migrate toward the site of infection [29]. IL-8 plays another important role in angiogenesis through stimulation of endothelial cell migration and upregulates the expression of the two metalloproteases MMP-2 and MMP-9 [30].
Expression of IL-8 is upregulated by hypoxia, cytokine and other environmental stresses, which is mediated by the transcription factors nuclear factor kappa B (NF-kB) and activating protein-1 (AP-1) [31]. It was demonstrated that the IL-8 promoter element contains NF-kB, AP-1, transcription factors C/EBP homologous protein (CHOP) and cAMP response element binding protein (CREB) binding sites [32]. NF-kB is essential for activation of IL-8 transcription, while AP-1 and CHOP are required for maximal IL-8 expression by synergizing with NF-kB in a cell-dependent manner [33]. All three mitogen- activated
protein kinase (MAPK) pathways (ERK1/2, JNK and p38) activate AP-1 and contribute to IL-8 gene expression [34]. In glioblastoma cell, it has been demonstrated that IL-8 is also a direct target of STAT3: in the presence of the tumor suppressor PTEN, STAT3 is activated by phosphorylation, binds to the IL-8 promoter, and represses IL-8 gene expression [35]. Also in prostate carcinoma, it has been demonstrated that PTEN loss induces a selective upregulation of IL-8 signaling [36].
There is an adenosine and uridine (AU)-rich RNA instability element (AUUUA) present in the 3' untranslated region of the IL-8 mRNA, that contributes to its having a short half-life: stabilization of the IL-8 mRNA is another point of IL-8 expression regulation, which is mediated by p38 MAPK [37]. The expression of IL-8 mRNA produces a precursor peptide of 99 amino acids, which then undergoes cleavage to yield the active IL-8 isoforms, a 77 amino acids in nonimmune cells or 72 amino acids in monocytes and macrophages [38].
1.3.2 IL-8 signaling.
The biological effects of IL-8 are mediated through the binding of IL-8 to two cell-surface receptors, the seven transmembrane G-protein-coupled receptors CXCR-1 8RA) and CXCR-2 (IL-8RB), which are present in various type of normal as well as tumor
cells [39]. These receptors share 77% amino acid homology and retain common structural motifs, suggesting that these genes arose through gene duplication [40]. CXCR1 is activated by IL-8 and granulocyte chemotactic protein-2 (GCP-2)/CXCL6, whereas CXCR2 can be activated not only by IL-8 but by many other CXC chemokines [41].
Ligand-receptor binding determines conformational changes, which allow the exposure of epitopes on the intracellular loops and carboxy-terminal tail of the receptor that promote coupling to
functional heterotrimeric G proteins, which consist of α, β, and γ
subunits. Ligand binding catalyzes the exchange of guanosine
diphosphate for guanosine triphosphate on the Gα subunit, which triggers the release of this subunit from the receptor and the Gβγ subunits and consequently, signals are transmitted across the membrane and activate downstream effectors [42]. The principal effector of IL-8-mediated chemotaxis in neutrophils is the kinase
phosphatidyliinnositol-3 (PI3K): the phosphorylation of
phosphatidyliinnositol-2-phosphate (PIP2) in
phosphatidyliinnositol-3-phosphate (PIP3) results in the activation and increased expression of the serine/threonine kinase AKT [43]. IL-8 signaling also regulates the activity of the MAPK signaling cascade, RAS/RAF/MEK/ERK. Activation of MAPK signaling and the downstream phosphorylation of ERK1/2 determines cell proliferation and cell survival, both in neutrophils and cancer cells
[44]. In prostate cancer models, it has been demonstrated that IL-8 mediates growth and cell migration effects via Src and FAK activation [45]. Moreover, IL-8 signaling induces vascular endothelial growth factor (VEGF)-independent tumor angiogenesis and chemotaxis of neutrophils to the tumor site via its paracrine activity [46].
IL-8 promotes proliferation, survival and migration of cancer cells via its autocrine and paracrine activity and all these pathways are involved in cancer cell survival, proliferation, mobility and invasiveness: in this way, IL-8 signaling is involved in a complex communication between tumor cells and tumor microenvironment, through both paracrine and autocrine mechanisms [47].
Figure 3. Principal signaling pathways activated by IL-8-CXCR1/2 binding, to regulate cell survival, proliferation, angiogenesis and metastasis [28].
1.3.3 Role of IL-8 in CRC progression and metastasis.
In addition to its physiological roles in chemotaxis, IL-8 is implicated in many processes involved in cancer progression, of several different histological types of tumor such as prostate, colorectal, lung cancer and melanoma. IL-8-mediated neutrophil recruitment to the tumor site can facilitate tumor progression and
clinical studies have correlated intra-tumoral neutrophils with poor prognosis in colorectal and multiple cancer [48].
In CRC patients, IL-8 expression is upregulated in tumor tissue compared with the adjacent healthy colonic tissue [49]. Moreover, germline polymorphisms of IL-8 and VEGF are associated with a higher risk of developing tumor recurrence in stage III CRC patients [50]. Elevated serum levels of several cytokines secreted mainly by tumor cells and by CAFs have a prognostic value and are also implicated in tumor aggressiveness and poor response to therapy: indeed, high levels of IL-8 in serum of patients correlate with a more advanced tumor stage [51]. Furthermore, treatment with an inhibitor of CXCR2, SCH-527123, alone and in combination with oxaliplatin, is effective in synergistically inhibiting proliferation, angiogenesis, and enhancing chemo-sensitivity in CRC cells and xenografts [52].
A significant number of in vitro and in vivo pre-clinical studies support the importance of IL-8-CXCR1/2 signaling in promoting tumor progression and multiple small-molecule antagonists and humanized monoclonal antibodies are under investigations [53]. Based on these evidences, IL-8 and its receptors may represent a novel therapeutic target in CRC, to sensitize cancer cells toward chemotherapy [54].
2
AIM OF THE STUDY.
Both tumor growth and response to antineoplastic drugs are affected by the microenvironment: investigating the stromal contribution is crucial for the development of new therapeutic strategies, as suggested, for example, by the use of chemotherapy plus bevacizumab, a VEGF inhibitor, in the treatment of colorectal carcinoma. In addition to VEGF, many recent studies demonstrate that IL-8 plays a key role in cancer progression and metastatization, in many cancer models (including CRC), thus providing additional possibilities for targeted intervention.
We previously demonstrated that PTEN-loss predicts synergistic
growth-inhibitory interactions between RAF/MEK and
PI3K/AKT/mTOR inhibitors, in a panel human cancer cell lines of different histological origin, including CRC [55]. Moreover, preliminary results show that in an isogenic CRC cell lines only
differing for PTEN status, IL-8 is over-expressed in PTEN-/-.
The aim of the study is to investigate how the specific genetic background of CRC cells influences their expression of chemokines and proangiogenic factors, such as IL-8, and how these are modulated in response to different signaling inhibitors (BRAF, MEK, ERK1/2, PI3K/AKT). First, we quantitatively analyzed chemokines and cytokines released into the culture medium of different CRC cell lines, under standardized culture
conditions to overcome the possibility that different number of cells alter the expression of chemokines. Next, we evaluated the effect of different drugs (trametinib, dabrafenib and gedatolisib) on chemokine production in different specific genetic backgrounds.
3 MATERIALS AND METHODS
3.1 Cell lines.
CRC cell lines were kindly provided from Federica Di Nicolantonio (University of Turin, Turin, Italy) [56]. X-MAN™ HCT116 Parental and HCT116 PTEN-/- were generated by Horizon
from homozygous knock-out of PTEN by deleting exon 5 which encodes the active site of the protein in the CRC cell line HCT116 (Horizon Discover www.horizondiscovery.com). Isogenic cell lines HCT116, HK2-6 and HKE-3 and DLD-1, DKO-1 and DKO-4 were performed by Shirasawa’s group by gene targeting technique [57].
Cell lines were routinely maintained in RPMI 1640 or DMEM medium supplemented with 10% fetal bovine serum (FBS), 2 mM L-glutamine, and antibiotics (Pen/Strep) in a humidified atmosphere with 5% CO2 at 37 °C. For hypoxic treatment, cells were incubated for 24 hours in specially designed aluminum chambers, flushed with a gas mixture containing 5% CO2 and 95% N2 (Biroccio A. et l., 2000). Cell culture reagents were purchased from Euroclone and Invitrogen (Milan, Italy).
3.2 Drug treatments.
Trametinib (GSK1120212) and dabrafenib (GSK2118436) were kindly provided by GlaxoSmithKline (Brentford, Middlesex, UK). Gedatolisib (PF05212384) was kindly provided by Pfizer Inc. (New York, NY, USA). Trametinib and gedatolisib were dissolved in DMSO as a 1 mM stock solution and stored at -20°C or -80°C, respectively. Dabrafenib was dissolved in DMSO as a 10mM stock solution and stored at -20°C. SCH772984 was purchased by Selleck Chemicals and dissolved in DMSO as 0.2 mM stock solution and stored at -20°C. Stattic and S3I-201 were purchased by Selleck Chemicals and dissolved in DMSO as 5 mM stock solution and stored at -80°C.
The final concentration of drugs was obtained by dilution with culture medium.
3.3 Cell viability assay.
For cell counting, Thoma chamber was used. Effects on cell growth in response to different treatments were monitored by Crystal Violet assay. For Crystal Violet assay, a fixed number of tumor cells were dispensed into 24-wells (NEST Biotechnology), and the following day cells were treated at indicated concentrations of drugs. After 72 hours of treatment, the cells were washed with PBS, fixed with 4% formaldehyde for 10 minutes and then stained
with 0.1% crystal violet for 40 minutes, at room temperature. Excess stain was removed with water and the plates were dried. Crystal violet stain was extracted with 95% acetic acid and the absorbance was measured at 570 nm.
The dose of drug that causes 50% of cell growth inhibition (IC50 value) was calculated according to the Chou-Talalay method using the Calcusyn software (Biosoft, Cambridge, United Kingdom).
3.4 Standardization and assessment of cell culture media.
In order to overcome the possibility that a different number of cells alter the results in the analysis of the chemokines, growth curves for each CRC cell line were assessed at different cell concentrations to evaluate their growth.
Standardization: All cell lines were plated into 60x15 dishes (Falcon BD) to have about 1x10⁶ cells after 48 hours of plating. After 24 hours from the plating, the culture medium was replaced by serum-free medium, and after 24 hours, media were collected and cells were counted.
Assessment: CRC cell culture media were analyzed in triplicate as per the manufacturer's instructions using human IL-8, IL-6 and VEGF specific ELISA, purchased from Enzo Life for 8 and IL-6 analysis and from R&D Systems for VEGF. Absorbance was read at 450 nm. IL-8, IL-6 and VEGF expression was represented
as pg/mL and then related to the control. HCT116 Parental and HCT116 PTEN-/- culture media were analyzed by Human Angiogenesis Antibody Array, according to the manufacturer's protocol.
3.5 Western blot analysis.
Whole cell extracts were obtained by NP-40 lysis buffer, containing 50 mmol/L Tris-HCl (pH 8.0), 250 mmol/L NaCl, 1 mmol/L EDTA, 100 mmol/L NaF, 1 mmol/L NaVO4, 10 mmol/L PMSF, 10 µg/mL leupeptin, 1% NP40. Assay sample for protein concentration used was BCA (Protein Assay Reagent A, Protein Assay Reagent B 50x, Pierce). An amount of total cell lysate was fractionated by SDS-polyacrylamide gel electrophoresis and transferred to nitrocellulose membrane (Amersham, Arlington Heights, USA). Membranes were probed with the following primary antibody: phosphorylated (Thr202/Tyr204) and total ERK1/2, PTEN, phosphorylated (Ser727 and Tyr705) and total STAT3 (from Cell Signaling Technology Inc. Beverly, USA). Signal was detected using peroxidase-conjugated anti-mouse or anti-rabbit secondary antibodies (Jackson Immunoresearch Labs, Inc., Baltimore, USA). The enhanced chemi-luminescence (ECL) system (Amersham) was used for detection and image detection was performed with UVITEC Alliance 4.7 system (Cambridge,
UK). To control the amount of proteins transferred to nitrocellulose membrane actin was used and detected by anti β-actin mAb (clone AC-15, Sigma, St. Louis, USA).
3.6 RNA analysis.
Total RNA was prepared from cells using the RNA extraction kit, RNeasy Mini Kit (Qiagen) as per the manufacturer's instructions. Of total RNA, 1 µg was converted into single-strand cDNA using Superscript II (Invitrogen) as per the manufacturer's instructions. Quantitative real-time PCR (qRT-PCR) was performed with Fast SYBR®Green quantitative PCR kit (Applied) for RPL19 (Forward primer sequence: 5'-CGGAAGGGCAGGCACAT-3' and Reverse primer sequence 5'-GGCGCAAAATCCTCATTCTC-3'), IL-8 (Forward primer sequence:
5’-AGGGTTGCCAGATGCAATAC-3’ and Reverse primer sequence
3’-CCTTGGCCTCAATTTTGCTA-5’) and PTEN (Forward primer sequence: 5'-AATAAAGACAAAGCCAACCGATACTT-3' and Reverse primer sequence 5'-CGGCTCCTCTACTGTTTTTGTGA-3'). Expression of PTEN and IL-8 mRNA was then normalized with RPL19 and PTEN was compared with mRNA positive control of T98G.
3.7 Statistical analysis.
Results are expressed as median (range). Optimal cut-off and performance characteristics (sensitivity, specificity, areas under the curves-AUC) were evaluated by computing Receiver Operating Chacteristic (ROC) curves. The associations between variables were tested by Pearson Chi Square test or Fisher exact test, when appropriate. The SPSS® (21.0), R® (2.6.1), MedCalc® (13.0) statistical programs were used for all analyses. P-value of <0.05 was considered statistically significant.
4 RESULTS
4.1 PTEN profiling in human CRC.
First, we characterized a panel of 29 CRC cell lines for both PTEN mRNA and protein levels, by RT-qPCR and Western blotting, respectively. T98G were used as a positive control for both PTEN mRNA and protein expression. In order to overcome the possibility that a different number of cells may alter the levels of PTEN expression, we normalized the cell growth: all the cell lines, indeed, were seeded to have about one million of cells after 48 hours from plating and the media was replaced by serum-free media after 24 hours from plating.
As shown in Figure 1 and summarized in Table 1, PTEN protein expression was completely absent (score 0, - in Table 1) in 11 CRC cell lines, weak (score 0.1–0.3, + in Table 1) in 1, moderate (score 0.3–0.6, + + in Table 1) in 7, and strong (score 0.6–1, + + + in Table 1) in 10 of the tested cell lines. Ratio of PTEN antibody/β-actin for each individual sample was compared with the positive control T98G (1.0). For PTEN mRNA analysis, results were evaluated as ΔΔct of PTEN mRNA relative to RPL19 and expressed as the ratio, assuming the levels in T98G positive control cells as 1.0 (Figure 3 and Table 1).
Cell lines carrying PTEN deletions or inactivating mutations or completely lacking PTEN protein expression (score 0) are referred to as PTEN-loss.
Figure 3. PTEN expression in 29 CRC cancer cell lines. A. Cells were lysed and analyzed by Western Blotting using antibodies specific for PTEN. Western blot with antibody specific for β-actin are shown as protein loading and blotting control. T98G cells were used as a positive control for PTEN expression. B. The presence of PTEN was detected by real-time PCR in all cell lines. Results were evaluated as ΔΔct of PTEN tested relative to RPL19 and expressed as the ratio assuming the levels in T98G positive control cells as 1.0. Results are representative of an experiment of two independent experiments.
Table 1. Characterization of 29 CRC cell lines
Table 1. PTEN status in 29 CRC cell lines. *OD ratio of PTEN antibody/β-actin for each individual sample is compared with OD of positive control T98G. + score 0.1–0.3; + + score 0.3–0.6; + + + score 0.6–1. **Results represent PTEN mRNA abundance relative to positive control T98G.
Cell line BRAF KRAS PI3K PTEN
PTEN Protein expression* Relative PTEN mRNA abundance ** MSDT8 p.V600K wt wt p.D310G - 0.00
LIM2537 p.V600E wt Del ex9 - 0.20
LIM2412 p.V600E wt wt - 0.13 LS411N p.V600E wt wt - 0.10 SNU-C4 wt wt p.E545G ex9 p.F241S - 0.62 SNU-C5 p.V600E wt p.H1047R ++ 0.78 SNU1040 wt wt wt p.L70_splice - 0.05 SNU1544 wt wt p.H1047R ++ 0.21 SNU1047 wt wt wt p.K267fs*9 - 0.15 SNU1235 p.V600E wt wt - 0.11 HCT116 Parental wt p.G13D etero p.H1047R ++ 0.21 HCT116 PTEN-/- wt p.G13D p.H1047R - 0.11 HCT116 Shirasawa wt p.G13D omo p.H1047R +++ 0.23 HCT116 HK2-6 wt p.G13D omo p.H1047R ++ 0.36 HCT116 HKE-3 wt wt p.H1047R ++ 0.21 DLD-1 wt p.G13D etero p.E545K +++ 0.38
DLD-1 Shirasawa wt p.G13D omo p.E545K + 0.28
DKO-1 wt p.G13D omo p.E545K +++ 0.33
DKO-4 wt wt p.E545K +++ 0.36 KM12C wt wt wt - 0.19 VACO432 p.V600E wt wt +++ 0.32 HT29 p.V600E wt wt +++ 0.54 LS180 wt p.G12D ex2 p.H1047R p.I67K +++ 0.46 SW620 wt p.G12V wt +++ 0.39 SW480 wt p.G12V wt ++ 0.12 COLO205 p.V600E wt wt +++ 0.37 RKO p.V600E wt p.H1047R ++ 0.11 COGA3 wt p.G13D ex2 wt - 0.3 HROC87 p.V600E wt wt +++ 0.29
Table 1. PTEN status in 29 colorectal cancer cell lines. *OD ratio of PTEN antibody/β-actin for each
individual sample is compared with OD of positive control T98G. + score 0.1–0.3; + + score 0.3–0.6; + + + score 0.6–1. **Results represent PTEN mRNA abundance relative to positive control T98G.
4.2 BRAFV600E and PTEN-loss are significantly associated with IL-8 production.
To investigate the role of PTEN status in modulating the expression of pro-angiogenic cytokines/chemokines, cell culture media of X-MAN™ isogenic HCT116 cell lines (HCT116 Parental and HCT116 PTEN-/-) were analyzed by Human Angiogenesis Antibody Array after 24 hours of culture in serum-free medium. As shown in Figure 4A, IL-8 was selectively expressed, suggesting that PTEN may be a genetic determinant of IL-8 expression, in HCT116 PTEN-/-. We also confirmed the selective production of IL-8 only in PTEN-/- context by ELISA assay (Figure 4A bottom panel).
To asses a potential correlation between tumor cell genetic background and IL-8 production, cell culture media of twenty-nine CRC cell lines with different genetic background and PTEN protein expression (BRAFV600E=11; KRASG13D/G12V=8; PI3KH1047R/E545G/P124T=11; PTEN-loss=11, Table 1) were analyzed by ELISA assay under standardized culture conditions (Figure 4B-C) and the results were expressed as pg/mL for 1x10⁶ cells. Statistical analysis showed a statistically significant correlation between the expression of IL-8 and BRAFV600E: indeed, BRAF mutation predicts IL-8 levels higher than 257.5 pg/mL (cut-off levels) with 58.33% sensitivity and 93.75% specificity (area under
ROC curve, AUC=0.76) and the ROC curve-based prediction algorithm based on BRAF mutation had 52% accuracy in predicting IL-8 production (p=0.004) (Figure 5A). Statistical analysis also showed a trend towards a statistically significant association with PTEN-loss: indeed, PTEN-loss predicts an IL-8 value higher than 42.5 pg/mL with a 64.29% sensitivity and 78.57% specificity (AUC=0.71) and the ROC curve-based prediction algorithm based on PTEN-loss had 43% accuracy in predicting IL-8 production (p=0.05) (Figure 5B). Moreover, the highest levels of IL-8 are observed in CRC cell lines carrying both BRAFV600E and PTEN-loss (n=5): indeed, combined BRAF/PTEN analysispredicts an IL-8 value higher than 46 pg/mL with 87.50% sensitivity and 80.00% specificity (AUC=0.88) and the ROC curve-based prediction algorithm based on these two alterations had 68% accuracy in predicting IL-8 production (p=0.002) (Figure 5C).
KRAS and PI3K status did not show correlation with IL-8 expression (data not shown).
These results support the hypothesis that PTEN status modulates CRC chemokine expression profile, and demonstrate that both BRAF and PTEN status are crucial determinant of the expression of IL-8, in model systems in vitro.
Figure 4. IL-8 expression in 29 CRC cell lines. A. Cell culture media of HCT116 Parental and HCT116 PTEN-/- were analyzed by both Human Angiogenesis Antibody Array (in the rectangle in blue is shown the expression of IL-8) and IL-8 ELISA assay (reported as % of control). B. 29 cell culture media, divided by the status of PTEN and BRAF, were analyzed by IL-8 ELISA assay; the results are expressed as pg/mL for 1x10⁶ cells. P-value of <0.05 is considered statistically significant. C. 29 CRC cell lines analyzed for their relative IL-8 expression (shade of blue) and their genetic background of BRAF, KRAS and PI3K or PTEN protein lack expression (reported in red). Results represent the average of three independent experiments.
Figure 5. IL-8 is more expressed in CRC cell lines BRAFV600E/PTEN-loss. A. BRAFV600E analysis predicts high IL-8 production > 257.5 pg/mL, with 58.33% sensitivity, 93.75% specificity and 52%accuracy, p=0.004. B. PTEN-loss analysis predicts high IL-8 production > 42.5 pg/mL, with 64.29% sensitivity, 78.57% specificity and 43% accuracy, p=0.05. C. Combined BRAFV600E /PTEN-loss analysis predicts high IL-8 production > 46 pg/mL, with 87.50% sensitivity, 80.00% specificity and 68%accuracy, p=0.002.
4.3 Analysis of VEGF and IL-6 expression.
In order to assess whether the production of other chemo- and cytokines involved in CRC initiation and progression also correlates with BRAF and PTEN status, the same analysis was performed for VEGF and Interleukin-6 (IL-6).
VEGF levels were correlated with BRAF/KRAS mutational status and PTEN expression, under normo- and hypoxic conditions of growth. The results expressed as pg/mL for 1x10⁶ cells were analyzed by Pearson Chi Square test. As shown in Figure 6 and 7, both PTEN-loss and absence of KRAS mutations significantly
correlated with higher levels of VEGF under both normoxic and hypoxic conditions, whereas BRAF mutational status had a borderline significant association with higher basal levels of VEGF under normoxia (p=0.05) and was not associated with hypoxia-induced VEGF production. Indeed, in normoxia, PTEN-loss predicts a VEGF value higher than 621 pg/mL with a 92.86% sensitivity and 57.14% specificity (AUC=0.77) and the ROC curve-based prediction algorithm based on PTEN-loss had 50% accuracy in predicting VEGF production (p=0.01) (Figure 8A, left panel). KRASG13D/G12V predicts a VEGF value lower than 627 pg/mL with a 75% sensitivity and 80% specificity (AUC=0.75) and the ROC curve-based prediction algorithm based on KRASG13D/G12V had 55% accuracy in predicting VEGF production (p=0.01) (Figure 8A, right panel). Similarly, in hypoxia, PTEN-loss predicts a VEGF value higher than 1012 pg/mL with a 92.86% sensitivity and 61.54% specificity (AUC=0.72) and the ROC curve-based prediction algorithm based on PTEN-loss had 54% accuracy in predicting VEGF production (p=0.004) (Figure 8B, left panel). KRASG13D/G12V predicts a VEGF value lower than or equal to 1046 pg/mL with a 75.00% sensitivity and 78.95% specificity (AUC=0.76) and the ROC curve-based prediction algorithm based on KRASG13D/G12V had 54% accuracy in predicting VEGF production (p=0.02) (Figure 8B, right panel).
These results suggest that VEGF is differentially expressed on the basis of KRAS and PTEN, but not of BRAF status, regardless of the cell growth condition (normoxia versus hypoxia). PI3K status is not correlated with VEGF expression (data not shown).
Figure 6. VEGF expression in 29 CRC cell lines, under normoxic condition of growth. 29 cell culture media, divided by the status of PTEN (A), KRAS (B) and BRAF (C), were analyzed by VEGF ELISA assay; the results are expressed as pg/mLfor 1x10⁶ cells. P-value of <0.05 is considered statistically significant.
D. 29 CRC cell lines analyzed for their relative VEGF expression (shade of blue) and their genetic background of BRAF, KRAS and PI3K or PTEN protein lack expression (reported in red). Results represent the average of three independent experiments.
Figure 7. VEGF expression in 29 CRC cell lines, under hypoxic condition of growth. 29 cell culture media, divided by the status of PTEN (A), KRAS (B) and BRAF (C), were analyzed by VEGF ELISA assay; the results are expressed as pg/mLfor 1x10⁶ cells. P-value of <0.05 is considered statistically significant.
D. 29 CRC cell lines analyzed for their relative VEGF expression (shade of blue) and their genetic background of BRAF, KRAS and PI3K or PTEN protein lack expression (reported in red). Results represent the average of three independent experiments.
Figure 8. VEGF is more expressed in CRC cell lines with PTEN-loss, whereas it is lower expressed in KRASG13D/G12V. A. PTEN-loss analysis predicts VEGF production > 621 pg/mL, with 92.86% sensitivity, 57.14% specificity and 50%accuracy, p=0.01 (left panel) and KRASG13D/G12V analysis predicts VEGF production < 627 pg/mL, with in normoxic condition of growth. B. PTEN-loss analysis predicts VEGF production > 1012 pg/mL, with 92.86% sensitivity, 61.54% specificity and 54%accuracy, p=0.004 (left panel) and KRASG13D/G12V analysis predicts VEGF production < 1046 pg/mL, with 75.00% sensitivity, 78.95% specificity and 54%accuracy, p=0.02 (right panel), in hypoxic condition of growth.
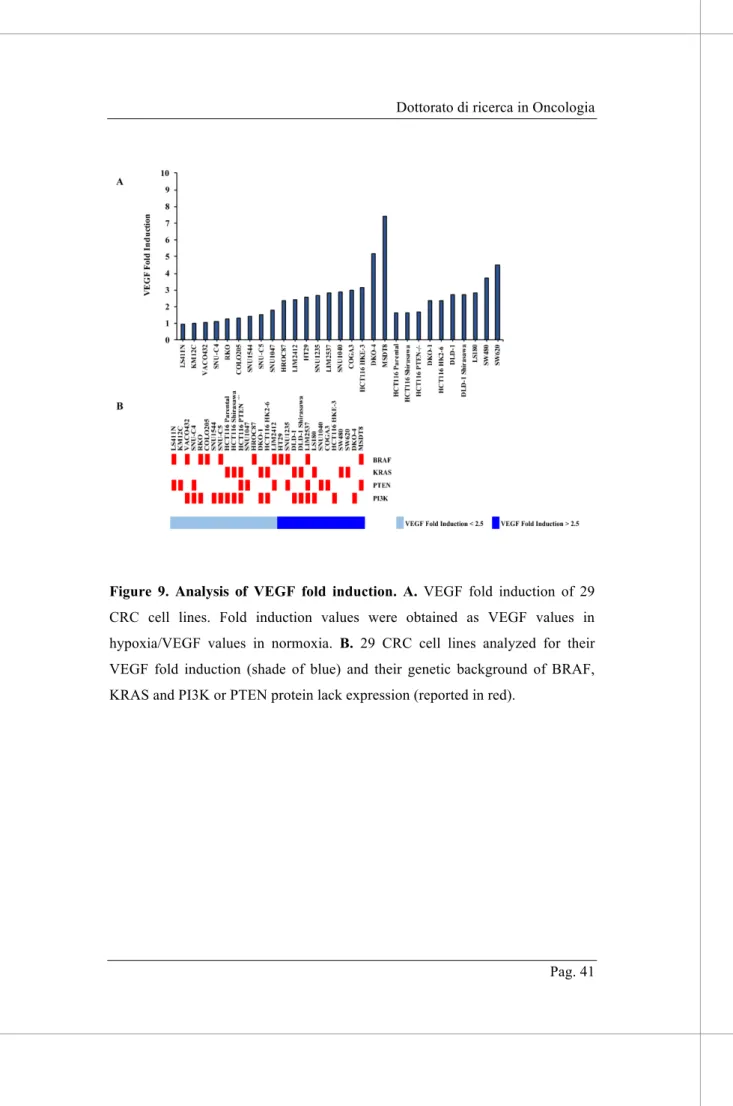
No statistical correlation was detected between the genetic background and the ratio of VEGF values in hypoxic versus normoxic conditions (represented as VEGF Fold Induction in Figure 9), suggesting that none of the genetic determinants, among those analyzed, affect hypoxia-induced upregulation of VEGF production.
Unlike what has been reported in literature, we did not observe IL-6 expression into the culture medium, at least under the standardized culture conditions employed. Indeed, as shown in Figure 10, IL-6 was almost never detected in cell culture media as compared with a positive control.
Figure 9. Analysis of VEGF fold induction. A. VEGF fold induction of 29 CRC cell lines. Fold induction values were obtained as VEGF values in hypoxia/VEGF values in normoxia. B. 29 CRC cell lines analyzed for their VEGF fold induction (shade of blue) and their genetic background of BRAF, KRAS and PI3K or PTEN protein lack expression (reported in red).
Figure 10. Analysis of IL-6 expression in 29 CRC cell lines. 29 cell culture media were analyzed by IL-6 ELISA assay; the results are expressed as pg/mL for 1x10⁶ cells.
4.4 BRAF inhibition modulates IL-8, but not VEGF, expression according to the genetic background.
We then investigated the molecular and the functional effects of BRAF, MEK, ERK1/2 and PI3K/mTOR inhibitors in four different CRC cell lines, which differ for both BRAF and PTEN status. Cell lines were exposed to increasing concentrations of drugs for 24 h in serum-free medium and IL-8 release was detected by ELISA assay.
As shown in Figure 11, inhibition of MEK and ERK1/2 with trametinib and SCH772984, respectively, profoundly suppressed IL-8 expression in all the cell lines tested, suggesting that IL-8 is directly regulated by the MEK/ERK pathway regardless of the genetic background of the cells. On the contrary, BRAF mutational status profoundly influences the functional outcome of its selective inhibition by dabrafenib on IL-8 production: indeed, while in BRAFV600E cell lines IL-8 strongly decreases after dabrafenib treatment (Figure 11, left panels), in BRAF-wt cell lines IL-8 increases (Figure 11, right panels), possibly as a consequence of the well-known paradoxical ERK activation observed in BRAF wt models in response to selective BRAF inhibition [58].
The PI3K/mTOR inhibitor gedatolisib did not significantly modulate IL-8 production, confirming that the IL-8 release is downstream the BRAF/MEK/ERK pathway.
Similar results were obtained in X-MAN™ isogenic HCT116 cell lines: indeed, even if the effect of trametinib on IL-8 expression is not evident in HCT116 Parental, due the very low levels of IL-8 released from untreated cells, in HCT116 PTEN-loss trametinib effectively inhibited IL-8 production; conversely, BRAF inhibition by dabrafenib strongly upregulated IL-8 production in CRC isogenic cell lines, regardless of PTEN status (data not shown).
Figure 11. Analysis of IL-8 expression after MEK, BRAF, ERK and PI3K/mTOR inhibition. Cells were treated with increasing concentration of drugs, as indicated. IL-8 expression was measured after 24 hours of treatment, by IL-8 ELISA assay. The percentage of IL-8 was obtained from pg/mL assuming the levels in control cells as 100%. Results represent the average of three independent experiments.
In order to ascertain whether the pharmacological effects observed on IL-8 production were specific to the release of this chemokine and did not cross-modulate other chemo- and cytokines, we analyzed VEGF expression, by ELISA assay, under the same
culture and treatment conditions. As shown in Figure 12, pathways inhibitors did not significantly affect VEGF levels or increased/decreased its expression, regardless of the genetic background, confirming that the different modulation in response to BRAF/MEK/ERK inhibition is specific to IL-8.
Figure 12. Analysis of VEGF expression after MEK, BRAF, ERK and PI3K/mTOR inhibition. Cells were treated with increasing concentration of drugs, as indicated. VEGF expression was measured after 24 hours of treatment, by VEGF ELISA assay. The percentage of VEGF was obtained from pg/mL assuming the levels in control cells as 100%. Results represent the average of three independent experiments.
In Figure 13, the functional effects of dabrafenib, trametinib and gedatolisib on viability and cell growth are shown: as expected, BRAF-wt cell lines are more resistant to dabrafenib treatment (IC50: 6.4358 µM and 8.47e+015 µM for SNU1047 and LS180, respectively), as compared to BRAFV600E cell lines (IC50: 0.0702 µM and 0.1755 µM for SNU1235 and HT29, respectively), whereas PTEN-loss cell lines are more resistant to trametinib treatment (IC50: 565.098 nM and 19.1052 nM for SNU1235 and SNU1047, respectively), as compared to PTEN wt cell lines (IC50: 0.0018 nM and 1.7268 nM for HT29 and LS180, respectively) [55]. No difference in response to gedatolisib with respect to the mutational state of BRAF and PTEN was observed (IC50: 100.783 nM, 2.049e+004 nM, 121.632 nM and 111.694 nM for SNU1235, SNU1047, HT29 and LS180, respectively).
Figure 13. Cell viability after MEK, BRAF and PI3K/mTOR inhibition. Cells were treated with increasing concentration of drugs, as indicated, for 72 hours. Effects on cell growth were monitored by Crystal Violet assay. The percentage of viability was represented as % of control, assuming the levels in control cells as 100%. Results represent the average of three independent experiments.
4.5 Trametinib and dabrafenib transcriptionally regulate IL-8 expression.
Given the different effects of trametinib and dabrafenib on the release of IL-8 in the culture supernatant in different BRAF/PTEN contexts, we then investigated if inhibitors of the MAPK pathway would directly affect transcription of the IL-8 gene [34]. To this purpose, we treated SNU1235 (BRAFV600E/PTEN-loss) and
SNU1047 (BRAF wt/ PTEN-loss) with a fixed dose of trametinib (10 nM) and dabrafenib (0.1 mM) that was previously demonstrated to be effective in modulating IL-8 release in the culture medium; IL-8 mRNA levels were then evaluated by quantitative RT-PCR at multiple times (1, 2, 4 and 6 hours). Even though the chemokine is not detectable in the medium before 21 hours of serum-free medium culture (data not shown), the drug effects at the IL-8 mRNA level are already evident after 1 hour of treatment, suggesting that trametinib and dabrafenib differentially regulate IL-8 expression by interfering with its transcription. Indeed, as shown in Figure 14, the results of the time course of gene expression show that trametinib downregulated the expression of IL-8 in both analyzed cell lines; on the contrary, dabrafenib downregulated IL-8 levels in the BRAFV600E context and upregulated IL-8 levels in BRAF-wt cell line, in agreement with the results shown in term of protein release in the culture supernatant (see Figure 11).
Figure 14. IL-8 mRNA expression after MEK and BRAF inhibition. Cells were treated with the indicated concentration of drugs, for 1, 2, 4 and 6 hours. The presence of IL-8 was detected by real-time PCR in all cell lines. Results were evaluated as ΔΔct of IL-8 tested relative to RPL19 and expressed as the ratio assuming the levels in the control 0 h as 1.0. Results are representative of an experiment of three independent experiments.
4.6 Molecular analysis of ERK and STAT3 in response to targeted inhibitors.
We recently observed from phosphoproteomic analysis, assessed in PTEN-wt and PTEN-loss contexts, that kinases of the JAK/STAT3 pathway are potential points of interest in PTEN-loss context; moreover, phosphorylation of STAT3 on Ser727 controls a common set of genes encoding for cytokines and chemokines, such
as IL-8 [55]. Consistent with a selective effect of STAT3 activity
as an activator or repressor of transcription of specific chemokines/cytokines depending on PTEN status, de la Iglesia et al. have recently shown that STAT3 signaling induces IL-8 expression only in PTEN-loss, but not in PTEN-competent, glioblastoma cells [35]. Due the effects of drugs observed on gene transcription, we hypothesized that STAT3 could be responsible for the modulation of IL-8 expression and we therefore investigated its role on the regulation of IL-8 expression. To this purpose, we assessed whether trametinib and dabrafenib treatments could influence the phosphorylation levels of STAT3, thus in turn causing a modulation of STAT3 activity.
Western blot analysis, shown in Figure 15, show that p-ERK levels are downregulated in all cell line, regardless of the genetic background, after trametinib treatment; on the contrary, p-ERK levels are upregulated, both in BRAF-wt and BRAFV600E, in response to dabrafenib treatment. No significant modulations in
both p-STAT3 Ser727 and p-STAT3 Tyr705 levels have been observed, with the exception of the increased phosphorylation of p-STAT3 Ser727 after dabrafenib treatment in BRAF-wt context.
Figure 15. Analysis of protein expression after trametinib e dabrafenib treatment. Cells were treated with the indicated concentration of drugs. After 24 hours, CRC cell lines were lysed and analyzed by Western Blotting using the indicated antibodies and b-actin was used as protein loading and blotting control.
We also analyzed the effects of two STAT3 inhibitors, with a different mechanism of action: stattic inhibits STAT3 activation and nuclear translocation, whereas S31-201 inhibits STAT3-STAT3 complex formation, STAT3-STAT3 DNA-binding and transcriptional activities [59, 60]. As shown in Figure 16, from a preliminary analysis of IL-8 ELISA assay, the two drugs seem to have only marginal effects on IL-8 expression, in BRAFV600E and BRAF-wt contexts.
These data underline the necessity to further investigate the molecular mechanisms by which IL-8 is differentially expressed according to BRAF genetic background and after treatment with molecularly targeted inhibitors, in CRC cell lines.
Figure 16. Analysis of IL-8 expression after STAT3 inhibition. Cells were treated with the indicated concentration of drugs, as indicated. IL-8 expression was measured after 24 hours of treatment, by IL-8 ELISA assay. The percentage of IL-8 was obtained from pg/mL assuming the levels in control cells as 100%. Results are representative of an experiment of three independent experiments.
5 DISCUSSION AND CONCLUSIONS
Mutational status in CRC is a strong predictor for overall survival, not only in the metastatic setting but also in earlier stages, and it is involved in drug resistance development. Furthermore, mutations are often used as a biomarker to select patients who would benefit from a specific therapeutic approach: indeed, in patients with metastatic CRC, overall survival has improved mainly due to the use of targeted therapies, but survival improvement is linked to proper selection of patients who could benefit from these treatments. For example, only patients lacking mutations in KRAS or NRAS benefit from EGFR monoclonal antibodies (cetuximab and panitumumab) treatment [9].
The general aim of our study was to assess how the genetic background of CRC cells, such as PI3KCA, PTEN, BRAF or KRAS status, influences the expression of chemokines and proangiogenic factors, which could, in turn, affect response to targeted therapies.
Recently, we demonstrated that, in a panel of cancer cell lines with different histological origin, combined treatment with MAPK/PI3K inhibitors synergistically inhibits tumor growth only in PTEN-loss contexts [55]. Combination therapies could represent the best and most effective treatment option, in order to prevent drug resistance development in cancer cells during treatment, but imply increased
toxicity and financial costs and should be thus reversed to patients at the highest chance of benefit. Unfortunately, TME and TSI also increase drug-resistance development of cancer cells, thus leading to the need of better understanding of the mechanisms beyond acquired tumor-resistance, which remain crucial to determine overall patient benefit [61]. Albeit genetically “normal”, TME can be influenced by and respond to the genetic background of cancer cells with which it interacts and the molecularly targeted treatments applied, respectively, and play a critical role in therapy resistance and disease recurrence [62]. For example, in addition to the role in resistance to targeted therapy, PTEN-loss also leads to immunoresistance in several cancers with different histological origins [63]. Furthermore, interactions among cancer cells and between cancer cells and the surrounding microenvironment affect the sensitivity of the cells to targeted therapy and recent evidence from our group specifically showed that the interaction with the microenvironment depends on the genetic background of the tumor cells, in particular with regard to PTEN status [64].
Based on this evidence, we characterized a panel of 29 CRC cell lines for PTEN expression (Figure 3, Table 1) and investigated the role of PTEN status in the expression of specific chemokines/cytokines which may, in turn, affect the interaction of tumor cells with the surrounding microenvironment. From preliminary data, we observed that a different number of seeded
cells alters the expression of chemokines: to control for the influence of culture condition, we standardized the growth of CRC cell lines in terms of cell numbers, degree of confluence and chemokine/cytokine production expressed as pg/mL. In the panel of cell lines analyzed, we observed that both BRAFV600E and PTEN-loss status are significantly associated with higher levels of IL-8 production and release in the culture medium (Figure 4). Moreover, CRC cell lines release the highest levels of IL-8 in the presence of simultaneous BRAFV600E and PTEN-loss are co-express (Figure 5); in the panel of cell lines analyzed, these two molecular alterations co-occur in 5 CRC cell lines and there is non-significant trend co-occurrence in CRC specimens, accounting for an overall prevalence of BRAFV600E/PTEN-loss cases of 3% [65]. IL-8 has tumorigenic and proangiogenic properties and it is associated with poor prognosis, due its effects on drug resistance development: for example, Ning and colleagues demonstrated that IL-8 overexpression decreases sensitivity to cytotoxic effects of oxaliplatin in CRC cells [46]. Moreover, Kopetz and colleagues demonstrated that increased secretion of IL-8 is associated with resistance to antiangiogenic therapy [66]. Rubie and colleagues also showed that there is an association between IL-8 production and progression of CRC, including metastasis development [51]. Even though IL-8 plays a critical role in CRC progression, many other soluble factors are involved in TSI, such as VEGF and IL-6
[53, 67]. The importance of VEGF in CRC is underlined by the use of bevacizumab (and other VEGF-targeted agents) in clinical practice, in combination with chemotherapy, and several studies show that the clinical benefit from anti-VEGF therapy appears to be independent of KRAS status [68]. Due to VEGF relevance in CRC, and in order to highlight the specific correlation between IL-8 and BRAFV600E and PTEN-loss, we also analyzed the expression of VEGF in the same standardized culture conditions of growth used for IL-8 analysis, and statistical data showed that the highest levels of VEGF are correlated with KRAS wild-type and PTEN-loss status, in both normo- and hypoxic condition of growth (Figure 6-8).
Due the association between IL-8 expression and BRAFV600E/PTEN-loss, we next investigated whether the specific background could otherwise influence the effects of molecular target inhibitors on the production of IL-8. Consistent with the key role played by the MAPK pathway in modulating IL-8 expression, we chose to analyze the effects of BRAF (dabrafenib), MEK (trametinib) and ERK1/2 (SCH772984) inhibitors, on IL-8 production [34]. Four different CRC cell lines, which differ for both BRAF and PTEN status were treated with the same concentration of drugs. Results show that trametinib downregulates the expression of IL-8, regardless of the genetic background (Figure 11), in correlation with p-ERK levels (Figure 15).
Conversely dabrafenib affects IL-8 production and release in the culture medium of CRC cells in a manner that is strictly dependent on BRAF mutational status: in BRAFV600E models, dabrafenib strongly downregulates IL-8 production (in a manner similar to what it is observed in response to trametinib); on the other hand, in BRAF-wt CRC models, dabrafenib consistently increases IL-8 production regardless of PTEN status. Based on the tight association between modulation of p-ERK levels and IL-8 production observed in response to the MEK inhibitor trametinib, we hypothesized that the differential effects of selective BRAF inhibition in BRAF-wt versus BRAFV600E contexts might be due to the well-described paradoxical ERK activation observed in response to BRAF inhibition on BRAF-wt contexts [69-72]. However, ERK phosphorylation analysis in the CRC models employed here clearly shows that dabrafenib elicits paradoxical ERK phosphorylation regardless of BRAF mutational status. Such relatively unexpected [73] finding raises two interesting hypotheses: 1) paradoxical ERK activation in response to BRAF-selective inhibitors, such as dabrafenib, may explain the clinical resistance of BRAFV600E CRC to BRAF-directed agents [74]; 2) regulation of IL-8 production has a complex relationship with ERK activation status and other mechanism cooperate with ERK activity to control IL-8 transcription and release.
Many groups showed that BRAFV600E CRCs express higher levels of EGFR, as compared to BRAF-wt CRCs [75], and that signaling from EGFR could lead to re-accumulation of p-ERK and resistance to EGFR-inhibitors [76]. Based on the observations described here and on literature data, we propose a working model whereby in BRAF-wt contexts dabrafenib causes paradoxical ERK activation (possibly further increased by contextual increased signaling through EGFR family members), thereby causing increased IL-8 transcription, whereas trametinib shuts down ERK activation and IL-8 production (Figure 17, right panel). On the other hand, similar molecular mechanisms are in place in BRAFV600E CRC models in response to trametinib, resulting in ERK inhibition and decrease IL-8 production; however, in response to dabrafenib in BRAF-mut contexts, ERK activation is maintained by sustained signaling through EGFR family members despite BRAF inhibition and the observed decrease in IL-8 production is due to yet unknown mechanisms regulating gene transcription and/or RNA/protein stability (Figure 17, left panel). In that respect, preliminary data from our group show that the activation of EGFR family members (particularly EGFR and HER3) is consistently observed in response to dabrafenib in both BRAF-mut and -wt contexts in CRC models (Bazzichetto C., unpublished observations).
We also confirmed that the effects of trametinib and dabrafenib on the expression of cytokines, related to the genetic background,
were specific to IL-8, by analyzing the effect of the same inhibitors on VEGF expression (Figure 12). We also analyzed the effects of a double inhibitor of both PI3K and mTOR (gedatolisib), and we didn’t observe any modulation in IL-8 expression after treatment, confirming that the MAPK pathway is more relevant in the regulation of IL-8, than PI3K/AKT.
Many evidence show that IL-8 expression is regulated by modulation of gene transcription, and we previously reported that MEK inhibitors downregulate IL-8 expression at the transcriptional level [34]. Moreover, preliminary data show that IL-8 is downregulated in response to combined MAPK/PI3K inhibition, possibly as a consequence of increased STAT3 phosphorylation, both in melanoma and CRC cell models (Ciuffreda L., unpublished data). De la Iglesia and colleagues also showed a correlation between STAT3 and IL-8 in glioblastoma PTEN-loss context: indeed, the transcription factor STAT3 negatively regulated IL-8 transcription only in PTEN-loss context, suggesting that the genetic background could specifically affect the transcription of IL-8 [35]. We observed that trametinib and dabrafenib treatment regulates IL-8 expression via transcription modulation (Figure 14), and that STAT3 could positively regulate IL-8 gene transcription only in BRAF-wt context (Figure 16). However, both molecular and functional data highlight a relatively minor involvement of the STAT3 pathway in the regulation of IL-8 production in response to
MAPK pathway inhibitors in preclinical models of CRC (Figure 17).
Figure 17. Feedback reactivation of MAPK signaling and schematic regulation of IL-8 transcription. The RAS-RAF-MEK-ERK cellular signaling cascade couples extracellular signals to transcription factors, regulating gene expression. After external stimuli (i.e. growth factors), RTKs and RAS are activated: RAS activates and binds the protein kinase RAF, RAF kinase phosphorylates and activates MEK, which in turn phosphorylates and activates ERK, which translocates into the nucleus and regulates gene transcription. Upon addition of the BRAF inhibitor dabrafenib, signaling output from BRAFV600E is blocked and there is a transient suppression of ERK activation and MAPK signaling, However, EGFR and other RTKs drive feedback activation of RAS and CRAF, leading to reactivation of ERK and restoration of MAPK signaling. In this genetic context, other transcriptional factors, such as STAT3 could negatively regulate IL-8 transcription, even in presence of p-ERK in the
nucleus. On the contrary, in BRAF wt contexts, even in presence of dabrafenib, BRAF forms a complex with CRAF and hyperactivates CRAF istelf, thereby driving paradoxical hyper-activation of both MEK and ERK. p-ERK translocates in the nucleus and IL-8 expression is upregulated.
Trametinib inhibits MEK activity, thus in turn downregulates p-ERK levels: ERK remains in cytoplasm compartment and IL-8 gene is not transcript, regardless of the genetic status of BRAF (bottom panels).
6 FUTURE PROSPECTS
The work conducted so far demonstrates that IL-8 production is strongly associated with BRAFV600E and PTEN-loss in CRC models and that its production is mostly regulated through activation of the MAPK, rather than the PI3K/AKT pathway; such regulation is specific to IL-8, as other pro-angiogenic cytokines, such as IL-6 or VEGF, are either absent (IL-6) or regulated by different mechanisms as compared with IL-8 production (VEGF). The ability to correlate molecularly defined subclasses of CRC with a specific chemokine/immunologic profile(s) will potentially allow to identify resistance mechanisms and to determine what patients could benefit from specific signaling inhibitors. To investigate the role of IL-8 in modulating the response to target inhibitors, we will analyze how IL-8 is involved in the growth of CRC cells and how it could interfere with drug response to target therapy, both with/without the addition of recombinant human IL-8, which activate its downstream pathways, and anti-IL-8 human antibodies, that can neutralize the effects of IL-8 released in the culture media by CRC cells.
Stromal cells also release soluble factors in the TME, thus in turn influencing drug response. To investigate the role of fibroblast cells in TSI, we propose to analyze how conditioned medium (CM) of the cells could influence the growth of CRC cells and how the
presence of stromal cells could interfere with the response of CRC cells to target therapies (presence/ absence of CM, co-culture system, invasion and migration assays).
2D cell monolayer culture techniques do not reflect the real cancer tissue and microenvironment. In order to guarantee that data gathered in vitro are predictive of the in vivo system, we propose to conduct the analysis of IL-8 expressed in tissue and serum/plasma of patients, affected by CRC at different stages. To this purpose, we are now setting antibodies for IL-8 and PTEN protein expression, to analyze 184 tissue microarray (TMA) by immunohistochemistry (IHC) (Figure 18).
Figure 18. Immunohistochemistry analysis of PTEN and IL-8. Immunohistochemical expression of PTEN and IL-8 in both RKO cell lines (A) and TMA (B) (images were obtained at 40x magnification using a light microscope equipped with a software able to capture images (DM2000 LED, Leica)).
7 REFERENCES
1. Siegel RL, Miller KD, Jemal A. Cancer statistics, 2016. CA Cancer J Clin 2016; 66: 7-30.
2. I numeri del cancro in Italia 2017. Italia, 2017 (available at: http://www.aiom.it/fondazione-aiom/%20aiom-airtum
numeri-cancro-2017/1,3021,0,).
3. Dolatkhah R, Somi MH, Bonyadi MJ et al. Colorectal cancer in iran: molecular epidemiology and screening strategies. J Cancer Epidemiol 2015; 2015: 643020.
4. Arvelo F, Sojo F, Cotte C. Biology of colorectal cancer. Ecancermedicalscience 2015; 9: 520.
5. Danielsen SA, Eide PW, Nesbakken A et al. Portrait of the PI3K/AKT pathway in colorectal cancer. Biochim Biophys Acta 2015; 1855: 104-121.
6. Sideris M, Papagrigoriadis S. Molecular biomarkers and classification models in the evaluation of the prognosis of colorectal cancer. Anticancer Res 2014; 34: 2061-2068. 7. Kanthan R, Senger JL, Kanthan SC. Molecular events in
primary and metastatic colorectal carcinoma: a review. Patholog Res Int 2012; 2012: 597497.
8. Jasperson KW, Tuohy TM, Neklason DW, Burt RW. Hereditary and familial colon cancer. Gastroenterology 2010; 138: 2044-2058.
9. Shaib W, Mahajan R, El-Rayes B. Markers of resistance to anti-EGFR therapy in colorectal cancer. J Gastrointest Oncol 2013; 4: 308-318.
10. Schirripa M, Cremolini C, Loupakis F et al. Role of NRAS mutations as prognostic and predictive markers in metastatic colorectal cancer. Int J Cancer 2015; 136: 83-90.
11. Reinacher-Schick A, Schulmann K, Modest DP et al. Effect of KRAS codon13 mutations in patients with advanced colorectal cancer (advanced CRC) under oxaliplatin containing chemotherapy. Results from a translational study
of the AIO colorectal study group. BMC Cancer 2012; 12: 349.
12. Armaghany T, Wilson JD, Chu Q, Mills G. Genetic alterations in colorectal cancer. Gastrointest Cancer Res 2012; 5: 19-27.
13. Metzger B, Chambeau L, Begon DY et al. The human epidermal growth factor receptor (EGFR) gene in European patients with advanced colorectal cancer harbors infrequent mutations in its tyrosine kinase domain. BMC Med Genet 2011; 12: 144.
14. Carracedo A, Pandolfi PP. The PTEN-PI3K pathway: of feedbacks and cross-talks. Oncogene 2008; 27: 5527-5541. 15. Lin PC, Lin JK, Lin HH et al. A comprehensive analysis of
phosphatase and tensin homolog deleted on chromosome 10 (PTEN) loss in colorectal cancer. World J Surg Oncol 2015; 13: 186.
16. Weng W, Feng J, Qin H et al. An update on miRNAs as biological and clinical determinants in colorectal cancer: a bench-to-bedside approach. Future Oncol 2015; 11: 1791-1808.
17. Colussi D, Brandi G, Bazzoli F, Ricciardiello L. Molecular pathways involved in colorectal cancer: implications for disease behavior and prevention. Int J Mol Sci 2013; 14: 16365-16385.
18. Peddareddigari VG, Wang D, Dubois RN. The tumor microenvironment in colorectal carcinogenesis. Cancer Microenviron 2010; 3: 149-166.
19. Tauriello DVF, Batlle E. Targeting the Microenvironment in Advanced Colorectal Cancer. Trends Cancer 2016; 2: 495-504.
20. Lewis CE, Pollard JW. Distinct role of macrophages in different tumor microenvironments. Cancer Res 2006; 66: 605-612.
21. Quail DF, Joyce JA. Microenvironmental regulation of tumor progression and metastasis. Nat Med 2013; 19: 1423-1437.
![Figure 1. Sequential genetic and epigenetic mutations acquired during neoplastic transformation from normal intestinal epithelium to colorectal carcinoma [5]](https://thumb-eu.123doks.com/thumbv2/123dokorg/2897175.11786/5.892.112.790.141.1158/sequential-epigenetic-mutations-neoplastic-transformation-intestinal-epithelium-colorectal.webp)
![Figure 2. Signaling of chemokines in TSI [26].](https://thumb-eu.123doks.com/thumbv2/123dokorg/2897175.11786/11.892.108.788.99.1174/figure-signaling-of-chemokines-in-tsi.webp)
![Figure 3. Principal signaling pathways activated by IL-8-CXCR1/2 binding, to regulate cell survival, proliferation, angiogenesis and metastasis [28]](https://thumb-eu.123doks.com/thumbv2/123dokorg/2897175.11786/16.892.90.791.100.1195/principal-signaling-pathways-activated-regulate-proliferation-angiogenesis-metastasis.webp)