HYDROGEN PRODUCTION FROM Klebsiella oxytoca AND
MEDIUM INDUCED METABOLIC SWITCHES
MARINELLA BROGLIA, FRANCESCO PETRAZZUOLO
ENEA - Unità Tecnica per lo Sviluppo Sostenibile ed Innovazione del Sistema Agro-Industriale Laboratorio Innovazione Agro-Industriale
Centro Ricerche Casaccia, Roma
AGENZIA NAZIONALE PER LE NUOVE TECNOLOGIE, LʼENERGIA E LO SVILUPPO ECONOMICO SOSTENIBILE
HYDROGEN PRODUCTION FROM
Klebsiella oxytoca AND
MEDIUM INDUCED METABOLIC SWITCHES
MARINELLA BROGLIA, FRANCESCO PETRAZZUOLO
ENEA - Unità Tecnica per lo Sviluppo Sostenibile ed Innovazione del Sistema Agro-Industriale Laboratorio Innovazione Agro-Industriale
Centro Ricerche Casaccia, Roma
I contenuti tecnico-scientifici dei rapporti tecnici dell'ENEA rispecchiano l'opinione degli autori e non necessariamente quella dell'Agenzia.
The technical and scientific contents of these reports express the opinion of the authors but not necessarily the opinion of ENEA.
I Rapporti tecnici sono scaricabili in formato pdf dal sito web ENEA alla pagina http://www.enea.it/it/produzione-scientifica/rapporti-tecnici
HYDROGEN PRODUCTION FROM Klebsiella oxytoca AND MEDIUM INDUCED METABOLIC SWITCHES
MARINELLA BROGLIA, FRANCESCO PETRAZZUOLO
Riassunto
Un ceppo di Klebsiella oxytoca è stato isolato da un impianto per la depurazione delle acque municipali e le sue capacità di produzione di idrogeno sono state esplorate. La cinetica a breve termine del rateo di produzione di idrogeno è stata investigata in ‘batch’ e il rateo massimo di produzione è stato attivamente mantenuto in un reattore a flusso continuo pilotato dal pH. I primi tentativi di ‘shift’ metabolico, effettuati cambiando la composizione iniziale del mezzo di fermentazione, hanno spostato il metabolismo batterico su differenti percorsi di fermentazione.
Parole chiave: bioidrogeno, Klebsiella, fermentazione, digestione anaerobica, ‘switch’ metabolico
Abstract
A strain of Klebsiella oxytoca has been isolated from a municipal sewage sludge treatment plant and its performance in biohydrogen production has been explored. The short term kinetics of the hydrogen production rate has been investigated in batch and the maximum production rate has been actively maintained in a pH-driven continuous flow reactor. First attempts of metabolic shifting, made by changing the initial composition of the fermentation medium, switched the bacteria metabolism to different fermentation pathways.
INDEX
Riassunto ... 4
Abstract ... 4
1. Introduction ... 7
2. Materials and Methods ... 7
2.1 Bacterial strain isolation ... 7
2.2 Bioreactor and analysis ... 8
3. Results and Discussion ... 9
3.1 Microbical growth and fermentation ... 9
3.2 Medium induced metabolic switches ... 14
4. Conclusions ... 16
1. Introduction
Hydrogen is generally considered the fuel of choice for the near future, water being the product of its combustion [1]. Indeed hydrogen, unlike oil or methane, cannot be found free in nature and, in this sense, it cannot be considered a real energy source: nevertheless it could be exploited as a carrier of otherwise produced energy, just like to electricity but with a different chance of storage [2].
Hydrogen production by fossil [3] or nuclear fuels [4] would not remove the environmental drawbacks of energy production, but would allow to confine them for a cleaner diffused energy utilization in fuel cell technology. A new perspective is opened by the use of renewable energy sources to produce hydrogen [5]: sun, wind, waves, biomass energy can be transformed in electricity or in hydrogen as well.
A quite different approach lies in microbical hydrogen production [6]. In several milions of years algae and bacteria developed their own “technology” for sun light capture and hydrogen production. Indeed, in anaerobic conditions they produce hydrogen in nature, but biological feedback regulation and association with hydrogen consuming bacteria likely prevent hydrogen from accumulation in wells or mines. Microbical hydrogen production offers some advantages: it works at ambient pressure and temperature and can reduce either water or many kind of organic wastes [7]. Moreover biological CO2, produced together with biohydrogen, does not increase total CO2 in the atmosphere. Therefore, controlled reproduction of conditions that in nature induce bacteria to produce hydrogen, in a bioreactor where biohydrogen can be continuously removed, seems to be an interesting energy option.
Between all the bacterial processes for hydrogen production, anaerobic dark fermentation of organic wastes stands out on photosynthetic processes for less extensive installations required, the day-night working time and the higher production rates due to very efficient hydrogenases [8]. Nevertheless, the waste material being reduced to organic acids, yields are quite low and should be increased by a second bacterial stage, photosynthetic or methanogenic [9].
The anaerobic digestion stage of plants for municipal sewage sludge treatment can be a good source of dark fermenting hydrogen producing bacteria. Not all of them are strict anaerobes. Facultative anaerobic bacteria are often preferred for their high growth rates and their tolerance to high hydrogen concentrations, in spite of a lower hydrogen yield due to a more branched metabolism [10].
2. Materials and Methods 2.1 Bacterial strain isolation
Our hydrogen producing strain has been isolated from the output sludge of the municipal sewage treatment plant in Cremona (Italy). The sludge has been diluted then plated on Luria Broth agar medium (for 1 liter: 10 gr Tryptone, 5 gr Yeast Extracts, 10 gr NaCl, 0.32 ml NaOH 10 N, 15 gr Agar) and aerobically grown overnight at 30°C. Single colonies have been subcultured in 3 ml and then in 100 ml 8 gr/l Nutrient Broth (DIFCO) liquid medium (NB); these cultures have been transferred with 150 ml of a buffered minimal medium (48 mM Na2HPO4, 22 mM KH2PO4, 8.5 mM NaCl, pH=6) (MM) and 1% sucrose in 250 ml plastic bottles (head space about 20 ml) and left
sealed and still on the bench at room temperature. About 72 hours later bottles have been gently shaked: bottles that swelled due to some gas released from the liquid phase into the head space were set out for gas phase analysis. The main hydrogen producing strain has been identified by 16S rDNA amplification, sequencing and comparison to genetic data banks as Klebsiella oxytoca. Briefly, 1 ml of saturated culture were centrifuged (15000 g x 5 min); pellet was washed and resuspended in 300 µl of sterilized distilled water; then it was incubated 15 min at 95°C. After centrifugation, 5 µl of a 100 dilution of the surnatant were used for 16S rDNA amplification by polymerase chain reaction (PCR) in a 50 µl total reaction volume containing 1.5 mM MgCl2, 150 ng (each) of primers (bacfor: CAGACTCCTACGGGAGG-3’, bacrev: 5’-CATTGTAGCACGTGTGTAG-3’), 200 µM (each) deoxynucleoside triphosphates, 1.25 units of Gold Taq DNA poymerase (Applied Biosystem) in Gold Taq buffer. The reaction mixtures have been incubated in a thermocycler (MJ Research) at 95°C for 10 min and then cycled 30 times through the following temperature profile: 95°C for 30 s, 55°C for 30 sec, 72°C for 30 s. Finally the mixtures were incubated at 72°C for 10 min. Ten microliters of the amplificated DNA was verified by gel electrophoresis (1% wt/vol agarose, 200 ng/ml of ethidium bromide in TBE buffer (0.045 M Tris-borate, 1 mM EDTA)). Sequencing analysis was performed by the ENEA GENELAB.
2.2 Bioreactor and analysis
Fermentation has been investigated in a plexiglass home-made bioreactor (Fig.1). A total volume of 1.2 l is water jacketed for thermal conditioning and continuously magnetically stirred. The reactor is equipped with a glass electrode for pH control (Metrohm Herisau): NaOH 1N or a phosphate buffer can be automatically added when stable pH operation is required. A membrane micropump (KNF) is used to remove the gas from the bioreactor head-space, skimming the liquid level at 1 l volume, through a foam-liquid collector bottle, to a water displacing cylindrical system; here the gas phase is looped with the gaschromatograph sampling valve (sampling volume 125 µl). The residual pressure in the reactor is about 380 mbar. All connections are made by teflon tubes.
Both H2 and CO2 are detected with a GC6000 gaschromatograph (Carlo Erba Instruments) equipped with a silica gel (60/80 mesh) packed column (length 6 m, internal diameter 2 mm, carrier gas Ar, temperature program: 50°C 10 min, steep slope 35°C/min, 150°C 12 min) and a thermal conductivity detector. The system response curve has been determined with a set of standard mixtures of H2 and CO2. During fermentation H2 and CO2 volumes and the production rates have been calculated from the gas analysis.
Simultaneously with gas analysis the fermentation broth is sampled for biomass, sugars, alcohols and volatile fatty acids (VFA) determination. Microbical biomass is determined by measuring the optical density at 600 nm (Optima 3000 UV/VIS Spectrophotometer); correspondence between optical density and microbical dry weight biomass has been determined by centrifugating (8000g x 20 min) 500 ml of a saturated culture of K. oxytoca in NB medium, quickly washing pellet with sterile water, and drying it at 90°C until stable weight was attained. Cell viability has been assessed by plating on agar solidified NB medium 100 µl of suitable dilutions of the working bacterial suspension and counting visible colonies after overnight incubation at 37°C. When required, a real time measure of glucose is obtained by glycaemia test strips and nitrogen is checked by the Nessler method. Concentration of sugars (glucose, sucrose or lactose) during fermentation is measured by liquid chromatography (column Alltech IOA-1000, temperature 70°C, mobile phase 0.01 N H2SO4, flow rate 0.5 ml/min, refractive index detector). Alcohols and volatile fatty acids in the fermentation
broth are detected both by liquid chromatography and by a 3600 Varian gaschromatograph equipped with a glass packed column with 80/120 Carbopack B-DA/4% Carbowax 20M (carrier gas N2, temperature program: 100°C 3 min, steep slope 50°C/min, 175°C 36 min) and a flame ionization detector. Gas and liquid chromatograph systems are connected to a personal computer where the CSW32 Software from Data Apex is used for data collection and processing.
Figure 1 – Experimental setup
B bioreactor, E pH electrode, M pH measurement, C controller, D dispenser for pH stabilization, T termometer, S magnetical stirrer, TJ termal jacket, GI gas input for inertization, LS liquid sampling, FLC foam-liquid collector, WT water tank, GDP gas displacing pump, WGC water-gas cylinder, GC gaschromatograph, SL sampling loop, SP sampling pump.
9 WT GDP WGC M E C T LS GI B SL SP FLC GC TJ S D
3. Results and Discussion
3.1 Microbical growth and fermentation
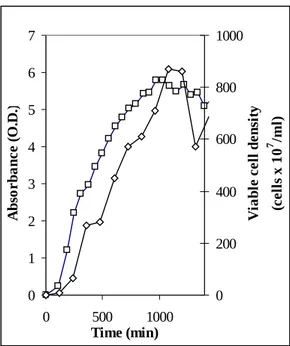
Several growing media have been explored to obtain high cell density starting conditions. Generally, when sugars were added to the growing medium as carbon source, glycolysis was the preferred metabolic way, then volatile fatty acids were produced and stopped the growth unless high phosphate concentrations had been used to buffer the medium. This is the reason why we preferred protein media, like NB, that enter the Krebs Cycle allowing to grow bacteria at higher microbical density without any buffering. The addition of 5gr/l yeast extracts (YE) improved the growth and with a double strength 2x(NB+YE) medium we generally obtain about 8 109 viable cells/ml (corresponding to 2.5-3 gr dry weight/l) in 16 hours (Fig.2).
Glucose fermentation has been investigated in 1 liter batch reactor. A 500 ml saturated culture of K.
oxytoca in NB medium has been diluted with sterile MM pH 5.5 and sparged with argon to attain
anaerobic condition. A 0.2 µm filtered glucose stock solution has been added for fermentation: the glucose concentration has been periodically checked and manually restored to the starting value.
0 1 2 3 4 5 6 7 0 500 1000 Time (min) A bs or ba nc e (O .D .) 0 200 400 600 800 1000 V ia bl e ce ll d en si ty (c el ls x 1 0 7 /m l)
Figure 2 – Growth curve of Klebsiella oxytoca in 2x(NB+YE). □ Absorbance at 600 nm, ◊ Viable cell density assessed as colony forming units.
The pH initial value was about 6 with a decreasing trend due to volatile fatty acids production. A first set of batch fermentations has been performed at pH 6 and different temperatures (30°, 34°, 37°, 40°C): the optimal temperature of 34°C has been obtained as the one with the higher value of the maximum production rate (mmol H2/grDW/h). In a second set of batch fermentations the pH has been hooked and maintained at different values between 5 and 6 (5.0, 5.25, 5.5, 5.75, 6.0), at 34°C: the pH 5.5 corresponding to the maximum value of hydrogen production rate has been adopted for further investigation.A starting glucose concentration between 0.5 and 2% resulted not to be critical and 1% has been generally used as starting glucose concentration.
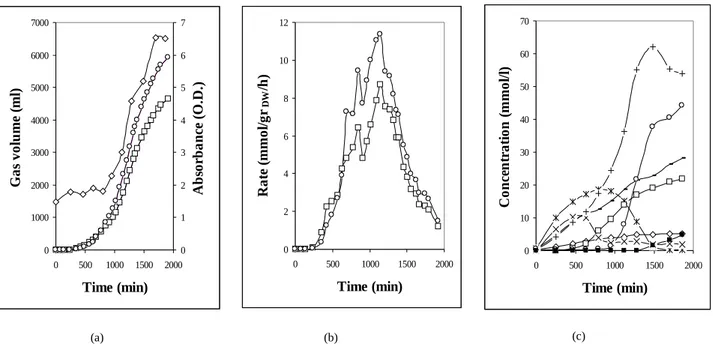
As facultative anaerobe, K. oxytoca also grows during fermentation even if at slower rate. Metabolism during fermentation has been investigated by the analysis of the fermentation products. For carbon balance purpose the following medium has been used as fermentation medium: Na2HPO4 48 mM, KH2PO4 22 mM, NaCl 8.6 mM, MgSO4 1 mM, CaCl2 0.1 mM, MnSO4 0.7 mM, FeCl2 40 µM, ZnCl2 40 µM, CoCl2 40 µM, Na2MoO4 40 µM, H3BO3 20 µM, pH 5.5 by HCl (after autoclaving and cooling, this medium presented a slight precipitate that had to be filtered by a sterile 0.45 µm filter) [11]. Bacteria grown in 2x(NB+YE) were centrifuged (6000g x 20 min) and resuspended in the above-mentioned minimal medium. Glucose 0.5-1% and NH4Cl 10-20 mM were maintained in the fermentation medium by frequently checking and restoring starting concentration when necessary. In Fig. 3 we report the microbical growth during fermentation, total gas volumes, gas production rates and the fermentation products accumulation. Carbon balance as calculated at the end of fermentation is reported in Table 1.
Figure 3 – Batch fermentation in minimal medium for carbon balance assessment. (a) Microbical growth and total gas production: ◊ absorbance at 600 nm, □ H2 volume, ○ CO2 volume. (b) Production rates: □ H2, ○ CO2. (c). Total products: + ethanol, ○ butyrate, - acetate, * lactate, □ 2,3-butanediol, ◊ succinate, x formate, ■ butanol.
Converted Glucose 1009.9
Biomass 145.2
Carbon dioxide 264.3
Alcohols ethanol butanol 2,3-butanediol
147.2 21.6 110.9
Volatile fatty acids formate acetate butyrate succinate lactate
2.1 71.8 216.9 27.0 3.2
Total products 1010.2 (+0.03%)
Table 1 – Carbon balance for the fermentation of Figure 3. All values are given in C-mmol. The average dry biomass composition CH1.74O0.43N0.23 reported by Roels (1983) has been considered [15].
11 0 1000 2000 3000 4000 5000 6000 7000 0 500 1000 1500 2000 Time (min) G as v ol u me ( ml ) 0 1 2 3 4 5 6 7 A b so rb an ce ( O .D .) 0 2 4 6 8 10 12 0 500 1000 1500 2000 Time (min) R at e (m m ol /g rDW /h ) 0 10 20 30 40 50 60 70 0 500 1000 1500 2000 Time (min) C on ce n tr at io n ( m m ol /l) (a) (b) (c)
Kinetics of the hydrogen production rate in batch stimulated further investigation. Generally, in the complex fermentation medium, the maximum value of the hydrogen production rate is attained in 200-300 min, after that an abrupt drop in the hydrogen production rate is always detected, irrespective of free or controlled pH mode (see Fig. 4 (a), (b)). Quite differently and depending on the fermentation conditions the CO2 production rate (not shown in the figure) can stay longer high, meaning that different metabolic ways are producing H2 and CO2: this seems to indicate that hydrogen production is a prompt electron capture mechanism of the bacterial cell in anaerobic conditions, but it is dropped when other methabolic ways become practicable. If so, in spite of the substrate economy the microbical growth should be substained during fermentation to maintain a high hydrogen production rate. Indeed, switching unsaturated suspensions to fermentation we noted that the bacterial growth in anaerobic conditions sustain the hydrogen production rate (e.g. see Fig. 5). Alternatively, taking advantage from using facultative anaerobic bacteria, we could maintain the maximum production rate by growing bacteria aerobically and continously introducing them into an anaerobic flow reactor (without any change in microbical density). Exploring this possibility in our experimental apparatus, in order to simultaneously stabilize pH, dilute the products of fermentation and refresh the microbical population, fresh cultured bacteria have been suspended in a phosphate solution MM pH 7 and this suspension was used for pH stabilization. The foam-liquid collector bottle has been removed and two synchronous pumps, driven by the pH stabilization system, have been used to maintain constant the fermentation volume. This operation mode can be considered a pH-driven continuous flow reactor and indeed enabled us to mantain the maximum production rate (Fig. 4d). In our opinion this separation between growth and fermentation could be of interest to obtain biohydrogen from a conventional plant for sewage sludge treatment, where the facultative anaerobic microflora can vigorously be grown in the aerobic stages.
0,00 0,02 0,04 0,06 0,08 0,10 0,12 0,14 0 500 1000 Time (min) H yd ro ge n pr od uc ti on r at e (m l/ m l/ h)
Figure 4 – Hydrogen production rates for different fermentation modes: □ batch at free pH, ◊ batch at fixed pH=5.5, ○ pH-driven continuous flow (neutralization buffer phosphate pH=7) ● pH-driven continuous flow (neutralization buffer phosphate PH=7 + aerobically grown bacteria).
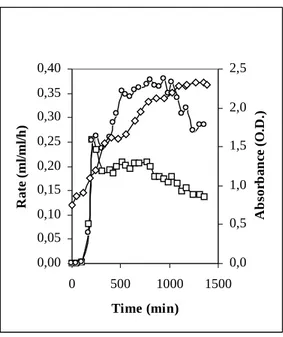
Figure 5 – Batch fermentation in growth sustaining conditions. 500 ml of NB 3x have been inoculated and bacteria have been grown aerobically until the exponential phase. Then the suspension has been diluted by 500 ml of MM pH 5.5 + 1% glucose and switched to anaerobic condition. □ H2 production rate, ○ CO2 production rate, ◊ absorbance at 600 nm.
3.2 Medium induced metabolic switches
The low yield of hydrogen production from facultative anaerobic bacteria, due to their metabolism more branched with respect to strict anaerobic and thermophilic bacteria, is considered the main hindrance to their application on a large scale [9]. Mutagenesis and genetic engineering have been used to obtain strains of facultative anaerobes with less branched metabolisms and higher hydrogen yields [12].
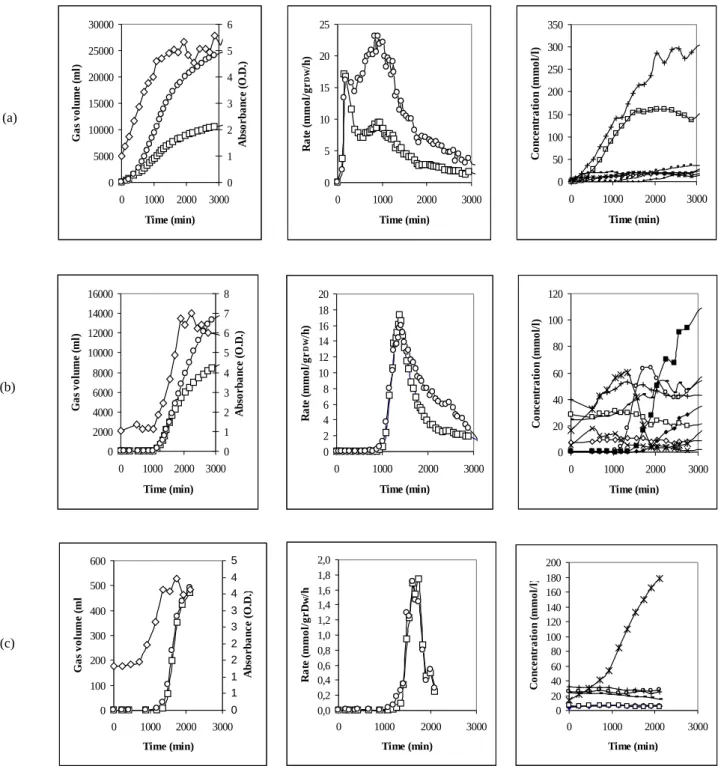
Indeed the medium initial composition seems to have an important role in addressing bacterial metabolism. Klebsiella oxytoca has been diffusely investigated in the twentieth century as 2,3-butandiol producer [13]. In our hands 2,3-2,3-butandiol and ethanol are the main products when a glucose containing complex medium is used for fermentation (see Fig. 6a), but we did not observe a significant production of 2,3-butandiol in the minimal medium we used for carbon balance (cfr. Fig. 3). In the complex fermentation medium bacterial growth was prompt but a low ratio H2/CO2 was attained due to a dominant alcholic fermentation and the yield was about 0.8 mol H2/mol glucose. In the minimal medium, bacteria started to grow after a lag phase of about 17 hours and production of ethanol and butyrate were the preferred metabolic ways, with a H2/CO2 ratio near to 1 and a higher yield of about 1.2.
As a matter of speculation we wondered if the addition of small quantities of alcohol and volatile fatty acids in the initial composition of the fermentation medium would have been able to induce bacteria to not produce them further. In Fig. 6b the initial fermentation medium was exactly the same as in Fig. 6a, but before bacteria resuspension, alcohols and volatile fatty acids had been
13 0,00 0,05 0,10 0,15 0,20 0,25 0,30 0,35 0,40 0 500 1000 1500 Time (min) R at e (m l/m l/h ) 0,0 0,5 1,0 1,5 2,0 2,5 A b so rb an ce ( O .D .)
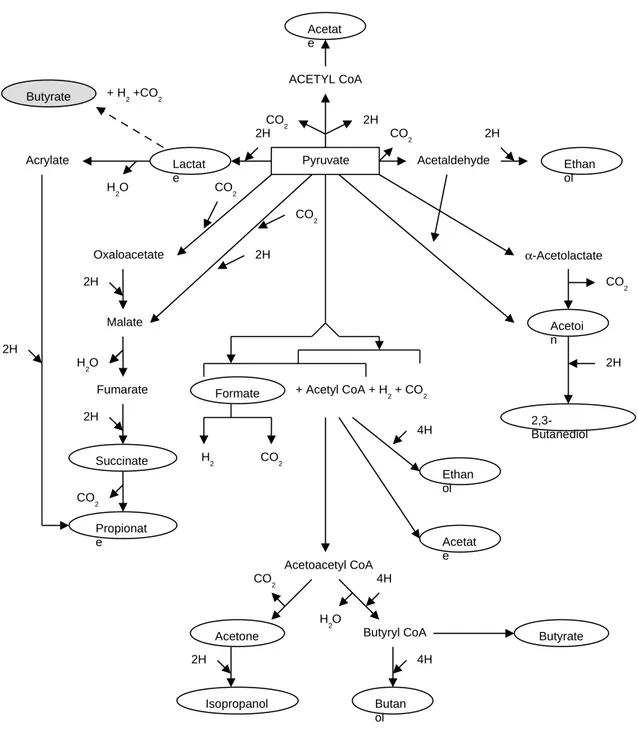
added as indicated in the figure caption and the pH has been re-adjusted to 5.5 by NaOH. Actually production of 2,3-butandiol and ethanol was almost stopped, favouring a moderate mixed acid fermentation. In this case the H2/CO2 ratio comes closer to 1. Referring to the scheme in Fig. 7 [14], we noted that all the metabolic ways can be explored by Klebsiella oxytoca depending on the initial conditions and on the time. Syncronous lactate decrease and butyrate increase could indicate the additional occurrence of a lactate to butyrate fermentation with H2 and CO2 production (2 lactate => 1 butyrate + 2 H2 + 2 CO2). In such a case we should subtract from the total produced hydrogen the share of the initial lactate, to obtain the yield on glucose that approaches 1.2. Butanol and butyrate addition to the initial composition avoided their production by bacteria (Fig. 6c), but in this case a pure lactic fermentation took place, almost without any gas production.
Closing the other main metabolic ways but the butyrate one, we increased the initial lactate in order to inhibit lactate production. Addition of even 60 mmol/l of lactate to the initial composition of the fermentation medium was not sufficient to stop its production by bacteria. Indeed, lactate accumulation resulted to be the last metabolic way experienced in fermentation by a degenerating microbical culture (Fig. 8), generally avoided only in continuous flow regime.
Figure 6 – Batch fermentations at different initial conditions. 500 ml of a saturated culture of K.
oxytoca in 2x(NB+YE) have been centrifuged and resuspended in 500 ml 2x(NB+YE)
+ 500 ml MM pH 5.5 and 1% of glucose has been added and maintained during fermentation. (a) Referring basic composition. (b) Same as (a) but ethanol 40 mM, 2,3-butandiol 28 mM, acetate 24 mM, lactate 16 mM, succinate 7 mM, formate 5 mM, acetoin 1 mM, butyrate 1 mM. (c) Same as (a) but ethanol 32 mM, 2,3-butandiol 7 mM, acetate 24 mM, lactate 14 mM, succinate 5 mM, butyrate 25 mM, butanol 1 mM. For each composition total gas production, production rates and total products are given. Gas symbols: □ H2, ○ CO2 . Liquid products symbols: + ethanol, ○ butyrate, - acetate, * lactate, □ 2,3-butanediol, ◊ succinate, x formate, ■ butanol.
15 0 5000 10000 15000 20000 25000 30000 0 1000 2000 3000 Time (min) G as vo lu m e (m l) 0 1 2 3 4 5 6 A bs or ba nc e (O .D .) 0 5 10 15 20 25 0 1000 2000 3000 Time (min) R at e (m m ol /g r D W /h ) 0 50 100 150 200 250 300 350 0 1000 2000 3000 Time (min) C on ce nt ra ti on (m m ol /l ) 0 2000 4000 6000 8000 10000 12000 14000 16000 0 1000 2000 3000 Time (min) G as vo lu m e (m l) 0 1 2 3 4 5 6 7 8 A bso rb an ce (O .D .) 0 2 4 6 8 10 12 14 16 18 20 0 1000 2000 3000 Time (min) R at e (m m ol /g r D W/h ) 0 20 40 60 80 100 120 0 1000 2000 3000 Time (min) C on ce nt ra ti on (m m ol /l ) 0 100 200 300 400 500 600 0 1000 2000 3000 Time (min) G as v ol um e (m l) 0 1 1 2 2 3 3 4 4 5 A bs or ba nc e (O .D .) 0,0 0,2 0,4 0,6 0,8 1,0 1,2 1,4 1,6 1,8 2,0 0 1000 2000 3000 Time (min) R at e (m m ol /g rD w /h ) 0 20 40 60 80 100 120 140 160 180 200 0 1000 2000 3000 Time (min) C on ce nt ra ti on (m m ol /l ) (a) (b) (c)
Figure 7 – Metabolic pathways of the microbical fermentations from pyruvate, as reported in Ref. 14. We inserted the lactate to butyrate fermentation way as it comes from our experimental results. 16 Acetat e ACETYL CoA Pyruvate 2H CO 2 Acetaldehyde CO2 Ethan ol 2H Lactat e 2H Acrylate H2O Butyrate + H2 +CO2 Oxaloacetate CO2 Malate 2H H 2O Fumarate 2H Succinate CO 2 Propionat e 2H CO2 2H CO 2 α-Acetolactate Acetoi n 2H 2,3-Butanediol
Formate + Acetyl CoA + H2 + CO2
H2 CO2 4H Ethan ol Acetat e Acetoacetyl CoA CO 2 4H H2O
Acetone Butyryl CoA Butyrate
2H
Isopropanol
4H
Butan ol
0 50 100 150 200 250 300 0 2000 4000 6000 8000 10000 12000 Time (min) C on ce nt ra ti on s (m m ol /l )
Figure 8 – Batch fermentation in the following initial medium composition: same as Fig. 6 (a) but lactate 60 mM, ethanol 30 mM, acetate 24 mM, 2,3-butandiol 7 mM, succinate 5 mM, butanol 1 mM. Symbols: + ethanol, ○ butyrate, - acetate, * lactate, □ 2,3-butanediol, ◊ succinate, x formate, ■ butanol, ♦ isopropanol.
4. Conclusions
Klebsiella oxytoca isolated from a municipal sewage sludge has been characterized and resulted an
excellent microbical tool for biohydrogen investigation. The short-term kinetics of the hydrogen production rate has been modified refreshing the microbical population by introducing aerobically grown bacteria. Switches in metabolic pathways, induced by changing the initial composition of the fermentation medium, resulted in a 50% increase of the hydrogen yield on glucose.
5. References
1. Rifkin J. The Hydrogen Economy: The Creation of the Worldwide Energy Web and the Redistribution of Power on Earth. Tarcher/Putnam, 2002
2. Mazza P, Hammerschlag R. Carrying the Energy Future: Comparing Hydrogen and Electricity for Trasmission, Storage and Transportation 2004, ILEA Seattle
3. DOE-Office of Fossile Energy: Hydrogen from Coal Program – Research, Development and Demonstration Plant, 2004-2015
4. IAEA-TECDOC-1085: Hydrogen as an energy carrier and its production by nuclear power. IAEA, Vienna, 1999. ISSN 1011-4289
5. Myers DB, Ariff GD, James BD, Kuhn RC. Hydrogen from Renewable Energy Sources: Pathway to 10 Quads for Transportation Uses in 2030 to 2050. DOE Grant N. DE-FG01-99EE35099
6. BioHydrogen edited by Oskar R. Zaborsky. Proceedings of an International Conference on Biological Hydrogen Production, Waikoloa (Hawaii), June 23-27, 1997. Plenum Press 1999
7. RITE: Interim Evaluation Report of Development of Environmentally Friendly Technology for the Production of Hydrogen, December 1995
8. Miyake J. The Science of Biohydrogen. An Energetic View. In BioHydrogen edited by Oskar R. Zaborsky Plenum Press 1999, pag. 7-18
9. Bio-Methane & Bio-Hydrogen. Status and Perspectives of Biological Methane and Hydrogen Production. Edited by J.H. Reith, R.H. Wijffels and H. Barten. Smiet offset, The Hague, 2003
10. Nat K, Das D. Improvement of Fermentative Hydrogen Production: Various Approaches. Appl. Microbiol. Biotechnol. 2004; 65: 520-529
11. Wong SH, Cullimore DR, Bruce DL. Selective Medium for the Isolation and Enumeration of
Klebsiella spp.. Appl. Environ. Microbiol. 1985; 49: 1022-1024
12. Kumar N, Ghosh A, Das D. Redirection of Biochemical Pathways for the Enhancement of H2 Production by Enterobacter cloacae. Biotechnology Letters 2001; 23:537-541
13. Voloch M, Jansen NB, Ladisch M.R., Tsao GT, Narayan R, Rodwell VW. 2,3-Butanediol. In Comprehensive Biotechnology vol.2 pag. 933-947, 1986. Pergamon Press Ltd.
14. Bailey JE, Ollis DF. Biochemical Engineering Fundamentals, Second Edition, McGraw-Hill Book Co. 1986
15. Roels JA, Energetics and Kinetics in Biotechnology, Elsevier Amsterdam 1983, pag. 99-128
Edito dall’
Servizio Comunicazione
Lungotevere Thaon di Revel, 76 - 00196 Roma
www.enea.it
Stampa: Tecnografico ENEA - CR Frascati Pervenuto il 10.2.2014