Italian Review of Agricultural Economics Vol. 74, n. 3: 29-41, 2019
ISSN 0035-6190 (print) | ISSN 2281-1559 (online) | DOI: 10.13128/rea-11210 Citation: F. Bozzo, V. Fucilli, A.
Petrontino, S. Girone (2019) Identi-fication of High Nature Value Farm-land: a methodological proposal. Ital-ian Review of Agricultural Economics 74(3): 29-41. doi: 10.13128/rea-11210 Copyright: © 2019 F. Bozzo, V. Fuci-lli, A. Petrontino, S. Girone. This is an open access, peer-reviewed arti-cle published by Firenze University Press (http://www.fupress.com/rea) and distributed under the terms of the Creative Commons Attribution License, which permits unrestricted use, distri-bution, and reproduction in any medi-um, provided the original author and source are credited.
Data Availability Statement: All rel-evant data are within the paper and its Supporting Information files.
Competing Interests: The Author(s) declare(s) no conflict of interest.
Identification of High Nature Value Farmland: a
methodological proposal
Francesco Bozzo1, Vincenzo Fucilli1, Alessandro Petrontino2,
Stefa-nia Girone2
1 Department of Agricultural and Environmental Science - University of Bari 2 SINAGRI s.r.l. Spin-off of the University of Bari
Abstract. The concept of HNVF raises thanks to the integration of biodiversity theme
into the CAP. The precise definition of the topic and the application of a correct identi-fication procedure deeply affect the assessment needs of European RDPs. Nevertheless, the level of HNVF knowledge is rather limited due to a methodological variability and a structural lack of suitable data. The research aims at overtaking HNVF identification difficulties complying with specific Community requirements and the use of an effi-cient theoretical framework that allows accurate location and monitoring over time. The methodology results in characterization and accurate HNVF map for the Apulia Region that can effectively calibrate the implementation of the regional management policies.
Keywords: biodiversity, agricultural intensity, natural value, GIS, landscape, ecological
economics, ecosystem services, biodiversity conservation, bioeconomics, industrial ecology.
JEL codes: Q570.
1. INTRODUCTION
1.1 Definition of high natural value and classification of HNVF
The radical changes that have affected agricultural systems and agri-cultural landscapes in relatively recent years have led agriagri-cultural areas to play a key role in the conservation of specific habitats for many animal and plant species. The concept of High Nature Value Farmland (HNVF) was created in response to the need to safeguard biodiversity even outside the habitats placed under special protection regimes (for example those deriv-ing from the Habitats Directive), also considerderiv-ing the growderiv-ing attention of local communities towards the issue of biodiversity and agro-biodiversity conservation programs (Sardaro, et al., 2016). In Europe, the concept of HNVF developed in the early 1990s (Baldock et al., 1993; Beaufoy et al., 1994), focusing attention on agrarian systems characterized by low density of cultivated plants and farmed animals, a reduced use of chemical inputs
and a massive use of labour-intensive practices, espe-cially manual (such as sheep-farming). This concept has progressively evolved thanks to the integration of envi-ronmental issues within the Common Agricultural Pol-icy (CAP). In this regard, high-nature value farmlands are those areas where agriculture represents the preva-lent land use and to which is associated the presence of a high number of species and habitats, as well as par-ticular species of Community protection concern. These are areas whose low agricultural intensity matched well with a high presence of semi-natural vegetation or with agriculture that gives the landscape a mosaic appear-ance; the latter defined by a diversified ground cover richness in semi-natural and artificial. According to some recent estimates provided by the quantification of the context indicator number 37 of the CMEF1
(Euro-pean Commission, 2015), about 32% of Euro(Euro-pean agri-cultural areas is qualified as High Nature Value (mainly concentrated in Eastern and Southern Europe). Particu-lar habitats, such as semi-natural grasslands, steppes and small mosaic areas with numerous landscape ele-ments constitute these areas; HVNFs are also abun-dantly present in mountain areas. In Italy, these agricul-tural systems can be mainly associated with semi-natu-ral pastures, permanent meadows, traditional orchards and arable crops (Trisorio et al., 2012).
Specific projects promoted by the European Envi-ronment Agency (Andersen et al., 2003) and the Europe-an Commission (IEEP, 2007a Europe-and 2007b) identified the key features of HNVF. They are identified in low-inten-sity agricultural systems; semi-natural vegetation; high diversity of land cover. The above-mentioned researches have shown that the dominant feature of HNVF is the low intensity of the agricultural activity carried out together with the presence of semi-natural vegetation. In the case in which the latter is reduced, however, a high degree of diversity of land cover (mosaic structure) together with a low intensity of production activities can still ensure significant levels of biodiversity, especially in the presence of sufficient elements capable to preserve ecological niches. However, even areas with intensive farming can allow the maintenance of important species of conservation interest (for example, birds), so that the only degree of diversity of land cover does not allow to verify univocally the presence of HNVF.
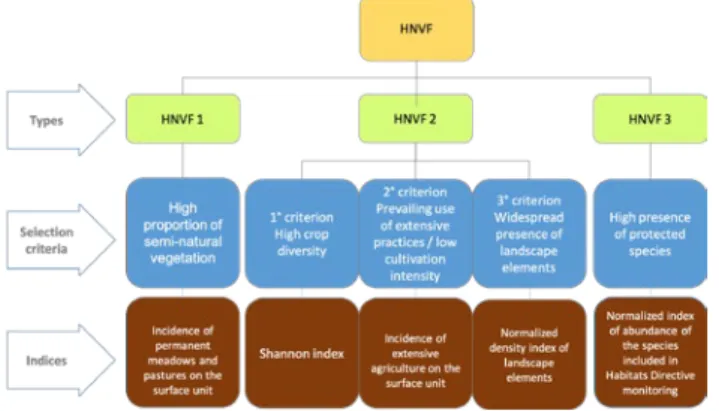
From the aforementioned works and from the analy-sis of the literature we can see that classification in three typologies of the HNVF areas already exists:
• Type 1: Agricultural land with high coverage of semi-natural vegetation;
1 Common Monitoring and Evaluation Framework of the Common
Agricultural Policy.
• Type 2: Agricultural lands dominated by low-inten-sity agriculture or by a mosaic of semi-natural and cultivated territories;
• Type 3: Agricultural land with rare species or a high proportion of animal and/or plant species of conser-vation interest at European or world level.
However, even today the level of definition of HNVF, in scientific terms, as well as in relation to their spatial distribution is still rather limited, on both a European scale and, even more, a national and region-al scregion-ale. The necessary systematization and consequent identification are dictated, in addition to the posi-tive externalities (Madureira et al., 2013), also from the observation that an adequate cognitive system can allow modulating, adequately, effectiveness and efficiency of policies regarding the different types of agricultural are-as they are implemented on.
In recent studies, scientists pay attention to the characterization of HNVF from a social and environ-mental point of view. The main idea is to connect HNVF with ecosystem services provided by agricultural habitat such as carbon storage, flood control or water purifica-tion, support services such as oxygen atmospheric pro-duction or cultural services where agro-tourism occu-pies an increasingly relevant role (Dumitrascu, et al. 2018). In other words, links among traditional farming practices and survival of viable rural communities are investigated. Other researchers deal with micro prop-erties of HNVF: Vigani and Dwyer (2019) propose a characterization of farms in marginal economic and high nature value conditions aiming to help to identify farm-level management and policy options for econom-ic, environmental and social sustainability. Moreover, post-2020 CAP reform confirms the attention towards environmental sustainability, biodiversity and landscape (as well as a fair income for farmers). Main changes of post-2020 CAP concern the way Member States (MSs) will determine how to achieve objectives and targets, assuring a more tailored use of CAP support. The ‘per-formance-based delivery model’ gives much subsidiarity and responsibility to MSs that are asked to set objectives and targets also for semi-natural/semi-improved agricul-tural habitats (not listed in Annex 1) that are declining, or at risk of declining, and their associated farmland species. HNVF will have a key role in future CAP while MSs are still developing ways of mapping, targeting and monitoring the location/extent of HNVF (IEEP, 2018). Mapping HNVF at the regional or national scale is a complex object of research also because, as with habitat quality indicator (CICES Version 5.1, 2019), HNVF is a non-specific indicator, that needs to be treated with una-voidable assumptions and generalizations.
1.2. Aspects concerning the identification of HNVF
The methodological variability described by the lit-erature is usually associated with a structural lack of data and information needed for correct identification of the HNVF areas. The three typologies identified by Andersen pose different problems about their charac-terization and individuation. For this reason, two com-plementary approaches have been developed, to which a third is added (although less used in the studies con-ducted so far). The first, starting from the analysis of the «land cover» is based on the relationships existing between the «agricultural classes» and between «agri-cultural classes» and protected habitats and species. The second considers the study of farm types combin-ing agronomic and economic data. The third studies the effective distribution of wild species in agricultural are-as (Fig. 1). It highlights how the Institute for European Environmental Policy (IEEP) in the most recent report on the topic (IEEP 2014) encourages the individual EU States and the administrations involved to operate at least a joint use of the first two approaches to ensure correct identification of HNVF areas.
On an operational level, the work of Andersen et al. (2003) identified the potential HVNF areas on a Euro-pean scale by combining the cartographic information of the Corine Land Cover (CLC) with the statistical-economic information of the Farm Accountancy Data Network (FADN). Although useful for an overview, such maps designed and implemented throughout the EU still require more detailed data, taking into account nation-al and, obviously, regionnation-al data sets. For these reasons, JRC and EEA carried out a review of the methodological part, concerning the mapping of the land cover, which led to the development of a new map on a European scale in the period 2005-2007.
The work widespread by the Italian National Rural Network (NRN, 2014) follows the land cover approach and uses data from the statistical survey AGRIT2010 of the Ministry of Agricultural and Forestry Policies (MIPAAF) integrated with data derived from CLC and from the database of Italian sites designated at national or European level interest in protecting habitats of com-munity interest. In fact, even if CLC appears today the best available source of land cover data it is clear that its use as an instrument aimed at the localization of HNVF on a regional scale has several limits, such as the great-er detail required, the low updating frequency and the absence of elements pertaining to the intensity of cul-tivation2. Another study recently conducted in Apulia
(Campedelli et al. 2018) focuses on the analysis of terri-torial suitability to host species of birds of conservation interest. It, therefore, follows the third approach to eval-uate the HNVF quality starting from NRN identification results.
The European Evaluation Helpdesk for Rural Devel-opment3 has published an interesting document to allow
the construction of a methodology that responds to spe-cific knowledge and monitoring needs on HNVF areas either at a state or at a regional level. An important point concerns the need to define HNVF areas in a spatially explicit form. This requires conducting the analysis in a GIS environment and using geo-referenced data and information. It is also necessary to integrate methods based on land cover (HNVF type 1 and 2) and methods based on cultivation/breeding intensity (HNVF type 2) and possibly methods based on the distribution of spe-cies (HNVF type 3). The approach must also be dynamic to allow monitoring of the evolution of the phenomenon. The data used in the analysis must necessarily follow the changes occurring in the agricultural areas and the recording of these variations must take place in a short time to appreciate the changes in the quantity and dis-tribution of the HNVF areas. Data used in the analysis can be secondary or primary. These may be specific to HNVFs or be part of larger biodiversity and habitat mon-itoring programs (Oppermann et al., 2012). It is also nec-essary to record the qualitative variations of the HNVF areas and the steps that can take place from one qualita-tive status to another, in terms of intraspecific variations (increase or decrease in the level of biodiversity and/or
2 Analysis of the literature shows that the data used in the studies
con-cerning the identification of HNVF areas derive essentially from Corine Land Cover 2012 (IV Level), Regional Thematic Maps, Habitats and Nature Maps with indication of the overall index of ecological value (corine Biotopes), from the hydrography and orography maps.
3 Directorate-General for Agriculture and Rural Development - Unit E.4
(2016): Working Document Practices to Identify, Monitor and Assess-ment HNV Farming in RDPs 2014-2020.
Fig. 1. Methodological approaches used in literature by type.
natural value within a typology HNVF) or interspecific (transition from one HNVF type to another). To appreci-ate the changes, obviously, the use of the same methods and data sources is strongly recommended.
2. METHODOLOGY 2.1. Methodological approach
The aim of these researches is to identify a method-ology that allows quantifying, localizing and monitoring over time HNVF areas at the regional level. It is based on a solid theoretical framework developed by Anders-en (2004) and on the criteria proposed by the European Evaluation Helpdesk for Rural Development.
The theoretical framework allows structuring the methodology adopted through a cascade process high-lighted in the following steps:
• identification of the most appropriate single or mul-tiple criteria to break down the three types;
• choice of the indexes that return the types and choice of the aggregation methods between indica-tors;
• selection of indicators measuring the phenomenon defined by the index and corresponding to the cho-sen criteria;
• choice of data sources;
• choice of the format of the analysis and the geo-graphical scale of the survey;
• selection of spatial analysis tools for data conversion.
2.2. Description of the methodology
Starting from the above-mentioned framework, the concept of HNVF can be considered from two points of view: the naturalness of the areas and the type of man-agement of the agricultural systems. The territorial nat-uralness is determined by the predominant land cover within each agricultural system, with reference to the agricultural land use, to the types of semi-natural veg-etation, to the elements of biodiversity, to the landscape elements and the historical-cultural value. Instead, the component of the management of agricultural systems is determined on a farm scale, with reference to the cul-tivation models and the intensity of use of fertilizers, plant protection products, irrigation and mechanization. In order to select the indices and the indicators used to satisfy the criteria of HNVF areas, a check was made on the naturalness elements and on the type of manage-ment of the agricultural systems.
Figure 2 describes the criteria adopted to allow, as mentioned, the decomposition of the three types or to allow the re-composition of the indices (and the indica-tors) in a way that guarantees the satisfaction of the pre-scriptions of the theoretical framework. Furthermore, based on the criteria, the indices and the most appropri-ate aggregation methods are defined. The choice of the indices also derives from their ability to directly meas-ure the phenomenon that defines the type, as in the case of types 1 and 3, or the possibility of being able to aggre-gate them in a logical manner, as in the case of type 24.
HNVF type 1 areas are identified starting from ter-ritories where agriculture is the predominant use and where it is carried out with the concomitant high pres-ence of natural or semi-natural spaces. Several sources (for example the comparison between the land use map and the Nature Map5) show a frequent overlap between
the agricultural areas belonging to the classes of mead-ows, natural and uncultivated pastures with habitats of significant naturalistic value. The correct identification of natural meadows and pastures is therefore of fun-damental importance for the identification of type 1 HNVF areas.
The second type of agricultural areas with a high naturalistic value is identified by the presence of three aspects of the agricultural territory attributable to the low intensity of cultivation in support of biodiversity. In particular, crop diversity requires a limited speciali-zation of production and greater complexity of the agri-cultural landscape, benefiting the spread of wild species. Moreover, the presence of extensive practices is defined by poor use of agricultural inputs, therefore a limited
4 For type 2 HNVF areas, a non-compensatory aggregation of the 3
indices was chosen to allow compliance with the criteria.
5 ISPRA, 2004 and 2009.
Fig. 2. Scheme for the identification of HNVF area types based on criteria and relative indices.
disturbance for biodiversity. Finally, agricultural land-scape elements constitute an important refuge and terri-torial connection features for the wild species.
As mentioned, the logical process and the conse-quent elaborations are crucial to define the second type of HNVF areas, strongly linked to the following criteria: • 1st high crop diversity;
• 2nd prevalent use of extensive practices;
• 3rd diffuse presence of agricultural landscape
ele-ments.
In the first case, the presence of an identifiable «agro-ecomosaic» is assumed with a sustained diversity of the crops present in the analysis unit. The employ-ment of a diversity index can represent the richness of the «agro-ecomosaic». Shannon’s diversity index (Shan-non, Weaver, 1949; Pielou, 1975; Magurran, 1988; McCa-rigal, Marks, 1995; Crimella et al., 2001; Turner et al., 1989, 2001) is able to measure diversity of the agricul-tural landscape in terms of «agro-ecomosaic» richness. The greater the value, the greater the degree of diversity registered in the unit of analysis.
The second criterion related to the identification of the second HNVF type requires that areas of the investi-gated territory are identified where agriculture is sive or where the agricultural practices used are exten-sive. In the literature, the intensity of agricultural land (Turner & Doolittle, 1978; Temme & Verburg, 2011; Teil-lard et al., 2012) refers to the level of use of input (water, mechanization, fertilizers and plant protection prod-ucts). The greater the application of them, the higher the level of intensity of agricultural activity carried out in those agricultural systems.
Finally, it should be noted that the structural ele-ments of the agricultural landscape are important fea-tures as these elements represent, in predominantly agricultural land, the ecological corridors that are deci-sive for shelter, for food search and for movement needs of wild animal species as well as important ecotones for wild plant species. The density of these elements on the surface unit represents, quantitatively, the capacity of the agricultural territory to provide benefits deriving from the presence of ecological corridors. The three criteria, if satisfied simultaneously in a defined territorial unit, give rise to HNVF area of the second type, highly representa-tive of the capacity of agriculture to conserve animal and plant biodiversity6.
The third type of HNVF areas may seem apparently simple and easy to understand. Instead, even in the pres-ence of a conventional type of agriculture (and in the absence of particular elements of widespread
natural-6 Operationally this means that a non-compensatory aggregation
meth-od has been adopted.
ness) it is necessary to consider the presence of animal and plant species of non-agricultural interest. The abun-dance criterion of species of conservation interest can define these areas.
According to the framework steps described, Table 1 contains the overall synoptic table, which, starting from the indices, proposes the indicators that are able to measure every single phenomenon included in the index. Each choice complies with the theoretical framework. In fact, all the indicators can be calculated by using one or more alternative data sources, each of which is evaluated in terms of the possession of specific requisites (spatial detail, dynamism, updating). These requirements deter-mined the choice of data sources7.
According to Table 1, the geographic information system was prepared and developed by using the follow-ing information layers:
• Sentinel-2 Multiband Satellite Data. • FADN Database.
• Species distribution maps from the Habitat Directive monitoring program.
• Apulia Regional Technical Map.
With regard to the data source, the need to identify a dynamic and at the same time speedy instrument that does not involve the high costs of direct investigations, let it look with particular care to the use of Sentinel 2 satellite images. Sentinel-2 is the newest generation Earth observation (EO) satellite of the European Space Agency (ESA) for land and coastal applications included crop and forest classification. The satellite, launched on June 2015, is part of Europe’s Copernicus program aiming at independent and continued global observation capaci-ties. Compared to Landsat satellites, Sentinel-2 offers an increased spectral and spatial resolution with 13 spectral bands of 10 to 60 m spatial resolution (Vuolo et al., 2016). Moreover, in terms of temporal resolution, Sentinel-2 give an adequate update possibility with a combined constel-lation revisit frequency of 5 days. In comparison, Corine Land Cover, commonly used for such purposes, precisely identifies the land use classes that represent the starting point for the calculation of indexes. It has a good themat-ic resolution not supported by a time resolution (about 5 years) and a spatial resolution (Minimum Mappable Unit of 25.000 square meters), able to provide adequate dispos-ing of the transformations takdispos-ing place on agriculture landscape. Moreover, in the same way, the National Agri-cultural Census has a too long updating period and a geo-graphical detail unit too large (Municipality).
The use of satellite images requires the application of appropriate methods for remote sensing such as
super-7 For example, the CLC was considered unsuitable because it did not
vised classification methods or automatic ones. Recogni-tion techniques have been evaluated among a few other for its large application in studies concerning land cover maps production from satellites images, computation efficiency and reliability of the algorithm. Maximum Likelihood Classification (MLC) was preferred in
con-sideration of large use of the technique and the simpli-fied land cover map obtaining procedure. Moreover, MLC is included in the Semi-Automatic Classification Plugin (SCP), a free open-source plugin for QGIS, used in many studies and promoted by ISPRA (Institute for Environmental Protection and Research – Italy).
Tab. 1. Evaluation of indicators and data sources.
Indices Indicator Source Spatial detail Dynamicity Update
Incidence of permanent meadows and pastures on the surface unit
Incidence of permanent meadows and pastures on
the surface unit Sentinel 2 Raster with a 10m cell yes 5 days
Shannon index Incidence of the arable lands on the surface unit Sentinel 2 Raster with a 10m cell resolution yes 5 days Incidence of the woods on
the surface unit
Incidence of the permanent crops on the surface unit Incidence of the vines on the surface unit
Incidence of permanent meadows and pastures on the surface unit
Incidence of inland water on the surface unit
Incidence of extensive agriculture on the surface unit
Area covered by arable lands with low use of agricultural inputs
RICA data on the use of water, fertilizers, plant protection products and mechanization per hectare
Punctual data from RICA sample survey (necessary
interpolation) yes annual
Area covered by vines with low use of agricultural inputs
Area covered by permanent crops with low use of agricultural inputs Incidence of the woods on
the surface unit Sentinel 2 Raster with a 10m cell resolution yes 5 days Incidence of permanent
meadows and pastures on the surface unit
Normalized density index of landscape elements (aggregated index)
Agricultural point elements density (trees outside forest
or isolated trees) Regional technical map Punctual geometries partly 10-15 years Agricultural line elements
density (trees outside forest
or isolated trees) Regional technical map Linear geometries partly 10–15 years Incidence of the woods on
the surface unit (polygonal
elements) Sentinel 2
Raster with a 10m cell
resolution yes 5 days
Normalized index of abundance of the species included in Habitats Directive monitoring
Number of species on the surface unit included in Habitats Directive monitoring
Habitats Directive
monitoring Shapefile with a 10 km polygons yes 6 years Source: our elaborations.
The derived land cover map from Sentinel 2 data forms the basis on which to carry out the subsequent processing operations. Indeed, it has immediate rele-vance in the calculation of type 1 HNVFs, through the isolation of the class of meadows and natural pastures and, in the calculation of the index of crop diversity, by calculating the incidence of each of the classes per unit area and the application of the Shannon diversity index formula.
where:
• C: constant equal to 1;
• Pj: percentage incidence of the class J surface com-pared to the total;
• s: number of classes of crop types; • J: J-th class of crop type.
Although the description of indicators is not the main objective of this article, on the other hand, it is important to explain further the way the process is car-ried out. We focus on data sources, on the way spatial data are returned and on the territorial scale analysis is referred to.
The modality of data restitution (set the use of geo-referenced spatial data as a direct constraint) has con-ditioned the choice of the calculation methods to be performed in the GIS. This is a crucial step to prepare the methodology. It is important to pointing out that results of the calculation of indicators on a spatial basis can be returned in raster or vector format. The former format requires sizing the fictitious reference cell as an elementary unit of analysis while the latter one presup-poses the choice of the elementary territorial minimum figures such as particles, map sheets, farms or munici-palities. Each of the two outputs has positive and nega-tive elements that have been carefully evaluated both for the effect they have on analytical choices, and on the outcome, they may have regarding the use of results for public decision-maker use. Of course, while territo-rial figures like cadastral data are more understandable for decisional and political purposes, the use of raster cells, for which we have opted, albeit fictitious, is a flex-ible tool with a wide possibility of use. However, it is not excluded the possibility to re-project the results in a dis-crete form such as cadastral parcels.
Specific spatial elaborations appropriately modi-fied each layer in order to (i) prepare a dataset for our research analysis and (ii) make it compatible with a geographic result as a raster format with a 1000 meters cell (1 square kilometre). The scale of analysis, then the width of the fictitious reference cell for the calculation
of the indicators, was chosen to opt for a solution that would allow a fair compromise between time ease of cal-culation and effective appreciation of the phenomenon to be measured.
The analysis of agricultural systems through FADN and RICA8 databases presents several positive aspects to
identify HNVF areas (especially type 2). These data are regularly updated, which increases their usefulness for monitoring purposes. However, the possible non-repre-sentativeness of all agricultural systems potentially affect-ed by HNVF can be observaffect-ed. The data from the Agri-cultural Accounting Information Network, RICA, updat-ed annually by CREA9, provide useful information on
the location of the companies’ subject to the sample sur-vey and the indication of the levels of each input included in the analysis for each crop. The use of RICA microda-ta, however, requires a first phase of georeferencing and aggregation on a company basis of agricultural input data by crop type and then an interpolation phase that returns a continuous data on the use of inputs on the investi-gated agricultural territory. The point data of the farms from RICA survey have been collected according to crop types consistent with the Sentinel 2 land use classes. Afterwards, these point databases have been interpolated through a deterministic technique, the Inverse Distance Weight (IDW), in order to obtain a continuous surface covering the complete regional agricultural territory (Green S., O’Donoghue C., 2013; Fais A. et al., 2005).
The landscape elements from Regional Technical Map instead are submitted to spatial analysis aimed at converting punctual, linear or polygonal vector data into raster. Data used for density calculation of the agricul-tural landscape elements are represented by the Region-al TechnicRegion-al Map in which the punctuRegion-al features (trees outside forest or isolated trees), linear features (dry stone walls, hedges and tree-lined rows) and the polygonal fea-tures (wooded areas) in particular are highlighted. The vicariate nature of these elements imposes the selec-tion of a compensatory aggregaselec-tion method of the den-sity indexes, since presumably there is an abundance of maximum one of the feature types.
Moreover, the species abundance of conservation concern is measured through the wild species distribu-tion maps deriving from the monitoring of Habitats Directive. It is a 6 years update monitoring, consisting in the distribution of each species in indicative areas with a 10 kilometres grid.
The application of the proposed methodology with GIS on a regional scale requires the use of specific
spa-8 Agricultural accounting information network.
9 CREA Consiglio per la ricerca in agricoltura e l’analisi dell’economia
tial processing techniques and conversion procedures to transform satellite images, point databases or geometri-cally discrete vector data in continuous raster formats. The aforementioned techniques such as MLC for classi-fication of satellite images and IDW for interpolation of point data found in the literature among the most effec-tive and available on commercial and open-source soft-ware used for the intended purpose.
Finally, as in the most common multi-criteria analy-ses, the choice of thresholds represents a crucial, often criticized, topic. In HNVF identification, being an aggregated non-specific index, it is difficult to identify optimal and efficient values, indicative targets or even predetermined thresholds that satisfy the choose criteria. Therefore, we opted for the application of an ordinari-ness principle, well known in the evaluation and used because of its geographical relativity. Each classification of data and information took place in such a way as to represent the ordinariness of the phenomena diffusion and the particular specificity cases (high natural value).
Figure 3 shows the operational process performed by elaborating the spatial data in order to produce the HNVF types map. These maps can be overlapped to understand the respective distribution, to distinguish the percentage of typological coexistence as well as the qualitative differences between the different areas.
The theoretical framework and the methodol-ogy adopted (through a cascade process) have been detailed. Although each passage could be debated or even changed, the framework and the set of choic-es dchoic-escribed have undebatable advantagchoic-es. It has an instrumental value, built to satisfy a specific need of RDP’s: mapping HNVF, tailored to be used over time, systematic way to guide decision-makers and stakehold-ers towards the goal of determining the solution that best solves the problem.
3. RESULTS
As a result of the application of the above-men-tioned methodology, elaborations in Apulia (Italy) are described as follow. The three types of HNVF areas identified by applying the proposed methodology have a respectively territorial extension of 828,00 square kil-ometres, 2.454,00 square kilometres and 1.721 square kilometres, with a respective territorial incidence of 4.28%, 12.69% and 8.90%. Overall, considering also the areas where two or more types overlap, we reach a total regional endowment of 4,302 square kilometres that rep-resents approximately 22.2% of the regional area classi-fied as HNVF. As shown in the figure (Fig. 4), a preva-lence of type 2 emerges, followed by type 3 and type 1. Among the most widespread forms of overlapping, the areas in which type 2 and 3 coexist are 5.70% while type 1 and 3 overlap in 4.50 % of the classified areas.
The selection process identifies some specific core territories where HNVF concentrate, showing an agri-cultural landscape and agri-cultural system specialization. The central part of the region, known as «Alta Murgia», is classified prevalently as type 1. In the North West area, «Monti Dauni» has been classified as type 2 as well as «Murgia dei Trulli», «Valle d’Itria» in the mid-dle south area and inland Salento in the South. A mix-ture of typologies, instead, characterizes different terri-tories. Gargano in the upper east part of the Region is a complex of combination of all typologies represented, while coast of Salento is predominantly type 1 and 2 with a few hot spots of type 3, especially near wet retro-dunal areas. Some other zones have been excluded by the methodology. Indeed, results highlight how many characters contribute to the effectiveness of the analysis. Some of the excluded areas are affected by agriculture specialization such as olive groove monoculture (central Apulia). Some others reflect the predominance of inten-sive agricultural systems. As emerges from RICA data analysis, in those specific areas, intensity index associ-ated with the arable lands that represent the prevalent agricultural typology is decisive.
4. DISCUSSION
The study shows an application of an original meth-odology that derives from the implementation of a theo-retical framework with strong connections to Anders-en definitions of HNVF and the specific Community guidelines. Results reflect the multidimensional concept underlying HNVF. It lets us reaching a likely amount of areas with high natural value, also coherent with those
Fig. 3. Processing operations.
results obtained in studies analysed as following and with an internal consistency due to the representative-ness of the territories classified in the landscape plan-ning tools used at the regional level.
Comparing this methodology with that applied by the study officially used by regions for identifying HNVF (National Rural Network 2014), many advantages can be underlined. It is clear how the initial difficulty of combining land-use and cultivation intensity approaches on an adequate and homogeneous scale has been over-come. Furthermore, results from the cited study show that maps only have the function of summarily repre-senting the distribution of the HNVF areas in the terri-tory, while the matching numerical value corresponds to the estimate of SAU of each cell divided by the different degrees of natural value. In the National Rural Network study, a research on the different degree of membership to HNVF at a national scale, has been conducted. Start-ing from the results of this work our analysis focuses on a regional scale. It allows and at the same time deserves
a more detailed assessment of such kind of agricultural areas. Moreover, the results obtained in the work of Campedelli et al., 2018 try to validate the report of the National Rural Network, showing attention only towards bird species, leaving behind other animals (mammals and reptiles) or plants. It focuses especially on HNVF type 3 while advances a criticism towards approach on land cover and farming system. Our methodol-ogy, instead, aims at including and integrating different approaches. This can guarantee a greater accomplish-ment of the Helpdesk requests, trying to address each typology with a specific and adequate approach, aware that land cover is essential for type 1, farming system is crucial but not exhaustive for type 2 and species distri-bution for type 3.
Results appear to be coherent with Apulia territorial characteristics. In particular, a clear division between areas known and classified as separate landscape areas in the Regional Territorial Landscape Plan (PPTR Pug-lia) have been confirmed. Indeed, territorial
charac-Fig. 4. Overlay of HNVF maps.
terization deriving from both natural value and type of agriculture conducted in those areas can be easily recog-nized and overlapped with HNVF typology found with the application of the methodology.
The geographic area known as «Alta Murgia» is prevalently dominated by pastures and poor grassland as well as arable dry land. Here a clear abundance of HNVF type 1 is recorded. Moving from this area to south-east, we encounter a more diversified cultural system, where pasture gives way to orchards, olive groves and vine-yards as well as a heavier presence of woods, hedges and anthropic agricultural landscape elements, such as dry-walls. This area is well recognized as «Murgia dei Trulli», characterized by the typical agrimosaic of «Valle d’Itria». The application of the methodology in this context is accomplished with a massive selection of areas classi-fied as HNVF type 2, suggesting an appropriate use of thresholds and parameters used in the analysis.
In the north part of the region, two areas were identified as HNVF cores. Passing the «Tavoliere» area, where monoculture and intensive agriculture have been taken into account, leading to a clear exclusion of HNVF concept, as recorded in the results, «Gargano» and «Monti Dauni» are, rightly, subjects to selection. In the former area a net dominance of HNVF type 2 is observed, especially in the southern part. Here, there is marginal agriculture, typical of mountain and inland areas. The same characteristics can be found in the Gar-gano promontory where also an abundance of mountain and hilly pastures is recorded.
Ultimately, this preliminary application of the meth-odology leads to a comforting result since the extension of HNVF in Apulia is consistent with what can be found although in the scarce literature. The overall HNVF area is slightly below the results obtained by Trisorio et al., (2013) in which areas potentially classified as HNVF were estimated for Apulia in 40% of the total regional exten-sion, equal to 5,960,00 square kilometres (areas where medium and low potential are also included). The work of the JRC (2008) conducted on the NUTS2 scale; on the other hand, returns lower values, reaching a percentage of 15.9% and a total extension of 2,667,00 square kilometres.
5. CONCLUSIONS
HNVF areas have a rising strategic value for the CAP. In fact, the themes of conservation of agricultural systems with low environmental impact and biodiversity have become an essential part of the Community Agri-cultural Policy. The multiple references of the Regional, Italian and European Rural Development Programs to
the need to rely on a sure data concerning the quanti-fication of HNVFs require particular attention to this topic. With this aim, therefore, a modular instrument that allows identifying HNVF areas has been proposed, based on statistically rigorous methodologies and on data that can be updated over a short period in order to be useful to the public decision-maker. An objective that clashes with two problems of «structural» nature: the scarcity of data that at the same time respect all the requirements suggested by the Helpdesk and the difficul-ty of integrating geographically surveys with analysis of cropping systems. Technologies behind remote sensing and spatial interpolation have overcome these difficul-ties, with promising results. Despite the well approved significant role in crop classification and crop monitor-ing (Steven & Clark, 2013), remote sensmonitor-ing for the assess-ment of agricultural coverage in order to quantify CAP indicators is still an innovative topic. The EU Regula-tion no. 746/2018, strongly encourages the use of satel-lite image interpretation instead or in combination with traditional «on-site» checks, while supporting different methodological alternatives for CAP surface measure-ments. Furthermore, the combination of satellite data with crop data from RICA sampling survey makes it possible to integrate an approach based exclusively on land use with aspects concerning the management of agricultural inputs in order to identify agricultural sys-tems with different intensities. Finally, the research comes to the mapping of the different types of HNVF in Apulia showing high adaptability for other regions and, using data from different years, to compare the evolu-tion over time. A global amount of about 4.000 square kilometres of farmland areas with High Natural Value have been identified, corresponding to about 22% of the regional surface. The work carried out leads to results that are consistent with those found in the relevant lit-erature and is consistent with landscape plan (PPTR, 2015), the main policy tool for managing territorial transformation at a regional scale.
ACKNOWLEDGMENTS
The authors thank Dr. Rinaldo Grittani, Dr. Franc-esco Petrillo and Mrs. Enza A. Campanella for technical assistance.
REFERENCES
Andersen E., Baldock D., Brouwer F.M., Elbersen B.S., Godeschalk F.E., Nieuwenhuizen W., Hennekens S.M.
(2004). Developing a high nature value farming area indicator: Final report. EEA, Copenhagen, Denmark. Available at: https://library.wur.nl/WebQuery/wur-pubs/fulltext/3918
Baldock D., Beaufoy G., Bennett G., Clark J. (1993). Nature conservation and new directions in the EC Common Agricultural Policy: the potential role of EC policies in maintaining farming and management systems of high nature value in the Community. Institute for European Environmental Policy. Avail-able at: https://ieep.eu/publications/nature-conserva- tion-and-new-directions-in-the-ec-common-agricul-tural-policy-report-for-the
Bartolini F., Brunori G. (2014). Understanding link-ages between common agricultural policy and High Nature Value (HNV) farmland provision: an empiri-cal analysis in Tuscany Region. Agricultural and Food Economics, 2(1): 1-21. DOI: 10.1186/s40100-014-0013-2
Beaufoy G., Baldock D., Clark J. (1994). The nature of farming: low intensity farming systems in nine Euro-pean countries. London: Institute for EuroEuro-pean Envi-ronmental Policy.
Boyle P., Hayes M., Gormally, M., Sullivan C., Moran J. (2015). Development of a nature value index for pastoral farmland—A rapid farm-level assessment. Ecological Indicators, 56: 31-40. DOI: 10.1016/j. ecolind.2015.03.011
Campedelli T., Calvi G., Rossi P., Trisorio A., Florenzano G.T. (2018). The role of biodiversity data in High Nature Value Farmland areas identification process: A case study in Mediterranean agrosystems. Journal for nature conservation, 46: 66-78. DOI: 10.1016/j. jnc.2018.09.002
Chen J., Yang S., Li H.W., Zhang B., Lv J.R. (2013). Research on geographical environment unit divi-sion based on the method of natural breaks (Jenks). Int. Arch. Photogramm. Remote Sens. Spat. Inf. Sci, 47-50. Available at: https://www.int-arch- photogramm-remote-sens-spatial-inf-sci.net/XL-4-W3/47/2013/isprsarchives-XL-4-W3-47-2013.pdf CICES - Version 5.1 (last released version consulted in
June 2019). Towards a Common International Classi-fication of Ecosystem Services (CICES) for Integrated Environmental and Economic Accounting.
Cimini D., Tomao A., Mattioli W., Barbati A., Corona P. (2013). Assessing impact of forest cover change dynamics on high nature value farmland in Medi-terranean mountain landscape. CRA Journal DOI: 10.12899/ASR-771
Cooper T., Arblaster K., Baldock D., Farmer M., Beau-foy G., Jones G., Wascher D. (2007). Final report
for the study on HNV indicators for evalua-tion. Institute for European Environmental Pol-icy, London, 35. Available at: https://ieep.eu/ uploads/articles/attachments/62b84fd4-14c9-4561-998b-af6d98ea6810/hnv_indicator_report. pdf?v=63664509711
Dietrich J.P., Schmitz C., Müller C., Fader M., Lotze-Campen H., Popp A. (2012). Measuring agricultural land-use intensity–A global analysis using a model-assisted approach. Ecological Modelling, 232: 109-118. DOI: 10.1016/j.ecolmodel.2012.03.002
Dumitrascu M., Stefanescu S., Anghel A., Mocanu V., Sirbu C. (2018). Certain environment, economic and social aspects of the high natural value (hnv) farm-ing: romanian’s state of the art. Annals of the Univer-sity of Craiova-Agriculture, Montanology, Cadastre Series, 47(2): 119-123. Available at: http://anale.agro-craiova.ro/index.php/aamc/article/view/642
Esri online handbook. Available at: http://desktop.arc-gis.com/en/arcmap/latest/extensions/spatial-analyst/ image classification/creating-training-samples.htm (accessed on 1st February 2019).
European Commission (2015). Cap Context Indicators 2014-2020 37. High Nature Value Farming - 2015 Update. Available at: https://ec.europa.eu/agriculture/ sites/agriculture/files/cap-indicators/context/2015/ indicator-table_en.pdf
European Environment Agency (2004). High nature value farmland: Characteristics, trends and policy challeng-es. Office for Official Publ. of the Europ. Communi-ties. Available at: https://www.eea.europa.eu/publica-tions/report_2004_1
European Environment Agency (2005). Agriculture and Environment in EU-15: The IRENA Indicator Report. Office for Official Publications of the Euro-pean Communities. Available at: https://www.eea. europa.eu/publications/eea_report_2005_6
Fais A., Nino P., Giampaolo A. (2005). Microeconomic and geo-physical data integration for agri-environ-mental analysis, georeferencing FADN data: a case study in Italy. (No. 724-2016-49283). Available at: https://ageconsearch.umn.edu/record/24547/
Giménez M.G., de Jong R., Della Peruta R., Keller A., Schaepman M.E. (2017). Determination of grassland use intensity based on multi-temporal remote sensing data and ecological indicators. Remote sensing of envi-ronment, 198: 126-139. DOI: 10.1016/j.rse.2017.06.003 Green S., O’Donoghue C. (2013). Assessing the geo-graphic representativity of farm accountancy data. ISPRS International Journal of Geo-Information, 2(1): 50-66. Available at: https://ageconsearch.umn.edu/ record/212678/
Hazeu G., Milenov P., Pedroli B., Samoungi V., Van Eupen M., Vassilev V. (2014). High Nature Val-ue farmland identification from satellite imagery, a comparison of two methodological approaches. International Journal of Applied Earth Observation and Geoinformation, 30: 98-112. DOI: 10.1016/j. jag.2014.01.018
ISPRA (2004). Dati del Sistema Informativo di Carta del-la Natura deldel-la regione Puglia.
ISPRA (2009). Dati del Sistema Informativo di Carta del-la Natura deldel-la regione Puglia.
Keenleyside C., Beaufoy G., Tucker G., Jones G. (2014). High Nature Value farming throughout EU-27 and its financial support under the CAP. Institute for European Environmental Policy. Available at: http:// ec.europa.eu/environment/agriculture/pdf/High%20 Nature%20Value%20farming.pdf
Lazzerini G., Dibari C., Merante P., Pacini G.C., Moschi-ni V., MiglioriMoschi-ni P., Vazzana C. (2015). Identification and mapping the high nature value farmland by the comparison of a combined and species approaches in Tuscany, Italy. Italian Journal of Agronomy, 10(3): 132-143. DOI: 10.4081/ija.2015.676
Lomba A., Alves P., Jongman R.H., McCracken D.I. (2015). Reconciling nature conservation and tradi-tional farming practices: a spatially explicit frame-work to assess the extent of High Nature Value farm-lands in the European countryside. Ecology and evo-lution, 5(5): 1031-1044. DOI: 10.1002/ece3.1415 Madureira L., Santos J.L., Ferreira A., Guimarães H.
(2013). Feasibility study on the valuation of public goods and externalities in EU agriculture. JRC sci-entific and policy reports. Luxembourg: Publications Office of the European Union. Available at: https:// www.researchgate.net/profile/Livia_Madureira/pub- lication/322101239_Feasibility_Study_on_the_Valu-ation_of_Public_Goods_and_Externalities_in_EU_ Agriculture/links/5a4515ccaca272d2945d99c2/Feasi- bility-Study-on-the-Valuation-of-Public-Goods-and-Externalities-in-EU-Agriculture.pdf
Oppermann R., Beaufoy G., Jones G. (eds.) (2012). High nature value farming in Europe. Ubstadt-Weiher: verlag regionalkultur.
Paracchini M.L. (2007). Aree agricole ad alto valore natu-rale: iniziative europee. Atti del Convegno Aree agri-cole ad alto valore naturalistico: individuazione, con-servazione, valorizzazione. APAT Agenzia per la Pro-tezione dell’Ambiente e per i servizi tecnici. pp.13-16. Available at: www.isprambiente.gov.it/files/pubblica-zioni/manuali.../4392_manuale_62_2010.pdf
Paracchini M.L., Petersen J.E., Hoogeveen Y., Bamps C., Burfield I., van Swaay C. (2008). High nature value
farmland in Europe. An estimate of the distribution patterns on the basis of land cover and biodiver-sity data. JRC Scientific and Technical Reports EUR, 23480. DOI: 10.2788/8891
Petrontino A., Fucilli V. (2013). High Nature Value For-ests identification: A case study in Apulia region– Italy. Aestimum, (62): 67-88. DOI: 10.13128/Aesti-mum-13192
Pignatti G., De Natale F., Gasparini P., Mariano A., Triso-rio A. (2012). High nature value forest areas: A pro-posal for Italy based on national forest inventory data. Italian Journal of Forest and Mountain Environ-ments, 67(3): 281-288. Available at: http://ojs.aisf.it/ index.php/ifm/article/view/192
Pointereau P., Doxa A., Coulon F., Jiguet F., Parac-chini M.L. (2010). Analysis of spatial and tempo-ral variations of High Nature Value farmland and links with changes in bird populations: a study on France. JRC Scientific and Technical Reports, 79. Available at: https://www.researchgate.net/profile/ Philippe_Pointereau/publication/265582235_Analy-sis_of_spatial_and_temporal_variations_of_High_ Nature_Value_farmland_and_links_with_chang-es_in_bird_populations_a_study_on_France/ links/55ded43908aeaa26af0f3114/Analysis-of-spatial- and-temporal-variations-of-High-Nature-Value-farm- land-and-links-with-changes-in-bird-populations-a-study-on-France.pdf
Pointereau P., Paracchini M.L., Terres J.M., Jiguet F., Bas Y., Biala K. (2007). Identification of High Nature Value farmland in France through statistical infor-mation and farm practice surveys. JRC Scientific and Technical Reports. EUR, 22786. Available at: https://s3.amazonaws.com/academia.edu.docu-ments/46123024/JRC_HNV_France.pdf?AWSAcces sKeyId=AKIAIWOWYYGZ2Y53UL3A&Expires=1-552043151&Signature=tglhMfkMgHQiR1ZJTqj58igos cI%3D&response-content-disposition=inline%3B%20 filename%3DIdentification_of_High_Nature_Value_ farm.pdf
Regione Puglia (2014). Programma di Sviluppo Rurale 2014-2020 Puglia.
Regione Puglia (2015). Piano Paesaggistico Territori-ale RegionTerritori-ale. (delibera della Giunta RegionTerritori-ale n. 176/2015).
Sardaro R., Bozzo F., Petrontino A., Fucilli V. (2016). Community preferences in support of a conservation programme for olive landraces in the Mediterranean area. In VIII International Olive Symposium 1199: 183-188. DOI: 10.17660/ActaHortic.2018.1199.30 Stenzel S., Fassnacht F.E., Mack B., Schmidtlein S.
grass-land with remote sensing and minimal field data. Ecological Indicators, 74: 28-38. DOI: 10.1016/j. ecolind.2016.11.005
Steven M.D., Clark J.A. (eds.) (2013). Applications of remote sensing in agriculture. Elsevier. DOI: 10.20546/ijcmas.2019.801.238
Teillard F., Allaire G., Cahuzac E., Leger F., Maigne E., Tichit M. (2012). A novel method for mapping agricultural intensity reveals its spatial aggrega-tion: implications for conservation policies. Agricul-ture, ecosystems & environment, 149: 135-143. DOI: 10.1016/j.agee.2011.12.018
Temme A.J.A.M., Verburg P.H. (2011). Mapping and modelling of changes in agricultural intensity in Europe. Agriculture, Ecosystems & Environment, 140(1-2): 46-56. DOI: 10.1016/j.agee.2010.11.010 Trisorio A. Povellato A. Borlizzi A. (2010). High Nature
Value farming systems in Italy: a policy perspective. National Institute of Agricultural Economics (INEA), Rome, Italy. Available at: https://www.researchgate. net/profile/Andrea_Povellato/publication/266035393_ High_Nature_Value_Farming_Systems_in_Italy_a_ Policy_Perspective/links/542eac770cf27e39fa963751/ High-Nature-Value-Farming-Systems-in-Italy-a-Poli-cy-Perspective.pdf
Trisorio A., De Natale F., Pignatti G. (2012). Le aree agri-cole ad alto valore naturale in Italia: una stima a liv-ello regionale. Agriregionieuropa. Link not available Turner B.L., Doolittle W.E. (1978). The concept and
measure of agricultural intensity. The Professional Geographer, 30(3): 297-301. DOI: 10.1111/j.0033-0124.1978.00297.x
Vigani M., Dwyer J.C. (2019). Profitability and effi-ciency of high nature value marginal farming in England. Journal of Agricultural Economics. DOI: 10.1111/1477-9552.12351
Vuolo F., Żółtak M., Pipitone C., Zappa L., Wenng H., Immitzer M., Atzberger C. (2016). Data service plat-form for Sentinel-2 surface reflectance and value-added products: System use and examples. Remote Sensing, 8(11): 938. DOI: 10.3390/rs8110938