Non-invasive investigation of adipose tissue by
time domain diffuse optical spectroscopy
P
RANAVL
ANKA,
1,6A
GNESES
EGALA,
2,6A
NDREAF
ARINA,
1,3S
ANATHANAK
ONUGOLUV
ENKATAS
EKAR,
4E
NZON
ISOLI,
5A
LESSANDRAV
ALERIO,
2P
AOLAT
ARONI,
1,3R
INALDOC
UBEDDU,
1,3 ANDA
NTONIOP
IFFERI1,31Dipartimento di Fisica, Politecnico di Milano, Milano, Italy
2Department of Molecular and Translational Medicine, University of Brescia, Brescia, Italy 3Istituto di Fotonica e Nanotecnologie, Consiglio Nazionale delle Ricerche, Milano, Italy
4Biophotonics@Tyndall, IPIC, Tyndall National Institute, Lee Maltings, Dyke Parade, Cork, Ireland 5Department of Medical Biotechnology and Translational Medicine, University of Milan, Milano, Italy 6Co-first authors with equal contribution
Abstract: The human abdominal region is very heterogeneous and stratified with subcutaneous
adipose tissue (SAT) being one of the primary layers. Monitoring this tissue is crucial for diagnostic purposes and to estimate the effects of interventions like caloric restriction or bariatric surgery. However, the layered nature of the abdomen poses a major problem in monitoring the SAT in a non-invasive way by diffuse optics. In this work, we examine the possibility of using multi-distance broadband time domain diffuse optical spectroscopy to assess the human abdomen non-invasively. Broadband absorption and reduced scattering spectra from 600 to 1100 nm were acquired at 1, 2 and 3 cm source-detector distances on ten healthy adult male volunteers, and then analyzed using a homogeneous model as an initial step to understand the origin of the detected signal and how tissue should be modeled to derive quantitative information. The results exhibit a clear influence of the layered nature on the estimated optical properties. Clearly, the underlying muscle makes a relevant contribution in the spectra measured at the largest source-detector distance for thinner subjects related to blood and water absorption. More unexpectedly, also the thin superficial skin layer yields a direct contamination, leading to higher water content and steeper reduced scattering spectra at the shortest distance, as confirmed also by simulations. In conclusion, provided that data analysis properly accounts for the complex tissue structure, diffuse optics may offer great potential for the continuous non-invasive monitoring of abdominal fat.
© 2020 Optical Society of America under the terms of theOSA Open Access Publishing Agreement 1. Introduction
The dysfunction of adipose tissue (AT) in a variety of pathological processes represents a hot topic in a vast range of research fields. From a physiological point of view, fat mass (FM) and distribution mainly depend on age, gender, and ethnic differences. Total fat content, corresponding to the whole-body weight, declines after birth until young age, then gradually increases along adulthood. In particular, abdominal fat progressively increases with age, more in men and in post-menopausal women, often accompanied by chronic low-grade inflammatory processes. Fat accumulation can also occur without overt weight changes in the elderly, due to the concomitant reduction of lean mass [1].
From a pathological perspective, obesity – often simplistically defined as an excess of FM – is a complex chronic disease characterized by changes in total adipose amount, distribution and function, as well as by adipocyte death and low-grade chronic inflammation [2]. Adverse outcomes of obesity encompass impaired mitochondrial function and insulin resistance, with related disorders including type 2 diabetes mellitus, cardiovascular disease, high blood pressure,
#391028 https://doi.org/10.1364/BOE.391028
non-alcoholic fatty liver disease, and tumors [1,3]. The recent coining of obesity as “adiposity-based chronic disease” (ABCD) recognizes this complexity and the limits of body mass index (BMI, calculated as the weight in kilograms divided by the square of the height in meters) as the parameter to define obesity and its grading [4], especially in elderly people.
Aging and obesity share several features, including dysfunctional AT and altered relationships between FM and muscle mass (MM). Indeed, the basal metabolic rate slightly but progressively declines with age in parallel with the loss of MM, and this reduction is more consistent after the age of 50 years, contributing to the increased risk of weight gain [5]. On the other hand, central obesity plays a role in the so-called “inflammaging” and in the development of sarcopenia (i.e., a condition of decreased MM and function). Both obesity and aging increase subjects’ disability and risk of frailty, which are predictors of reduced health span and huge costs for the national health care systems.
During the last decades, increasing evidence defined AT as an organ, constituted by a variety of cells, highly vascularized and innervated, with clear anatomy, endocrine properties and a high degree of plasticity to both physiological and environmental cues [1,6,7]. Besides its primary roles in lipid storage and control of energy metabolism, AT plays relevant roles in whole-body homeostasis through hormones referred to as adipokines [7].
There are two morphologically and functionally distinct AT types: white adipose tissue (WAT) and brown adipose tissue (BAT) [8]. WAT accumulates fat during nutrient abundance and releases fatty acids during fasting. The principal depots of WAT are visceral AT (VAT), centrally located and enclosed by the peritoneum, the subcutaneous AT (SAT) located directly below the skin, and finally ectopic AT, which consists of depots in localities not directly associated with storage [1]. The largest adipose tissue depots are abdominal SAT and VAT that surrounds internal organs [9]. Notably, the cold exposure stimulates browning in SAT, with the appearance of thermogenic cells named beige adipocytes [6]. In humans, BAT depots are mainly distributed in the supraclavicular region and in other areas surrounding the aorta and its main branches [6]. The SAT compartment comprises more than 80% of the total body fat and consists of gluteal, femoral and abdominal AT. The abdominal AT is further subdivided into superficial SAT (sSAT) and deep-SAT (dSAT) adjacent to the peritoneum. When compared to sSAT, dSAT has higher expression of pro-inflammatory, lipogenic and lipolytic genes, and contains higher proportions of saturated fatty acids and an increased proportion of small adipocytes [3] highlighting the presence of a gradual decrease in adipocyte diameter moving from the skin to the abdomen. SAT adipocytes appear larger than perivisceral adipocytes [1].
Abdominal fat depots are characterized by rapid uptake and storage of energy from the diet and a high lipid turnover (i.e., lipolysis) [3]. AT expands by a combination of an increase in adipocyte size (hypertrophy) and number (hyperplasia) [10]. In obese subjects, the subcutaneous adipose tissue may fail to appropriately expand to store the energy surplus. This in turn may lead to ectopic fat deposition in other tissues such as skeletal muscle and liver and, consequently, to metabolic dysfunctions.
Together, these findings imply that stratification of obese subjects based on the metabolic and phenotypic profile (including tissue-specific profiling) may be necessary to identify individuals or subgroups at risk and to optimize disease prevention and treatment strategies. Thus, it is mandatory to provide a tool to better understand the role of adipose tissue function and other potential biological mechanisms in obesity-related complications [3].
Numerous techniques are available for body fat assessment, with a different validity in obesity and for specific populations. However, despite the importance of AT in disease, there are no widely-used methods for assessing AT physiology in humans [11], the strengths and limitations being due to the accuracy, costs, safety and portability of the device.
BMI is the most frequently used index in epidemiological studies, even if it does not show a strong correlation with body fat in obese individuals [1] and older subjects with decreased muscle
mass [3]. Further, BMI does not identify fat compartments. Diversely, waist circumference, hip circumference, waist-to-hip ratio, and waist-to-height ratio are indirect indexes for VAT or SAT valuation. Bioelectric impedance and dual-energy X-ray absorptiometry are widely used, indirect techniques that derive body fat percentage from specific equations and are not able to differentiate between SAT and VAT or identify ectopic fat in the liver, muscle, epicardial tissue and so forth. Computerized tomography and magnetic resonance imaging are the most accurate techniques available for the measurement of fat sub-compartments, however they are highly expensive, not portable and have huge limitations in clinical practice [1].
In addition to these methods, studies to validate ultrasound techniques in the estimate of SAT and VAT in the abdomen and for muscle thickness are ongoing. New devices with specific software are needed to increase accuracy and reduce operator variability in order to provide a method that is efficient in both clinical practice and epidemiological studies [1].
Thus, our long-term goal is to overcome the absence of a non-invasive, portable and cheap technique to investigate fat depots. Diagnostic techniques based on diffuse optics are potentially good candidates to meet that need, as they allow the development of relatively simple and inexpensive instruments, suitable for use both in a clinical environment and in the doctor’s office, and providing the non-invasive and objective assessment of tissue optical properties (absorption and reduced scattering). In turn, the knowledge of the optical properties at several wavelengths enables the estimate of diagnostically relevant tissue properties: tissue composition in terms of its major constituents (water, lipid, and collagen), physiological parameters (blood volume and oxygenation level), and microstructural information derived from scattering parameters.
Diffuse optical spectroscopic imaging, combining continuous wave (CW) broadband (650-1000 nm) acquisition with frequency domain (FD) measurements at 4 discrete wavelengths, was applied to estimate the optical and physiological properties of abdominal AT in 10 overweight or obese adults during three-months on calorie-restricted diet [11]. Changes were observed in scattering, possibly indicating reduction in adipose cell volume, as well as water and hemoglobin content, suggesting improved AT perfusion and oxygen extraction. The combined use of two approaches (CW and FD) allowed disentangling scattering from absorption. A simple homogeneous tissue model was applied, averaging over the whole tissue volume probed by the measurement.
Optical techniques have obtained interesting initial results suggesting their high potential for the non-invasive investigation of adipose tissue. For instance, initial attempts have demonstrated the usability of diffuse optical spectroscopy to discriminate white from brown fat on mice [12,13]. The increased activity of mitochondria in brown fat could provide a spectral absorption and scattering signature to track adipose tissue transformation. However, optical techniques will succeed in providing a valuable feed-back only if they can grant reliable and quantitative information. So far, diffuse optical data have been interpreted with the simplest and most commonly applied model, describing tissue as a homogeneous medium. Such a model proved effective in otherin vivo applications, even in case of heterogeneous tissues like breast [14]. However, the abdominal region is a highly stratified structure, which might prove more difficult to characterize with a simple model. Thus, we investigated the performance and limitations of using the homogeneous model to interpret diffuse optical spectroscopy (DOS) data and characterize abdominal adipose tissue.
In the following, we first describe the instrument exploited for time domain (TD) broadband DOS and provide information on the subjects enrolled in the study, on the measurement protocol and analysis methods. The next section describes the key results of the study both in terms of optical properties and concentrations of tissue constituents estimatedin vivo with the homogeneous model. This is followed by a discussion of the results, with some help from Monte Carlo based simulations to virtually replicate the study in a much more controlled situation and investigate the possible limitation of the model. The last section deals with the conclusions of the study and some future directions.
2. Material and methods
2.1. Instrumentation
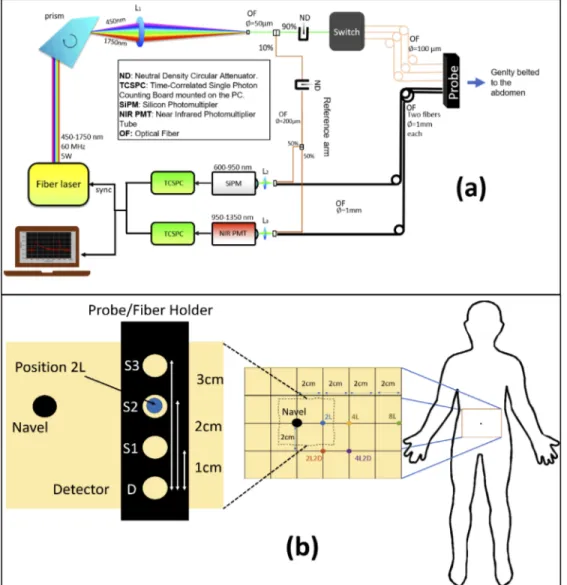
An upgraded version of an existing broadband time-resolved instrument specifically designed for clinical measurements was used for this study [15]. A schematic of the setup is shown in Fig.1(a). A broadband (450-1750 nm) pulsed supercontinuum fiber laser (Fianium WhiteLase SC360, NKT Photonics, Denmark) with repetition rate of 60 MHz and pulse width of a few tens of picoseconds, was chosen as the illumination source. A Pellin Broca prism was used to spatially disperse the white light pulses and a rotation of this prism allowed for wavelength selection. The spectrally selected light, with an average power of 0.5 to 5 mW, was then focused into a 50-µm core fiber. Due to prism dispersion, the bandwidth at the selected wavelength varied between 3 and 10 nm over the wavelength range of 600–1100 nm. A motorized, circularly variable, neutral-density filter (NDC-50C-2, Thorlabs, Germany) was placed in front of this fiber to adjust the power. A 1 × 4 fiber optic switch (Leoni, Germany) was employed to create 3 separate source points to facilitate multi-distance measurements. Light diffusely reflected by the sample, in this case a specific location on the subject’s abdomen, was then collected by a detector fiber bundle made of two 1-mm diameter step-index fibers bundled together on the sample side and coupled to two different detectors, to provide high responsivity over the entire wavelength range of interest: 1) A silicon photomultiplier SiPM (S10362-11-050C, Hamamatsu, Japan) with home-made front-end electronics [16], and 2) an InGaAs photomultiplier (H10330A-45, Hamamatsu, Japan). The signal from the detectors was processed by two time-correlated single photon counting (TCSPC) boards (SPC-130, Becker & Hickl, Germany) to produce the temporal point spread functions (TPSFs). A reference arm coupled the source light at the selected wavelength directly to the detectors shifted in time not to interfere with the sample response. This allowed for a continuous monitoring of the instrument response and for compensating any temporal distortions or thermal drifts affecting the signal.
The system has been extensively characterized following internationally agreed protocols [17,18] and proved to be reliable and accurate in its standard operating conditions [15]. Also, it was employed for various clinical studies [19–22]. The entire system operation and acquisition at multiple source detector separation was completely automated using proprietary software. 2.2. Data analysis
A numerical method based on Monte Carlo (MC) simulations was employed to retrieve the absorption (µa) and reduced scattering (µ0s) coefficients at a given wavelength [23]. First, a library of temporal point spread functions (TPSFs) for time resolved reflectance with different possible scattering coefficients and null absorption were generated using a CUDA (Compute Unified Device Architecture) accelerated MC code [24]. A linear interpolation between the generated data was performed to account for arbitrary reduced scattering coefficient values. To account for the absorption, these TPSFs were then multiplied by the Lambert–Beer exponential term exp(-µavt) – whereµais the absorption coefficient, t is the photon time-of-flight and v is the speed of light in the medium. A Levenberg–Marquardt optimization procedure was performed between the experimental data and this simulated curve after convolution with the instrument response function (IRF) to determine the optical properties satisfying the best-fit conditions. The fitting range for the experimental data was chosen to be all the datapoints having counts greater than 80% of the peak value on the rising edge of the curve and greater than 1% on the trailing edge. Based on previous studies [25], this range offers a good balance between stability and accuracy of the fit. Also, it is the standard range selected in the validation of the instrument on reference solid phantoms [15] and adopted in several time-resolved reflectance studies. If we had chosen a multi-layered model, a wider range could have been taken, but since we want to test the behavior of a straightforward homogeneous approach, the commonly used range was preferred.
Fig. 1. (a) Schematic of the broadband time resolved diffuse optical spectrometer used for
this in-vivo study and (b) a representative figure of the different measurement locations, relative to the navel, considered for the study (Section2.4). The inset image shows the positioning of the probe/fiber holder at a given measurement position (in this case 2L).
Absorption and reduced scattering spectra were then obtained by plotting the optical properties against their corresponding wavelength. The time required to retrieve the optical properties at a single wavelength was under 1 s.
2.3. Second level fit
The absorption and reduced scattering spectra obtained from the fitting procedure described above could be exploited to evaluate key information regarding the tissue, such as tissue composition, blood parameters and information on the size and density of the scattering centers in the tissue. A linear combination of the extinction coefficient spectra of different chromophores and tissue constituents of the tissue, such as, oxy (HbO2) and deoxy (Hb) hemoglobin, water, lipid and
collagen were fit to the absorption coefficient spectra, according to: µa(λ) = Õ
iciεi(λ) (1)
where, εi(λ) is the specific absorption of the ith constituent at wavelength λ. The ciretrieved from this equation represents the concentration of theith constituent. The key absorbers mentioned above have been studied thoroughly and their specific absorption has been reported in literature [26–28]. The concentration of the two blood parameters obtained this way were then used to calculate the total blood contenttHb = Hb + HbO2and the oxygen saturationStO2= HbO2/ tHb. Similarly, under the assumption that all the scattering events are caused by homogeneous spheres, an empirical model derived from Mie theory relates the wavelength dependence of the reduced scattering coefficient spectra to the size and the density of the scattering centers in the tissue [29]:
µ0
s(λ) = A(λ/λo)−b (2)
where λois a reference wavelength (600 nm in this case) andA and b are the scatter amplitude and the scatter power which correlate to the density and size of the scattering centers, respectively. These are effective parameters which can be useful to grade the tissue microstructure.
While this is the conventional procedure for secondary fitting to retrieve the constituent concentrations, a robust and more accurate procedure for time-resolved data has been developed by D’Andrea et al. [30], which evaluates the constituent concentrations and structural parameters directly from the raw experimental data (TPSFs) with a global fitting procedure that operates on data at all wavelengths simultaneously. The constituent concentrations and structural information presented in this work (see Table2) were obtained by applying this method to our data. 2.4. Subjects and measurement protocol
Ten adult male volunteers were recruited among the staff and students of Politecnico di Milano (Milan, Italy) and informed on the main study objective, the protocol of TD-DOS measurements and the safety of the instrument. A signature of informed consent was obtained. Data on general information like age, height and weight were collected. Waist circumference was taken by the operator at the mid-point between iliac crest and the last rib, along the axillary middle line. A commercially available potable ultrasound machine (Model E2exp, SonoScape, China) was used to estimate the thickness of the skin and SAT layers. Table1summarizes the general
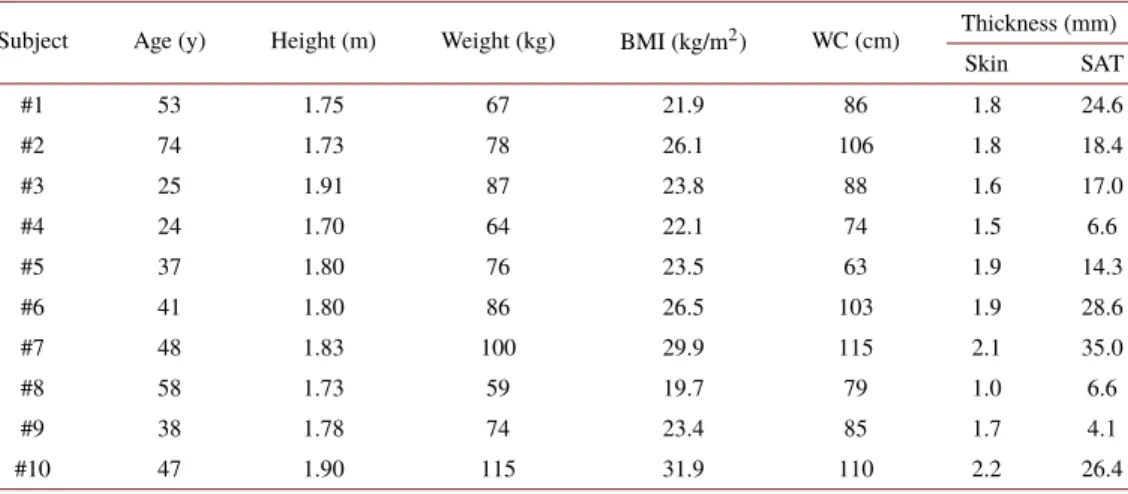
Table 1. Demographics of the subjects involved in the study.a
Subject Age (y) Height (m) Weight (kg) BMI (kg/m2) WC (cm) Thickness (mm) Skin SAT #1 53 1.75 67 21.9 86 1.8 24.6 #2 74 1.73 78 26.1 106 1.8 18.4 #3 25 1.91 87 23.8 88 1.6 17.0 #4 24 1.70 64 22.1 74 1.5 6.6 #5 37 1.80 76 23.5 63 1.9 14.3 #6 41 1.80 86 26.5 103 1.9 28.6 #7 48 1.83 100 29.9 115 2.1 35.0 #8 58 1.73 59 19.7 79 1.0 6.6 #9 38 1.78 74 23.4 85 1.7 4.1 #10 47 1.90 115 31.9 110 2.2 26.4
aBMI= Body Mass Index | WC = Waist Circumference | Thickness = Thickness of the two layers measured by ultrasound
anthropometric data for the ten subjects involved in the study. Approval was obtained from the Ethical Committee of Politecnico di Milano prior to thein vivo measurements.
Measurements were performed on the abdomen with the subject lying in supine position. The wavelength range of choice was 600-1100 nm with a step size of 10 nm, at the three inter fiber distances of 1, 2 and 3 cm. Five positions were tested: 2 cm left to the navel (2L); 4 cm left to navel (4L); 2 cm left and 2 cm below the navel (2L2D, D stands for down); 4 cm left and 2 cm down to the navel (4L2D); 8 cm left to the navel (8L). All distances were taken with reference to source 2 with the probe positioned in a direction perpendicular to the waistline with the detector Table 2. Tissue composition, blood oxygenation, and scatter parameters for all the subjects at the
three source detector separations for location at 4 cm to the left of the navel.a Subject # ρ cm Hb µM HbO2 µM THb µM StO2% Lipid mg/cm3 mg/cmwater3 collagenmg/cm3 cmbkg−1 A cm−1 b 1 1 0.83 10.83 11.66 93 955 216 90 0.001 14.5 1.26 2 0.20 15.89 16.09 99 969 185 88 0.020 18.7 0.38 3 0.13 14.40 14.53 99 884 141 75 0.019 13.7 0.44 2 1 2.86 5.29 8.15 65 664 221 0 0.010 12.0 1.21 2 0.09 18.60 18.68 100 1164 154 54 0.020 15.5 0.03 3 0.07 16.14 16.21 100 1188 43 71 0.015 12.3 0.52 3 1 2.89 4.90 7.79 63 605 197 0 0.010 13.6 1.08 2 0.00 17.08 17.08 100 930 136 22 0.021 14.9 0.00 3 0.23 15.56 15.79 99 977 85 30 0.015 12.2 0.43 4 1 0.33 33.30 33.64 99 994 281 140 0.036 22.2 1.56 2 0.08 42.52 42.61 100 483 535 143 0.073 23.2 0.00 3 0.05 50.25 50.30 100 1247 291 205 0.084 18.9 0.24 5 1 2.84 5.52 8.36 66 690 236 0 0.010 15.0 0.83 2 0.05 19.25 19.30 100 994 108 33 0.024 17.3 0.00 3 0.01 18.11 18.12 100 1046 57 43 0.019 13.1 0.29 6 1 2.90 4.72 7.63 62 574 185 0 0.010 12.4 1.42 2 0.33 12.21 12.54 97 950 132 35 0.018 16.0 0.29 3 2.66 6.62 9.28 71 720 286 0 0.011 11.8 0.67 7 1 2.90 4.69 7.59 62 568 182 0 0.010 10.3 1.41 2 0.07 9.96 10.03 99 1171 116 86 0.006 16.7 0.70 3 0.15 7.89 8.03 98 1085 106 77 0.003 12.9 0.74 8 1 2.02 32.19 34.21 94 811 10 56 0.031 15.7 1.07 2 0.01 43.62 43.63 100 824 368 141 0.075 25.7 0.15 3 0.74 40.71 41.46 98 899 202 133 0.060 15.6 0.18 9 1 0.27 15.89 16.16 98 1028 145 132 0.002 18.0 1.48 2 0.12 25.95 26.07 100 888 312 131 0.062 26.7 0.43 3 0.00 30.24 30.25 100 997 203 143 0.049 16.0 0.36 10 1 2.90 4.76 7.66 62 583 186 0 0.010 18.6 1.37 2 0.03 10.81 10.84 100 984 101 57 0.015 19.3 0.33 3 0.02 8.51 8.53 100 985 75 59 0.008 13.7 0.51
aTHb= total hemoglobin content | StO
2= oxygen saturation | bkg = wavelength independent value added as a fitting
parameter to account for possible tissue absorbers not included in the fitting procedures and for limitations of the theoretical model.
downwards [refer Fig.1(b)]. The total measurement time required to acquire the spectra at the three inter fiber distances at one location was 5 minutes.
2.5. Data for simulations
To help the interpretation of thein vivo measurements, simulations were performed assuming a simple three-layered model of the abdomen with the three layers being i) skin ii) SAT and iii) underlying muscle. While the thickness of each of these layers was varied as described in Section
3.3the base optical properties and constituent concentrations of the individual layers were fixed to values obtained from literature. The average refractive index for the three layers was assumed to be constant over the wavelength range of interest and chosen to be 1.38 for skin [31], 1.44 for the SAT and 1.37 for muscle [32]. Regarding the optical properties spectra, the values for the skin or dermal layer were obtained from literature [33] while those for the muscle were estimated assuming the constituent concentrations to be 14.5 g/dL of blood [34], 5% lipids, 80% water and 15% collagen [35]. Finally, SAT was assumed to comprise 95% of lipids and 5% water with
negligible concentration of blood.
3. Results and discussion
3.1. Absorption and reduced scattering spectra
As a first overview on the overall spectral variability, Fig.2shows the absorption (left) and reduced scattering (right) spectra of all the subjects at interfiber distance ρ= 2 cm in the same location (4 cm left of the navel). Clearly, there is a wide variability, both in spectral features and in absolute values, mostly related to the heterogeneity of the abdomen and differences among subjects, as discussed in the following. Concerning the absorption spectrum, the key features are the absorption tail of hemoglobin – mainlyHb – in the region below 700 nm, the peak ofHb overlapped to a small water shoulder around 760 nm, the clear peak of lipid at 930 nm with a second minor one around 1020 nm, and the water contribution around 980 nm.
HbO2is definitely present, but less evident since its decreasing tail in the red is overcome by
Hb, and the broad maximum around 900 nm is overlapped to the other sharper spectra. Upon
decreasing the thickness of the upper layer (skin+ SAT), the overall absorption increases with the marked contribution of water and blood as a clear sign that the muscle tissue is reached by the measurement.
Fig. 2. Absorption and reduced scattering spectra measured on the abdominal region of the
10 subjects enrolled in this study. The measurements were performed at a source detector separation ρ= 2 cm at a location 4 cm to the left of the navel.
For what concerns the reduced scattering spectrum, there are no distinct spectral features, as expected from the simple power-law dependence ofµ0son wavelength for biological tissues in
this spectral range [29]. Still, there is a large intersubject variability both in amplitude and in slope of the scattering spectrum.
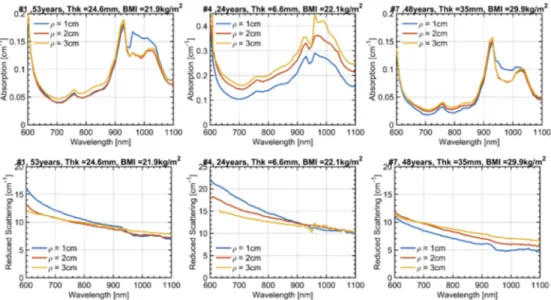
To gain more insight into the effects of the heterogeneous adipose structure on the absorption and scattering spectra, we present in Fig.3the absorption (top) and reduced scattering (bottom) spectra for the 3 interfiber distances again at 4 cm left of the navel. For the sake of simplicity, only 3 most representative subjects are shown, while data on all 10 subjects are reported in the supplementary figures. For the absorption, basically two main effects are observed. The first, most obvious one, is the progressive increase inµa upon increasing ρ, (except for the region around 980 nm, where water contribution is dominant, as discussed below). This effect is evident in Subject #4 (center) with possibly some minor hints also in the other two cases. It can be ascribed to the increased relevance of the muscle layer (with higher blood content) upon increasing ρ, and therefore to the larger probing depth.
Fig. 3. Absorption and reduced scattering spectra at the 3 interfiber distances ρ= 1, 2 and
3 cm. Results are presented for 3 subjects with further information about the subject in the title of each subplot (Age, Thk= Thickness of the SAT layer, and BMI). The measurement was taken 4 cm to the left of the navel.
What is more unexpected is the mild increase in µa around the water peak (980 nm) for the shortest ρ= 1 cm, as observed in Subject #1 (left) and #7 (right). Since a shorter ρ is more sensitive to shallower structures, the leading hypothesis attributes such an increase to the contribution of the skin that is more hydrated (70%) [36] as compared to the underlying adipose tissue. Still, the relatively small thickness of this layer (refer Table1) calls for some caution in a straightforward attribution. In-fact, very thin superficial layers are not expected to affect much the temporal shape of the diffuse photon distribution, and consequently of the estimatedµa. A deeper discussion of this interpretation is presented in Section3.3with the aid of simulations.
The reduced scattering spectra display a clear increase of slope upon reducing ρ, for all subjects, also for the middle one where the SAT thickness is small. Again, an increased weight of the superficial layer (dermis) can be speculated due to the expected steepest scattering spectrum caused by collagen fibrils. In particular, a bi-component scattering spectrum is observed for Subject #1 (left) and #7 (right) for ρ= 1 cm, with a steepest slope in the red (<700 nm). This observation is consistent with the small dimension of collagen fibrils, which are expected to cause a behavior close to Rayleigh scattering [37]
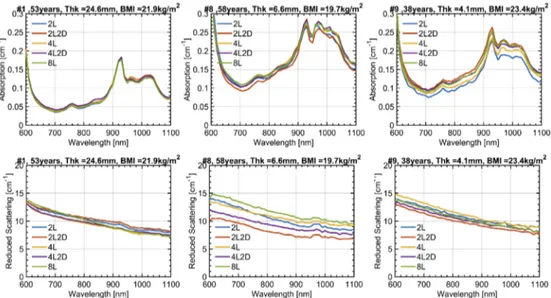
The variations in absorption (top) and reduced scattering (bottom) spectra for different locations on the abdomen are shown in Fig.4for 3 subjects, representative of the whole study, while all data are reported in the supplementary figures. In general, all key spectral features are preserved for different locations on the same subject. Yet, some intra-subject variability is observed, which is more marked in the case of thinner adipose layer. In detail, the coefficient of variation
CV = (stdev/mean) is 5.2%, 4.0%, 11.0% for µaat 800 nm (left to right) and 3.9%, 14.1%, 5.4% forµ0s. Considering the whole set of subjects, the median / maxCV is 8.6% / 18.0% for µaand 6.6% / 18.1% forµ0s.
Fig. 4. Absorption and reduced scattering spectra at 5 different locations in the abdominal
region. The legend identifies the measurement position with reference to the navel. For example: (4L2D – corresponds to a point 4 cm to the left and 2 cm below the navel). Results are presented for 3 subjects with further information (Age, Thk= Thickness of the SAT layer and BMI) about the subject in the title of each subplot. For all the measurements ρ= 2 cm.
3.2. Tissue composition
The absorption and reduced scattering spectra were further analyzed to retrieve the concentration of key absorbers (Hb, HbO2, lipid, water, collagen) as well as the scattering amplitude and power (A, b). Results for all subjects and all ρ distances for the location 4 cm on the left of the navel are reported in Table2. It is important to remind that the optical properties were derived using a purely homogeneous tissue model. Due to the heterogeneous nature of the abdomen, these numbers are meant as averages over different volumes depending on the source-detector distance. Further, spectral distortion is expected due to different spatial sensitivity maps for different wavelengths. Therefore, these values must be taken with caution, not considering them as absolute reliable estimates, but rather as indications of qualitative trends observed in the spectra.
The key observations made in the analysis of the spectra for different ρ are confirmed. In subjects where the SAT thickness is < 7 mm (#4, #8, #9) the total Hb content is high and increases for increasing ρ, as a clear indication that the muscle tissue is probed (tHb > 30 µM for ρ = 3 cm). This is an expected effect and of course must be carefully considered when studying the adipose tissue to avoid contamination from the underlying muscle. For the very same subjects, also the collagen content is higher on average. Again, this could be attributed to the contribution
of muscle, since collagen is the major structural protein in skeletal muscle [38]. Concurrently, we observe an increased bkg value, which is possibly ascribed to a missed collagen contribution (very flat and subtle spectral features) or to the inadequacy of the homogeneous model under such strong heterogeneous conditions.
The more unexpected contamination from the thin superficial skin layer seems to be confirmed by the tabulated values, since in subjects with the greatest thickness (> 10 mm, that is all cases except the three subjects mentioned above) an increase in water content is observed for the shortest ρ, with the only exception of Subject #6 at ρ= 30 mm). For the previous 3 subjects, the muscle contamination is possibly dominant and overwhelms the water increase at a shorter ρ.
The comments on the scattering spectra are confirmed by the corresponding values (A, b) reported in Table2. In fact, ρ= 1 cm always shows the highest value for b, supporting again the contamination of the skin. Indeed,b > 1 is an indication of steep scattering spectrum arising from small scattering centers as for collagen fibrils [37], whereas adipose tissue with large adipocytes (where a lipid droplet can represent up to 90% of the cell volume) exhibits a flatter (b < 1) spectrum.
In general, tissue oxygenation (StO2) is unrealistically high because of a possible underestima-tion ofHb, which is actually often close to zero. This behavior might be due to the line shape alterations of the absorption spectrum arising from spectral differences in the sampled volume or by inadequacy of the homogeneous model to deal with the clear heterogeneous structure. 3.3. Monte Carlo simulations
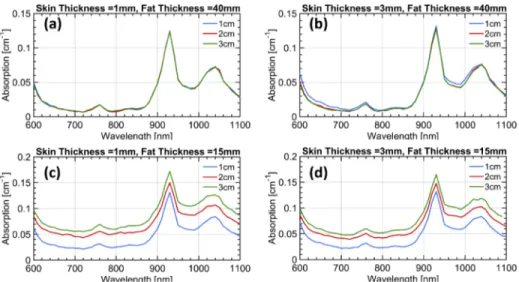
The key trends observed in thein vivo measurements are I) increase in blood-related absorption for the largest ρ when the SAT is thin (< 7 mm); II) increase in water content for short ρ; III) increase in scattering slope for short ρ. The first effect is consistent with the probing of muscle tissue, while the other two with a contribution from the skin. Since this latter statement is less obvious, we ran a set of MC simulations on possible scenarios in order to corroborate our hypothesis. We tried to match as much as possible the measurement conditions (e.g., convolution with the IRF, number of counts, geometry) and analysis (homogeneous model, fitting range) so to closely replicate the experiment. As for the tissue structure (layers) and optical properties, we inferred values from the literature or from realistic assumptions, as described in Section2.6and displayed in Fig.5. Four possible scenarios are considered, spanning all combinations of thin (15 mm) and thick (40 mm) SAT layer with thin (1 mm) and thick (3 mm) skin.
Fig. 5. Absorption (left) and reduced scattering (right) spectra of the three primary layers
of the abdominal tissue (namely skin, SAT and underlying muscle) used in the simulation studies.
The resulting fitted absorption and reduced scattering spectra are displayed in Fig.6and Fig.7, respectively. The increase in absorption due to the underlying muscle for a thin fat layer (trend I) is confirmed [Fig.6(c) and Fig.6(d)]. The water contribution from the skin arising at ρ= 1 cm (trend II) is consistent with a skin thickness of 3 mm [Fig.6(b)] and is possibly masked for the same skin thickness when the muscle is visible [Fig.6(d)], similarly to what observedin vivo.
Finally, the increase in scattering slope for ρ= 1 cm (trend III) possibly due to skin collagen is definitely observed for any skin thicknesses when the fat layer is thick enough to isolate from the muscle. Instead, contamination from the muscle is masking this effect for thin fat layers.
Fig. 6. Absorption spectra at the three inter-fiber distances retrieved from the simulations
for the four different combinations of layer thicknesses. The assumed thickness of the first two layers in each case is mentioned in the title of the corresponding subplot. The third layer was assumed to be infinitely thick in all cases.
Fig. 7. Reduced scattering spectra at the three inter-fiber distances retrieved from the
simulations for the four different combinations of layer thicknesses. The assumed thickness of the first two layers in each case is mentioned in the title of the corresponding subplot. The third layer was assumed to be infinitely thick in all cases.
Overall, the simulations confirm the proposed hypothesis that the superficial skin yields a tangible effect in thein vivo measurements at least for a thickness of 3 mm or greater. Surely, these simulations are derived using simplified assumptions on the geometry and using literature data for the estimate of layered absorption. Still they provide an indication of plausibility of our
interpretation. Indeed, thein vivo effects both on the water increase and on the scattering slope seem to be stronger than what predicted based on literature information. This may suggest either that the skin thickness is larger than 3 mm or that the skin scattering is higher than the values depicted in Fig.5.
Incidentally, while these findings make data interpretation more complex, they also indicate that time domain diffuse optical spectroscopy is sensitive enough to skin properties and could be studied more specifically for the non-invasivein vivo sensing of skin properties, such as hydration or collagen content.
4. Conclusions
In conclusion, we have investigated the optical spectroscopy of the abdomen on 10 subjects
in vivo using time domain broadband diffuse optics at 3 source-detector distances (ρ). A
wide inter-subject variability was observed, related to the specific subject’s constitution. Upon changing ρ, three effects were observed, that is: i) the increase in the overall tissue absorption at the largest ρ= 3 cm, when the superficial adipose tissue thickness is < 8 mm; ii) the increase in water absorption for the shortest ρ= 1 cm); and iii) the increase in the scattering slope again for the shortest ρ. All these findings are consistent with a 3-layer model of the abdomen comprising the skin, the adipose tissue, and the underlining muscle. A proper optical investigation of the adipose tissue should cope with this multilayer structure in order to properly disentangle true fat properties from contamination from the skin or the underlying muscle.
The present study was performed using a simple homogeneous model and sets the ground for a more advanced analysis including multi-layered geometries. Still, the retrieval of 3 layer properties with proper accuracy is not straightforward due to the risk of overfitting the data resulting in unreliable results. Therefore, we are currently validating spectral multi-layered approaches for a second-level analysis of the experimental dataset. The spectrally constrained method employed here [30] will be used in conjunction with these multi-layered analysis models to recover the constituent concentrations of the individual layers. Also, the validity of the simple Diffusion Approximation to describe the first thin layer is definitely questionable, and we are considering higher order (e.g. P3) models [39,40].
In the era of personalized and precision medicine, increasing our knowledge on adipose tissue might enable us to overcome the limitations of the traditional anthropometric indices of obesity and sarcopenia. The availability of a non-invasive technique to monitor adipose tissue status in response of nutrition, lifestyle habits or medical treatment is fascinating for the possibilities of providing feedback and non-invasive insight. Diffuse optics is a potentially powerful option, also in view of the wealth of information it can provide – related to both tissue composition and microstructure. Yet, preliminary understanding of the origin of optical measurements is a pre-requisite for proposing diffuse optics in clinical studies. The present work sets a first observational ground on fat spectroscopy clearly identifying the next step to provide accurate and quantitative optical characterization of adipose tissues.
Funding
Fondazione Cariplo (PROJECT MAYBE grant 2016-1006); BITMAP project under H2020 Marie Skłodowska-Curie Actions (675332).
Disclosures
The authors declare that there are no conflicts of interest related to this article.
References
1. G. E. Walker, P. Marzullo, R. Ricotti, G. Bona, and F. Prodam, “The pathophysiology of abdominal adipose tissue depots in health and disease,”Horm. Mol. Biol. Clin. Invest.19(1), 57–74 (2014).
2. W. Trim, J. E. Turner, and D. Thompson, “Parallels in immunometabolic adipose tissue dysfunction with aging and obesity,”Front. Immunol.9(169), 169 (2018).
3. G. H. Goossens, “The metabolic phenotype in obesity: fat mass, body fat distribution, and adipose tissue function,” Obes. Facts10(3), 207–215 (2017).
4. G. Frühbeck, L. Busetto, D. Dicker, V. Yumuk, G. H. Goossens, J. Hebebrand, J. G. C. Halford, N. J. Farpour-Lambert, E. E. Blaak, E. Woodward, and H. Toplak, “The ABCD of obesity: An EASO position statement on a diagnostic term with clinical and scientific implications,”Obes. Facts12(2), 131–136 (2019).
5. A. Buch, E. Carmeli, L. K. Boker, Y. Marcus, G. Shefer, O. Kis, Y. Berner, and N. Stern, “Muscle function and fat content in relation to sarcopenia, obesity and frailty of old age — An overview,”Exp. Gerontol.76, 25–32 (2016). 6. S. Cinti, “Adipose Organ Development and Remodeling,” inComprehensive Physiology(John Wiley & Sons, Inc.,
2011), 8, pp. 1357–1431.
7. K. Sun, C. M. Kusminski, and P. E. Scherer, “Adipose tissue remodeling and obesity,”J. Clin. Invest.121(6), 2094–2101 (2011).
8. Geneviève Marcelin, Ana Letícia, M. Silveira, Laís Bhering Martins, Adaliene V. M. Ferreira, and Karine Clément, “Deciphering the cellular interplays underlying obesity induced adipose tissue fibrosis,”J. Clin. Invest.129(10), 4032(2019).
9. R. R. Driskell, C. A. B. Jahoda, C.-M. Chuong, F. M. Watt, and V. Horsley, “Defining dermal adipose tissue,”Exp. Dermatol.23(9), 629–631 (2014).
10. M. Longo, F. Zatterale, J. Naderi, L. Parrillo, P. Formisano, G. A. Raciti, F. Beguinot, and C. Miele, “Adipose tissue dysfunction as determinant of obesity-associated metabolic complications,”Int. J. Mol. Sci.20(9), 2358 (2019). 11. G. Ganesan, R. V. Warren, A. Leproux, M. Compton, K. Cutler, S. Wittkopp, G. Tran, T. O’Sullivan, S. Malik, P. R.
Galassetti, and B. J. Tromberg, “Diffuse optical spectroscopic imaging of subcutaneous adipose tissue metabolic changes during weight loss,”Int. J. Obes.40(8), 1292–1300 (2016).
12. U. S. Dinish, C. L. Wong, S. Sriram, W. K. Ong, G. Balasundaram, S. Sugii, and M. Olivo, “Diffuse optical spectroscopy and imaging to detect and quantify adipose tissue browning,”Sci. Rep.7(1), 41357 (2017). 13. K. Dev, U. S. Dinish, S. Chakraborty, R. Bi, S. Andersson-Engels, S. Sugii, and M. Olivo, “Quantitative in
vivo detection of adipose tissue browning using diffuse reflectance spectroscopy in near-infrared II window,”J. Biophotonics11(12), e201800135 (2018).
14. D. Grosenick, H. Rinneberg, R. Cubeddu, and P. Taroni, “Review of optical breast imaging and spectroscopy,”J. Biomed. Opt.21(9), 091311 (2016).
15. S. Konugolu Venkata Sekar, A. Dalla Mora, I. Bargigia, E. Martinenghi, C. Lindner, P. Farzam, M. Pagliazzi, T. Durduran, P. Taroni, A. Pifferi, and A. Farina, “Broadband (600-1350 nm) time-resolved diffuse optical spectrometer for clinical use,”IEEE J. Sel. Top. Quantum Electron.22(3), 406–414 (2016).
16. A. D. Mora, D. Contini, S. Arridge, F. Martelli, A. Tosi, G. Boso, A. Farina, T. Durduran, E. Martinenghi, A. Torricelli, and A. Pifferi, “Towards next-generation time-domain diffuse optics for extreme depth penetration and sensitivity,”Biomed. Opt. Express6(5), 1749 (2015).
17. A. Pifferi, A. Torricelli, A. Bassi, P. Taroni, R. Cubeddu, H. Wabnitz, D. Grosenick, M. Möller, R. Macdonald, J. Swartling, T. Svensson, S. Andersson-Engels, R. L. P. van Veen, H. J. C. M. Sterenborg, J.-M. Tualle, H. L. Nghiem, S. Avrillier, M. Whelan, and H. Stamm, “Performance assessment of photon migration instruments: the MEDPHOT protocol,”Appl. Opt.44(11), 2104 (2005).
18. H. Wabnitz, D. R. Taubert, M. Mazurenka, O. Steinkellner, A. Jelzow, R. Macdonald, D. Milej, P. Sawosz, M. Kacprzak, A. Liebert, R. Cooper, J. Hebden, A. Pifferi, A. Farina, I. Bargigia, D. Contini, M. Caffini, L. Zucchelli, L. Spinelli, R. Cubeddu, and A. Torricelli, “Performance assessment of time-domain optical brain imagers, part 1: basic instrumental performance protocol,”J. Biomed. Opt.19(8), 086010 (2014).
19. S. Konugolu Venkata Sekar, M. Pagliazzi, E. Negredo, F. Martelli, A. Farina, A. Dalla Mora, C. Lindner, P. Farzam, N. Pérez-Álvarez, J. Puig, P. Taroni, A. Pifferi, and T. Durduran, “In Vivo, non-invasive characterization of human bone by hybrid broadband (600-1200 nm) diffuse optical and correlation spectroscopies,”PLoS One11(12), e0168426–16 (2016).
20. A. Farina, C. Linder, P. Farzaml, M. Pagliazzi, M. Squarcia, I. Halperin, S. Konugolu Venkata Sekar, A. Dalla Mora, P. Taroni, M. Mora, F. Hanzu, H. Dehghani, T. Durduran, and A. Pifferi, “Thyroid tissue constituents characterization and application to in vivo studies by broadband (600-1200 nm) diffuse optical spectroscopy,” inClinical and
Preclinical Optical Diagnostics, J. Q. Brown and T. G. van Leeuwen, eds. (SPIE, 2017), 10411, p. 85.
21. S. Konugolu, C. Guadagno, L. Spinelli, P. Lanka, P. Taroni, R. Cubeddu, E. Nisoli, A. Pifferi, and A. Farina, “In vivo depth heterogeneity of the abdomen assessed by broadband time-domain diffuse optical spectroscopy,” inDiffuse
Optical Spectroscopy and Imaging VI, H. Dehghani and H. Wabnitz, eds. (SPIE, 2017), 10412, p. 39.
22. S. Konugolu Venkata Sekar, A. Farina, E. Martinenghi, A. Dalla Mora, P. Taroni, A. Pifferi, E. Negredo, J. Puig, R. Escrig, Q. Rosales, C. Lindner, M. Pagliazzi, and T. Durduran, “Time-resolved diffused optical characterization of key tissue constituents of human bony prominence locations,”Proc. SPIE9538, 95380X (2015).
23. A. Pifferi, P. Taroni, G. Valentini, and S. Andersson-Engels, “Real-time method for fitting time-resolved reflectance and transmittance measurements with a Monte Carlo model,”Appl. Opt.37(13), 2774 (1998).
24. E. Alerstam, T. Svensson, and S. Andersson-Engels, “Parallel computing with graphics processing units for high-speed Monte Carlo simulation of photon migration,”J. Biomed. Opt.13(6), 060504 (2008).
25. R. Cubeddu, A. Pifferi, P. Taroni, A. Torricelli, and G. Valentini, “Experimental test of theoretical models for time-resolved reflectance,”Med. Phys.23(9), 1625–1633 (1996).
26. P. Taroni, A. Bassi, D. Comelli, A. Farina, R. Cubeddu, and A. Pifferi, “Diffuse optical spectroscopy of breast tissue extended to 1100 nm,”J. Biomed. Opt.14(5), 054030 (2009).
27. S. K. V. Sekar, I. Bargigia, A. D. Mora, P. Taroni, A. Ruggeri, A. Tosi, A. Pifferi, and A. Farina, “Diffuse optical characterization of collagen absorption from 500 to 1700nm,”J. Biomed. Opt.22(1), 015006 (2017).
28. Scott Prahl, “Assorted Spectra,”https://omlc.org/spectra/index.html.
29. J. R. Mourant, T. Fuselier, J. Boyer, T. M. Johnson, and I. J. Bigio, “Predictions and measurements of scattering and absorption over broad wavelength ranges in tissue phantoms,”Appl. Opt.36(4), 949 (1997).
30. C. D’Andrea, L. Spinelli, A. Bassi, A. Giusto, D. Contini, J. Swartling, A. Torricelli, and R. Cubeddu, “Time-resolved spectrally constrained method for the quantification of chromophore concentrations and scattering parameters in diffusing media,”Opt. Express14(5), 1888–1898 (2006).
31. H. Ding, J. Q. Lu, W. A. Wooden, P. J. Kragel, and X. H. Hu, “Refractive indices of human skin tissues at eight wavelengths and estimated dispersion relations between 300 and 1600 nm,”Phys. Med. Biol.51(6), 1479–1489 (2006).
32. A. N. Bashkatov, E. A. Genina, V. I. Kochubey, and V. V. Tuchin, “Optical properties of human skin, subcutaneous and mucous tissues in the wavelength range from 400 to 2000nm,”J. Phys. D: Appl. Phys.38(15), 2543–2555 (2005). 33. C. R. Simpson, M. Kohl, M. Essenpreis, and M. Cope, “Near-infrared optical properties of ex vivo human skin and subcutaneous tissues measured using the Monte Carlo inversion technique,”Phys. Med. Biol.43(9), 2465–2478 (1998).
34. M. Cesari, B. W. J. H. Penninx, F. Lauretani, C. R. Russo, C. Carter, S. Bandinelli, H. Atkinson, G. Onder, M. Pahor, and L. Ferrucci, “Hemoglobin levels and skeletal muscle: results from the InCHIANTI study,”J. Gerontol., Ser. A 59(3), M249–M254 (2004).
35. S. B. Heymsfield, V. Stevens, R. Noel, C. McManus, J. Smith, and D. Nixon, “Biochemical composition of muscle in normal and semistarved human subjects: Relevance to anthropometric measurements,”Am. J. Clin. Nutr.36(1), 131–142 (1982).
36. M. Guzmán-Alonso and T. M. Cortazár, “Water content at different skin depths and the influence of moisturizing formulations,” Househ. Pers. Care Today 11, 35–40 (2016).
37. S. A. P. Steven and L. Jacques, “Mie scattering from collagen fibers,” https://omlc.org/classroom/ece532/class3/mie_collagen.html.
38. E. Dransfield, “Intramuscular composition and texture of beef muscles,”J. Sci. Food Agric.28(9), 833–842 (1977). 39. S. Geiger, D. Reitzle, A. Liemert, and A. Kienle, “Determination of the optical properties of three-layered turbid
media in the time domain using the P 3 approximation,”OSA Continuum2(6), 1889 (2019).
40. A. Liemert, D. Reitzle, and A. Kienle, “Analytical solutions of the radiative transport equation for turbid and fluorescent layered media,”Sci. Rep.7(1), 3819 (2017).