Seismic performance of masonry walls
retrofitted with steel reinforced grout
Stefano De Santis1,a,*, Paolo Casadei2,b, Gerardo De Canio3,c,Gianmarco de Felice1,d, Marialaura Malena1,e, Marialuisa Mongelli3,f, Ivan Roselli2,g
1 Roma Tre University, Department of Engineering. Via Vito Volterra 62, 00146 Rome, Italy. 2 Kerakoll S.p.A. Headquarter. Via dell'Artigianato 9, 41049 Sassuolo (MO), Italy.
3 ENEA, Casaccia Research Centre, UTT MAT-QUAL. Via Anguillarese 301, 00123 Rome, Italy.
a [email protected], b [email protected], c [email protected], d [email protected], e [email protected],
f [email protected], g [email protected].
* Corresponding author. T: +39 06 5733 6387. F: +39 06 5733 3441.
ABSTRACT
Innovative solutions for the seismic protection of existing masonry structures are proposed and investigated through shake table tests on a natural scale wall assemblage. After a former test series carried out without reinforcement, the specimen has been retrofitted using Steel Reinforced Grout (SRG). The strengthening system comprises connectors and horizontal strips of ultra-high strength steel cords externally bonded to the masonry with hydraulic lime mortar, within the thickness of a plaster layer. Natural accelerograms have been applied with increasing intensity up to failure. Test results provide a deep understanding of the effectiveness of SRG for improving the out-of-plane seismic capacity of masonry walls, in comparison with traditional reinforcements with steel tie-bars. The structural implications of the proposed solution in terms of dynamic properties and damage development under earthquake loads are also discussed.
KEYWORDS
Masonry, Seismic performance, Steel Reinforced Grout (SRG), Out-of-plane behaviour, Strengthening, Shake table.
1. INTRODUCTION
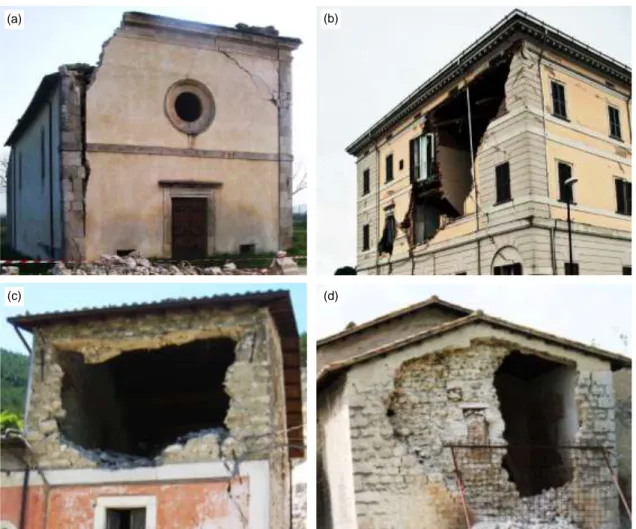
Past earthquakes have shown that the out-of-plane capacity of front walls is one of the crucial issues in the vulnerability of masonry structures, especially in historical centres [1]. Given the discontinuous nature of masonry, the external walls tend to separate from the internal structures, such as transverse walls and floors, and, depending on constrain conditions, presence of openings [2], and section morphology [3], either fail by overturning (Figure 1(a)), suffer severe damage due to poor bending strength (Figure 1(b)), or disgregate. Examples have been observed during recent earthquakes on masonry buildings [4], aggregates [5], and churches [6,7]. Therefore, improved retrofitting solutions are needed that combine structural effectiveness, economic and environmental sustainability, and possibility of being integrated with maintenance works. Traditional steel tie bars, which have been being installed since centuries, proved to effectively avoid the out-of-plane overturning [8]. However, the localized constrain provided by the end-plates cannot always prevent
the failure by out-of-plane bending, especially for slender masonry walls (Figure 1(c)). Reinforced concrete bond beams have been used in the last decades to provide a box-type behaviour and a higher bending capacity to the walls, but in some cases the resulting stiffness discontinuity and the lack of proper connection have even caused the collapse of the masonry below the concrete beam (Figure 1(d)).
Aiming at overcoming these drawbacks, innovative solutions with externally bonded composites have been developed in the last two decades which offer significant strength improvement with minimum thickness, nor variation of original structural geometry, with no mass increase and limited stiffness modification. Beside well-established Fibre Reinforced Polymers (FRPs) (see, amongst others: [9,10]), a new generation of composite materials are currently under development, which comprise inorganic matrices in place of epoxy resins, thus ensuring better vapour permeability and material compatibility, cheaper and faster installation on uneven surfaces, and higher fire resistance than polymeric resins. For these reasons, mortar-based systems provide remarkable advantages for applications to masonry structural members [11] and appear particularly suitable for the retrofitting of historic buildings, which requires the fulfilment of specific preservation criteria [12]. Nevertheless, the continuous development, production and commercialization of new strengthening systems are not always associated with adequate experimental investigations, such that their actual effectiveness is often affected by non-negligible uncertainties. Lately, scientific technical committees (such as RILEM TC 250-CSM Composites for Sustainable Strengthening of Masonry) and standardization commissions at national and European levels have been activated to develop recommendations on testing methods and qualification [13], design criteria and installation requirements, while the first guidelines have just been issued in the US [14]. So far, increasing research efforts have been mainly devoted to the mechanical characterization of mortar-based reinforcements in terms of tensile behaviour [15] and substrate-to-composite bond performance [16,17]. Some experimental investigations have been carried out on medium scale specimens [18,19], whilst no large-scale dynamic tests have been performed to date. The investigation of the actual response of strengthened structures to earthquake motion, the need of improving the connections between façade and lateral walls [20], as well as between floors and walls [21], the size of the reinforcement necessary to provide a significant increase of the seismic capacity, and the importance of proper installation procedures still remain open issues, with important implications on current design practice and maintenance activities.
This paper presents a shake table study carried out on a full-scale U-shaped masonry specimen (façade and two transverse walls), retrofitted with innovative mortar-based composites, consisting of high strength textiles made out of steel cords, applied with hydraulic lime mortar. With respect to glass, basalt, and carbon textiles, the steel cords provide a better interlocking with the mortar, thus preventing the possible failure by sliding of the textile within the matrix [17]. The system is generally named as Steel Reinforced Grout (SRG), and despite some field applications already exist [12,22], a deeper knowledge still needs to be gained on its actual effectiveness, before it can be extensively and confidently used for safeguarding existing masonry structures (especially when part of cultural heritage) against earthquakes.
A former test series had been carried out on the specimen without reinforcement [23] and after the installation of steel tie-bars. Then, the specimen has been repaired and reinforced with SRG, and tested within a further shake table session. The seismic inputs were scaled natural accelerograms, based on recordings of some of the recent strong earthquakes. In order to examine the effectiveness of the proposed strengthening solution, the seismic response after retrofitting is compared to the behaviour exhibited previously in terms of seismic capacity, damage development and dynamic properties.
(a) (b)
(d) (c)
Figure 1. Damage due to out-of-plane seismic loads on masonry buildings: (a) detachment of the façade and (b) collapse by bending in unreinforced masonry walls, (c) failure by bending in the presence of steel tie-bars and (d) reinforced
concrete curbs. Photographs (a), (c), (d) are taken after 06/04/2009 L’Aquila, Italy, earthquake. Photograph (b) is
taken after 20/05/2012 Emilia, Italy, earthquake.
2. DESCRIPTION OF THE SPECIMEN AND SEISMIC RETROFITTING 2.1. Initial specimen and preceding tests
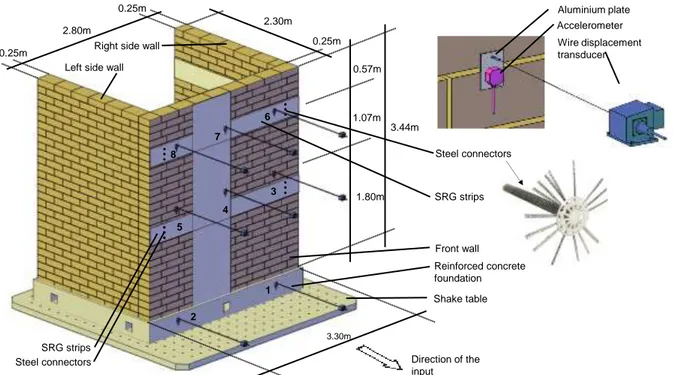
The specimen was a full-scale U-shaped masonry wall, consisting in a façade and two transverse walls (Figure 2). The façade was 3.30m long, 3.44m high and 0.25m thick; the transverse walls had the same thickness and height of the façade and were 2.30m long. The wall was made up of 250mm×370mm×110mm tuff units and hydraulic lime mortar. The tuff had the following mean properties: 12.1kN/m3 unit weight, 5.9N/mm2 compressive strength and 1575N/mm2 Young’s modulus. The mortar had a mean compressive strength of 4.1N/mm2, a Young’s modulus of 2030N/mm2 and a tensile strength (from three point bending tests) of 0.8N/mm2. The wall was built on a reinforced concrete foundation having a 0.35m×0.35m cross section, and the first layer of masonry was partially laid in it. Historic masonry buildings may suffer from a poor connection between façade and transverse walls, due to the weak mechanical properties and the deterioration of the materials (mortar and units), to the morphology of the walls (small stones, large mortar joints, irregular arrangement), to damage development and, finally, to the juxtaposition of walls built at different times. In order to simulate such weak connection between façade and transverse walls, which is one of the main causes of the seismic vulnerability of historic masonry buildings, the specimen was realized without block interlocking; the walls were simply built next to each other and a mortar joint was laid between them at the corners. On the contrary, a certain connection would cause diagonal cracks propagating from the base hinge in the side walls, some portions of which would thus rotate with the front wall. The weight of these portions would have a stabilizing
effect with respect to out-of-plane rotations. Furthermore, the activation of an overturning mechanism would require friction to be overcome along bed joints. Similarly, the connection between walls and floors or roof structures may prevent the nearly-rigid out-of-plane overturning of the façade and lead to the activation of other collapse mechanisms (e.g., failure by either vertical or horizontal bending). In these cases, the out-of-plane capacity of the façade would be higher than that of completely separated walls and the strength increase provided by the reinforcements (e.g., steel tie-rods or SRG connectors) would be lower.
The specimen was initially subjected to a shake table test series without reinforcement [23], which caused the detachment of the façade from the transverse walls and its out-of-plane overturning. A steel retaining structure was used to prevent the collapse of the front wall and allow its vertical position to be restored after overturning, such that additional tests were carried out with the façade completely separated from the side walls and behaving as a nearly rigid body under rocking motion. Then, in order to investigate the effectiveness of traditional retrofitting devices, two 20mm steel smooth bars, threaded at the ends, were installed through 32mm holes at a distance of 0.85m from the top of the wall and 0.30m from the corner. The height of the rods (about 75% of the whole height of the façade) maximized the stabilizing effect preventing, at the same time, failure by vertical bending. Their diameter was large enough to exclude the possibility of tensile failure. In front, two 600mm long UPN100 steel bars, placed at 45°, were used as end-plates to anchor the rods to the façade (Figure 3(c)). Behind, the bars were fixed to a horizontal 100mm×100mm timber beam, which, in its turn, contrasted to the back side of the lateral walls. Nuts at both edges of each bar were tightened to close the vertical cracks at the corners and prevent slackening during test execution.
A further test series was carried out on the specimen retrofitted with steel tie-bars, which impeded the collapse of the façade. The resulting damage pattern comprised two vertical cracks, one per side, dividing the façade from the transverse walls (Figure 3(a)), and a horizontal crack at the fourth mortar bed joint (at about 0.44m from above the foundation, and all along specimen width), which had previously constituted the overturning hinge of the unreinforced wall (Figure 3(b)). The specimen reinforced with the tie-bars also showed the development of a vertical crack in the middle section of the façade, induced by the out-of-plane bending and by the impacts occurring at the corners during motion. In addition, some diagonal cracks formed at the top and mid-height of the front wall, probably related to the punching effect of the end-plates (Figure 3(c)).
3.30m 2.80m 0.25m 0.25m 0.25m 2.30m 3.44m 0.57m 1.07m 1.80m 1 2 5 4 3 8 7 6 Front wall Aluminium plate Accelerometer Wire displacement transducer Reinforced concrete foundation Shake table Left side wall
Direction of the input SRG strips Steel connectors SRG strips Steel connectors
Right side wall
(a) (b) (c)
Figure 3. Damage pattern induced by the shale table test series prior the installation of SRG reinforcement [23]: (a) vertical crack at the corner separating the façade from the side walls, (b) vertical crack in the middle of the front wall,
and (c) diagonal cracks in the vicinity of the steel end-plates. 2.2. Strengthening system
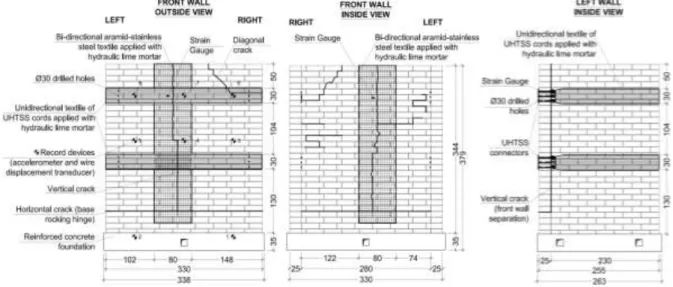
The strengthening system (Figure 4) was designed assuming a Peak Ground Acceleration (PGA) of 1.5g, and comprised:
12 steel connectors retaining the out-of-plane overturning of the façade (playing the same role of tie-bars); the connectors crossed the front wall and were anchored to the internal surface of the side walls by adhesion. In the design, the wall has been considered as a rigid block overturning around a base hinge, and the top connectors have been checked against tensile rupture by imposing rotation equilibrium. Four horizontal SRG strips were applied to the side walls (two on each side wall, one at the height of 1.30m and one at 2.64m from the foundation), to transfer the load from the connectors to the masonry. These horizontal strips have been checked against end bond failure, which means that the maximum load transferable by each 300mm wide strip needed to be higher than the maximum load expected on three connectors. Moreover, the bonded length was much longer than the effective anchorage one (estimated to be in the 200-250mm range in the present case).
Two horizontal SRG strips applied to the front wall at the same height of the previous ones, to transfer the retaining effect of the connectors to the façade, as done by the steel end-plates of the tie-bars. These strips were installed to provide both an increase of the bending resistance of the wall and a more distributed retaining effect than the end-plates. In the design, the wall was considered as a simply supported beam made up of reinforced masonry and subjected to a uniformly distributed load. The steel cords were checked towards tensile failure, while the reinforcement systems was checked towards intermediate debonding failure, by comparing the relative shear stress at the substrate-to-reinforcement interface with the maximum attainable stress, the latter being simply assumed to be 1.5 times higher than the corresponding value at end bond failure.
Given the pre-existing damage described in the previous paragraph, two nets of bi-directional slate-stainless steel textile were also applied to both the external and the internal surfaces of the façade to restore the continuity and provide additional tensile/bending strength. The reinforcement intervention was designed drawing on the Italian Guidelines on FRP [24]. However, due to the lower strength of mortar than epoxy resin, debonding may occur also on the substrate-to-reinforcement interface (weak adhesion), on the matrix-to-textile interface (poor bond/interlocking),
or by textile slippage (poor adhesion on short anchorage lengths [17]). Consequently, additional checks towards failure within the reinforcement thickness were performed according the US Guidelines on Fibre Reinforced Cementitious Matrix (FRCM) systems [14].
Clearly, in this specific case, the specimen could have been strengthened by continuous strips of SRG, applied horizontally to the external surface of the front wall, flexed at the corners, and then bonded to the outer side of the lateral walls. By doing so, the connectors would have been eliminated, thus excluding the possibility of failure by tensile rupture or pull-off, and the load transfer from the reinforcement to the masonry, which mainly relies on the SRG-to-substrate shear bond strength, would have been facilitated by the friction at the corners. Nevertheless, this strengthening configuration would be feasible in the field only for small one-room buildings or aisleless churches. Differently, a larger building is generally constituted by a long façade and several transverse walls. In this case, the connection between the façade and each transverse wall needs to be improved to provide an effective strengthening towards out-of-plane loads. For this reason, steel tie-bars are traditionally installed next to each transverse wall to effectively retain the façade, to which the rods are anchored by means of end-plates. At the other side, the rods are anchored to other walls in the same way. In the strengthening solution with SRG proposed in this work, the connection between the façade and the side walls is entrusted to the connectors made of UHTSS cords, which are anchored to the front wall through the SRG strips and to the side walls by adhesion. By doing so, no anchoring to other walls parallel to the façade is needed.
Figure 4. Strengthening design. 2.3. Strengthening materials
Two reinforcement textiles were used in the retrofitting work, whose mechanical properties were derived through direct tensile tests [15]:
a unidirectional mesh of Ultra High Tensile Strength Steel (UHTSS) cords (Figure 5(a)), having 0.538mm2 net cross section area, and made up of five wires, three of which are
rectilinear and the other two are twisted around them with short lay length, to enhance the interlocking with the mortar matrix. Cords are galvanized (coated with zinc) to ensure protection against rusting, and are installed on a supporting glass mesh with 6.35mm spacing (4 cords/inch), to obtain a textile with 0.084mm design thickness and 670g/m2 mass density (Figure 5(b)). The steel textile has 3208N/mm2 tensile strength (corresponding to 269kN/m strength per unit width), 183.9kN/mm2 Young’s modulus, and 2.24% strain at rupture. The steel textile is produced and stored in 300mm wide strips and, thanks to its high tensile strength and cord-to-mortar interlocking, is particularly suitable for localized strengthening applications that are expected to undergo high stresses.
a balanced bi-directional fabric made up of slate yarns and stainless steel wires (Figure 5(c)), 10mm×10mm spaced, having 312g/m2 mass density, 0.053mm design thickness,
1151N/mm2 tensile strength (corresponding to 62.1kN/m strength per unit width), 275.1kN/mm2 Young’s modulus, and 1.61% strain at rupture. This fabric can well be used for diffused applications to damaged wall surfaces, because it is bi-directional (thus contributing to the strength increase in the two orthogonal directions) and is produced and stored in wider strips (800mm).
A natural hydraulic lime mortar was used to bond the reinforcement textiles to the masonry. It comprises natural kaolin, bauxite and hydraulic lime binders, with a grain size range of 0-1.4mm, 20.6N/mm2 compressive strength (from compression tests on cubic specimens), 11400N/mm2 Young’s modulus (from tests on cylinders), and 5.4N/mm2 tensile strength (from three point
bending tests). The composite strengthening system was tested under tension, revealing a mean tensile strength of 3254N/mm2 and a tensile modulus of elasticity (after cracking) of 183kN/mm2 [15]. Finally, single lap shear bond tests revealed a mean bond strength (per unit width) on tuff substrate of 53kN/m [25]. All the materials were provided by Kerakoll S.p.A.; the steel textile is distributed under the commercial name GeoSteel G600, the slate-stainless steel mesh is still under development and is not on the market yet, and, finally, the product name of the mortar is GeoCalce Fino. 1 2 3 4 5 cm 1 2 3 4 5 0 0 1 2 3 4 5 cm 1 2 3 4 5 0 0 (b) (c) (a)
Figure 5. Reinforcement textiles applied for the seismic retrofitting: (a) galvanized ultra-high tensile strength steel (UHTSS) cord detail and (b) unidirectional textile, (c) slate-stainless steel bi-directional mesh.
2.4. Installation works
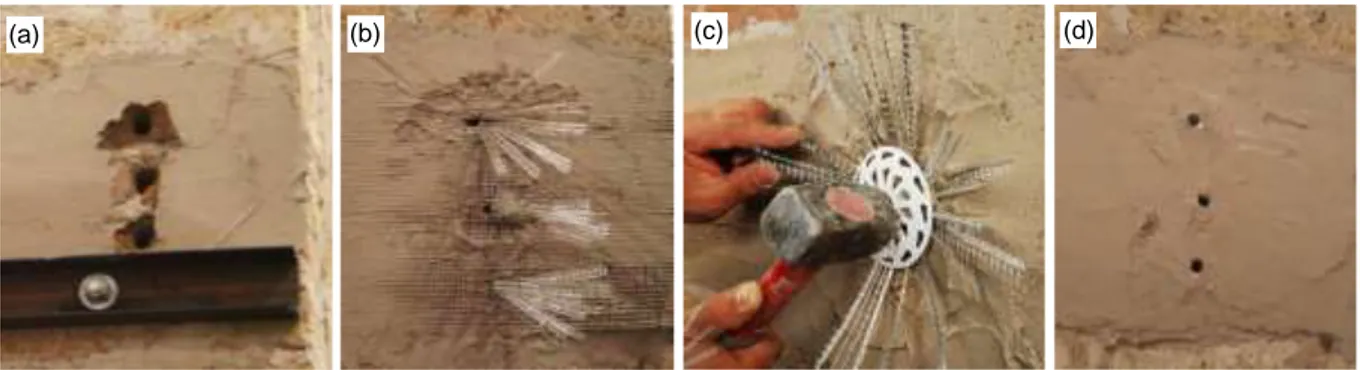
The installation required two working days of two specialised workmen. First, the old mortar in existing cracks was removed and cracks were injected with a natural hydraulic lime (NHL) based fluid grout to restore the continuity of the masonry and prevent impacts during motion. In order to consolidate the tuff substrate and remove dust, an aqueous solution of potassium silicate was applied prior to the laying of the first mortar layer (Figure 6(a)). Then, the slate-stainless steel nets and the SRG strips were installed on the façade to provide tensile strength across the cracks and contribute to the bending strength of the diffusely damaged wall. Two 300mm wide strips of UHTSS cord textile were applied to the internal surfaces all along each transverse wall at the same height of the external SRG bands. While the first mortar layer was still fresh, the textiles were installed and pressed into the fresh mortar, which protruded through all the perforations between cords (Figure 6(b)). The second layer of mortar was then applied (Figure 6(c)). The overall thickness of the reinforcement was 7-8mm. In the vicinity of the façade, each strip was split into three portions in order to obtain the connectors, which were passed through 30mm holes drilled in the front wall (Figure 7(a)). Consequently, each of the 12 connectors was made out of a 100mm wide band of steel textile. On the outer side, the connectors were unfold for a length of 100mm, out of the SRG horizontal band (Figure 7(b)), and fixed by means of resin wedges (Figure 7(c)), while the mortar was still fresh. Finally, the holes were injected with a NHL based fluid grout (Figure 7(d)). The externally bonded reinforcement was kept wet for the first 24 hours after installation. Subsequently, the specimen was stored in laboratory conditions (15-20°C and 50-60% R.H.) for about 40 days before testing.
(a) (b) (c)
Figure 6. Installation of SRG reinforcement: (a) laying of the first layer of hydraulic lime mortar on the consolidated substrate, (b) application of the steel textile, and (c) laying of the covering mortar layer.
(a) (b) (c) (d)
Figure 7. Installation of the steel connectors on the façade: (a) drilled holes through the wall and the horizontal SRG strip, (b) unfolding of the connectors, (c) installation of the wedges, and (d) mortar finishing prior to injecting.
3. TEST SETUP
3.1. Instrumentation for data recording
The instrumentation installed on the specimen is shown in Figures 2 and 4. One piezoelectric accelerometer and one wire linear potentiometer were installed by means of steel pivots drilled into the masonry at six measurement points on the front wall (three at the height of 1.80m and three at 2.87m), while two additional measurement points were placed on the foundation. Accelerometers had ±10g range, <2% accuracy and 0.01g resolution. Displacement transducers had 635mm range, 0.2% accuracy and 1m resolution, and were anchored to a steel frame placed outside the reaction mass area of the shake table, in order to prevent measurements from being affected by floor vibrations. The strains in the reinforcements were recorded through four resistive strain gauges (10mm length, <0.05% accuracy and 1 resolution), glued directly on the textiles and embedded into the mortar matrix, to prevent the measurements from being influenced by mortar cracking [17]. A small resin plate was realized to glue the device to the steel cords, in order to ensure proper adhesion and, consequently, a suitable accuracy in the measurement.
Test data were acquired at 100Hz sampling frequency by means of a National Instruments NI PCI 6281 Multifunction Data Acquisition (DAQ) system, provided with three NI SCXI 1520 Universal Strain-Gauge Input Module units, with eight Channels each; the acquisition software was developed in LabView environment. To process acceleration recordings, a third-order baseline correction and a fourth-order Butterworth band-pass filter in the 0.35-25Hz range were used; moreover a third-order band-stop filter at 2.1Hz was necessary to remove errors related to sampling and background noise introduced by the shake table system. Filtering parameters were chosen after comparison between the displacement time histories obtained by double integration of accelerations against those measured by the displacement transducers.
A high-resolution 3D motion capture system was also installed, which makes use of near infrared cameras to record the displacement of retro-reflecting markers glued on the specimen. Such system allowed the measurement of the relative displacement between the two sides of the vertical cracks
at the corners and the in-plane deformation of the side walls, which were not monitored by conventional accelerometers and displacement transducers [26,27].
3.2. Shake table and input signals
Tests were carried out at ENEA Casaccia Research Centre, in Rome, Italy, equipped with a 4m×4m shake table, which is able to apply displacement and acceleration time histories within a frequency range of 0-50Hz, with a maximum acceleration of ±3g (for a 10t mass specimen with centre of gravity at 1m of height), a maximum velocity of ±500mm/s, and a maximum displacement of ±125mm. The table is controlled by four horizontal and four vertical actuators and has six degrees of freedom. To anchor the specimen, doubled UPN100 steel beams were placed across the foundation and were connected to the shake table by means of 20mm threated steel rods. Six steel heels, four at the base of the façade and one at the base of each transverse wall, provided further horizontal restraint against sliding (see [23,26] for details).
The seismic inputs were based on six natural recordings selected amongst some of the most severe Italian earthquakes of the last 50 years, and related to normal faulting events. Three signals were recorded during the 1980 Irpinia earthquake, one during the 1997 Umbria-Marche earthquake, one during the 2009 L’Aquila earthquake, and one during the 2012 Emilia earthquake. The main properties of the input signals are collected in Table I, which lists the date, the moment magnitude (MW), the ground type according to Eurocode 8 classification [28], the distance of the record station
from the epicentre (D), the record name, the Peak Ground Acceleration (PGA), Peak Ground Velocity (PGV), and Peak Ground Displacement (PGD), the Velocity Spectrum Intensity (VSI), and the average spectral acceleration (Sa). VSI and Sa were evaluated between 8Hz and 16Hz,
which were the frequencies of the fundamental modes in the two orthogonal directions, resulting from a preliminary monitoring under random (white noise) low-intensity base excitation, as it will be described in the following paragraphs. The chronological order of the input signals was established on the base of both the VSI and the Sa. Signals were applied in direction normal to the
front wall (tests were unidirectional), following the sequence provided in Table I. In each round, input signals were scaled with scaling factor (SF) increasing from 0.1 to 2.5 (details on the test sequence are provided in the Appendix). Furthermore, tests under 0.05g PGA white noise have been carried out after each input sequence with the same SF, to derive additional information on the dynamic properties of the specimen. The pseudo-acceleration response spectra of input accelerograms are represented in Figure 8, together with those of the accelerations recorded on the foundation. The shapes and the peaks of input and recorder spectra showed a very good agreement, especially in the short period range (below 1s), in which most of the frequency content of the record is concentrated. The spectra of the registered signals, however, were lower than those of the input ones for BagnirWE, Figure 8(c) and SturWE, Figure 8(d) in the long-period range (T>1s), This mismatch may be related to the lower precision of the accelerometers below 1Hz and to the fact that they were placed on the foundation and not directly on the shake table, such that some filtering effect may have occurred.
In addition, the control system of the shake table, as well known, is not able to compensate with optimized quality in the whole frequency range, so that a certain level of inaccuracy at frequencies lower than 1Hz was accepted. Control performance is generally expected to decrease with the increase of the mass of the specimen, of the height and the eccentricity of its centre of mass, and its deformability, as well as with the presence of moving masses (e.g., the rocking
wall). Therefore, the mismatch between recorded and input spectra is expected to grow during a test session with the reduction of the stiffness of the specimen, the latter, in its turn, being progressively reduced due to damage development. In the present case, however, such mismatch was independent from the Scale Factor, since damage remained very limited up to the last test (as it will be shown afterwards).Table I. Accelerograms selected to perform
shake table tests.
Data collected from Italian ISIDe database of INGV (National Institute of Geophysics and Volcanology).
# Earthquake Date MW Station Ground
type D Record PGA PGV PGD VSI (8-16Hz) Sa (8-16Hz) [km] [g] [mm/s] [mm] [mm] [g]
1 Irpinia 23/11/1980 6.9 Calitri B 20.5 CalitWE 0.181 281 90 0.246 0.209
2 Irpinia 23/11/1980 6.9 Bagnoli Irpino A 8.0 BagnirWEa 0.167 374 135 0.397 0.350
3 Emilia 20/05/2012 5.9 Mirandola C 13.4 MrnWE 0.261 298 90 0.519 0.456
4 Irpinia 23/11/1980 6.9 Sturno B 6.7 SturWE 0.313 705 309 0.597 0.526
5 Aquila 06/04/2009 6.3 Aquila-V.Aterno B 5.1 AQGNS 0.451 372 39 0.877 0.756
6 Umbria-Marche 26/09/1997 6.1 Nocera Umbra B 4.7 R1168EW 0.438 288 42 1.170 0.905
MW: Moment magnitude; D: distance of the record station from the epicentre; PGA: Peak Ground Acceleration; PGV: Peak Ground Velocity; PGD: Peak Ground Displacement; VSI: Velocity Spectrum Intensity; Sa: average spectral acceleration.
a Polarity has been inverted
0 1 2 3 4 0 0.2 0.4 0.6 0.8 1 BagnirWE, PGA=0.167g T [s] S a [g] 0 1 2 3 4 0 0.2 0.4 0.6 0.8 1 CalitWE, PGA=0.181g T [s] S a [g] 0 1 2 3 4 0 0.2 0.4 0.6 0.8 1 BagnirWE, PGA=0.167g T [s] S a [g] 0 1 2 3 4 0 0.4 0.8 1.2 1.6 MirandolaWE, PGA=0.261g T [s] S a [g] 0 1 2 3 4 0 0.4 0.8 1.2 1.6 SturWE, PGA=0.313g T [s] S a [g] 0 1 2 3 4 0 0.4 0.8 1.2 1.6 2 AQGNS, PGA=0.451g T [s] S a [g] 0 1 2 3 4 0 0.4 0.8 1.2 1.6 2 R1168WE, PGA=0.438g T [s] S a [g] Input (PGA=0.167g) Measured (PGA=0.164g) BagnirWE Input (PGA=0.261g) Measured (PGA=0.285g) MrnWE Input (PGA=0.451g) Measured (PGA=0.527g) AQGNS Input (PGA=0.438g) Measured (PGA=0.543g) R1168WE Input (PGA=0.313g) Measured (PGA=0.429g) SturWE Input (PGA=0.181g) Measured (PGA=0.167g) CalitWE 0 0 0
Figure 8. Response spectra of the signals imposed to the shake table and of the accelerations measured by accelerometer #1 on the reinforced concrete foundation of the specimen (tests with SF=1).
4. TEST RESULTS AND COMPARISONS
4.1. Seismic response and capacity of the specimen retrofitted with SRG 4.1.1. Damage development
As a whole, 57 shake table tests were carried out on the specimen retrofitted with SRG, as reported in Table A in the Appendix, collecting the main parameters of the seismic input at the base of the specimen (provided by accelerometer #1 on the foundation), and of the response (recorded by the devices installed on the façade). The damage development for increasing base motion intensity was surveyed and the data from accelerometers, displacement transducers and strain gauges were analysed to provide and insight on the seismic response of the wall. No cracks were visible to the naked eye, nor revealed by instruments, for the former 26 tests. The first noticeable damage was a narrow crack in the vertical joint between the façade and the left wall, detected after MrnWE record with SF=1.0 in Time History (TH) #27. Then, during the SF=2.0 series, a vertical crack developed at the right corner joint, as also revealed by the increase of the maximum stress recorded on the connectors, reaching 212N/mm2 (see row #53 in the column of 3 of Table A). However, damage
remained limited until test #56, despite base motion up to PGA=1.49g and PGV=637mm/s were applied. Such a high intensity of the seismic input proves the full effectiveness of the proposed reinforcement system.
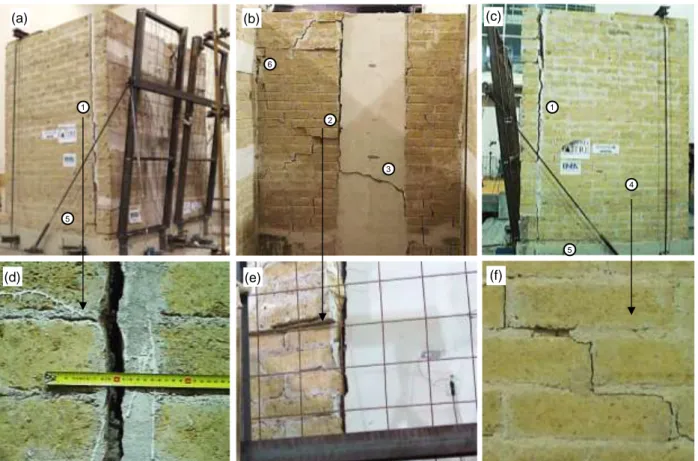
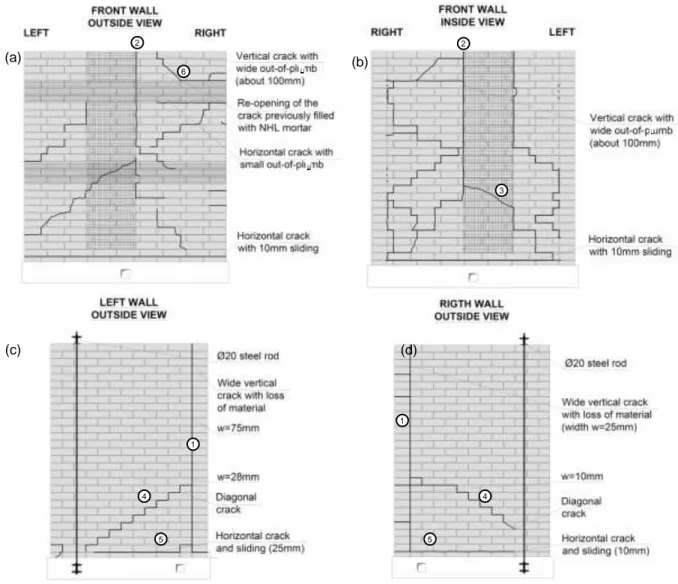
The last test (TH 57) was carried out under Nocera-Umbra record amplified by a factor of 2.5, and the acceleration recorded on the foundation had 1.51g PGA and 584mm/s PGV. After this test, the specimen was considered failed due to the severity of damage (shown in Figures 9 and 10). Though the masonry of the façade was completely separated from the transverse walls (tag 1 in Figures 9(a), 9(c), 10(c) and 10(d)), and the vertical crack displayed a residual width of about 20mm (Figure 9(d)), the steel connectors did not fail nor were pulled out from the front wall, and the horizontal reinforcements on the side walls did not detach, so no out-of-plane overturning occurred. The maximum stress on the connectors recorded during the test was 344N/mm2 (Table A), which is well below the tensile strength (3208N/mm2) of the steel textile. Such a large safety factor toward tensile
failure was assumed in the design to prevent both the pull-out failure of the connectors and the debonding of the SRG strips installed on the side walls.
Despite the severe vertical bending experienced by the façade, outwards failure was prevented by the horizontal SRG strips installed on the external side of the wall. On the contrary, the absence of horizontal SRG strips in the internal side led to the development of a vertical crack dividing the wall into two portions, which rotated inwards around the connectors (tag 2 in Figures 9(b), 10(a), and 10(b), and Figure 9(e)), cutting the slate-steel net (tag 3 in Figures 9(b) and 10(b)).
The load on the connectors retaining the façade was effectively transferred by adhesion from the four SRG strips to the side walls, where an in-plane mechanism activated due to the combined effect of bending and shear stresses, as it is expected when the masonry structure exhibits a box-type behaviour. Additional vertical loads (e.g., self-weight of masonry walls, floors, or roof) above the side walls were simulated by two 20 steel rods (one per side) placed near the free ends of the laterals walls and simply tightened without pre-tensioning. The rods prevented the side walls from being involved for their whole length in the out-of-plane collapse of the façade, thus reproducing a more realistic situation. A diagonal crack formed on both the side walls, from the connectors at 1.50m of height down to the opposite back corner (tag 4 in Figures 9(c), 10(c) and 10(d), and Figure 9(f)) as a consequence of the impact at the corners of the front wall moving inwards. Immediately after, with the inversion of earthquake motion, a horizontal crack developed all along the base of both side walls, completely separating them from the foundation (tag 5 in Figures 9(a), 9(c), 10(c) and 10(d)). Outwards sliding values of 10mm and 25mm were measured at the right and at the left walls, respectively.
Finally, due to the intensity of seismic input and the limited thickness of the masonry wall, several diagonal cracks appeared on the façade, and the one in the vicinity of the steel end-plates, which already formed during the previous experimental study (Figure 3(c)), and was filled with mortar within the retrofitting works, reopened (tag 6 in Figures 9(b) and 10(a)). However, despite the overall severe damage, no portions of relevant size felt down.
(b) (c) (a) 1 1 2 3 4 5 (e) (f) (d) 5 6
Figure 9. Retrofitted specimen after failure: (a) vertical cracks at the corner separating the façade from the side walls, (b) damage in the internal side of the front wall, (c) damage in the side walls, details (d) of the crack between façade and left side wall, (e) of the vertical crack induced by bending in the middle of the front wall, and (f) of the diagonal
crack produced by in-plane loads on the right side wall. 4.1.2. Response to earthquake motion
The response of the front wall to out-of-plane earthquake motion was a combination of vertical and horizontal bending. In the former, the wall behaved as a vertical cantilever fixed at the base, rotating/bending in a vertical plane (around a horizontal axis), as a result of both the nearly elastic deformation of the whole specimen, and the detachment from the side walls. In the latter, the façade bent in a horizontal plane (around a vertical axis) due to the constrains provided by the side walls and the steel connectors at the corners. The cantilever vertical bending was measured as the mean relative displacement between couple of points vertically aligned, according to the following expression: V=(T6+T8)/2–(T1+T2)/2. (T6+T8)/2 is the mean of the horizontal displacements
recorded by wire transducers #6 and #8 (on the wall), while (T1+T2)/2 is the mean of the horizontal
displacements recorded by wire transducers #1 and #2 (on the foundation). Transducer #6 was vertically aligned with #1 and #8 was vertically aligned with #2. Similarly, the horizontal bending was measured as the mean of the relative displacements between couples of points horizontally aligned, according to the following expression: H=T7–(T6+T8)/2. T7 is the horizontal displacement
recorded by transducer #7 (in the middle of the front wall), while T6 and T8 were recorded by
transducers #6 and #8 (near the corners).
The Time Histories (TH) recorded during two strong inputs, namely TH 53 and TH 55, are shown in Figure 11. Graphs 11(a-c) show the response to 2009 Nocera Umbra record, amplified with a SF of 2.0 (TH 53), corresponding to a PGA of 1.494g (Figure 11(a)). The relative displacement V,
measuring the vertical bending, reached 11mm (Figure 11(b)), while the maximum relative displacement of the centre of the façade with respect to the corners (H), which is related to
horizontal bending, was about 2.5mm (Figure 11(c)). The opening of the vertical cracks separating the façade from the transverse walls was more evident at the left corner, where a relatively high stress (3) was recorded by the strain gauge on the connector. As a result of crack opening, the
connection was more deformable than in the previous tests (see the columns of max|V| and min|V|
in Table A). A certain rotation of the front wall around the connectors was allowed from this moment on, and the open joint allowed for impacts to occur during motion, as revealed by the negative (inwards) peaks in the displacement time history. Figures 11(d-f) show the response to MrnWE record amplified by SF=2.5 (TH 55, PGA=0.885g). Despite the higher scale factor, the response of the specimen in terms of vertical bending was lower (Figure 11(e)) than in the previous case, because all the intensity measures of the natural (unscaled) record (namely, PGA, VSI and Sa)
were lower (Table I). Conversely, the horizontal bending displacements were higher (up to 5.5mm, Figure 11(f)), indicating that damage was developing in the middle of the front wall.
The response of the specimen to all the shake table tests is represented in Figure 12. The relative displacements related to vertical and horizontal bending (V and H) are on the x-axis, while the
peak ground acceleration (PGA) and the Maximum Incremental Velocity (MIV) are on the y-axis for Figures 12(a) and 12(b), respectively. As a general trend, the response is practically linear up to a PGA of about 0.5g and a MIV of 400mm/s. Then, some damage, as shown by the loss of linearity in the relationship between input and response measures. Displacements associated to vertical bending were generally larger than those of horizontal bending, especially for strong inputs, which caused progressive crack development and crushing (with loss of mortar) in the vertical joints at the corners. On the contrary, the SRG strips bonded to the façade limited deformations and damage, which appeared only in the last round (with SF=2.5).
1 1 (a) (c) (d) (b) 2 2 3 4 4 5 5 6
Figure 10. Survey of the crack pattern after failure: (a) outside and (b) inside view of the front wall, outside view of (c) left and (d) right walls.
-1.5 -1 -0.5 0 0.5 1 1.5 a [ g ] -10 -5 0 5 10 V [ m m ] 0 5 10 15 -4 -2 0 2 4 6 t [s] H [ m m ] 0 5 10 15 20 t [s] MrnWE SF=2.50 PGA=0.885g [TH 55] R1168WE SF=2.00 PGA=1.494g [TH 53] (a) (c) (d) (e) (f) (b) 0 5 10 15 t [s] u [mm] 6 8 1 2 6 8 7 6 8 1 2 6 8 7 6 8 1 2 6 8 7 6 8 1 2 6 8 7
Figure 11. Time histories recorded during tests under (a,d,e) R1168WE with SF=2.00 and (b,d,f) MrnWE with SF=2.50: (a,d) earthquake base acceleration, (b,e) vertical bending (V), and (c,f) horizontal bending (H).
-15 -10 -5 0 5 10 15 -1200 -800 -400 0 400 800 1200 M IV [ m m /s ] -15 -10 -5 0 5 10 15 -1.6 -1.2 -0.8 -0.4 0 0.4 0.8 1.2 1.6 P G A [ g ] (a) (b) T6-T1 6 7 1 6 7 1 T7-T6 T6-T1 T7-T6 u [mm] u [mm]
-15 -10 -5 0 5 10 15 -1200 -800 -400 0 400 800 1200 V, H [mm] M IV [ m m /s ] -15 -10 -5 0 5 10 15 -1.6 -1.2 -0.8 -0.4 0 0.4 0.8 1.2 1.6 V, H [mm] P G A [ g ] (a) (b) V H 6 8 1 2 6 8 7 6 8 1 2 6 8 7 V H 6 8 1 2 6 8 7 6 8 1 2 6 8 7
Figure 12. Relative displacements associated to vertical bending (V) and horizontal bending (H) vs. (a) peak ground
acceleration (PGA) and (b) Maximum Incremental Velocity (MIV). 4.1.3. Dynamic amplification
The seismic action experienced by the structure at a certain height from the foundation depends on the filtering effect produced by the building through which the seismic input propagates [29]. Based on experimental data acquired during shake table tests, a measure of the dynamic amplification was derived by the ratio between the maximum accelerations recorded by accelerometers #7 and #1. The obtained values are illustrated in Figure 13 and are comprised between 1.50 and 1.70. The slight trend upwards, shown by the slope of the regression line, may indicate a certain progressive accumulation of damage. However, the large scatter (R2=0.28) indicates that, on the base of available experimental measurements, no clear relationship can be established between dynamic amplification and input PGA.
0 0.4 0.8 1.2 1.6 0 0.5 1 1.5 2 2.5 3 PGA [g] m a x |A 7 | / P G A [-] CalitWE BagnirWE MrnWE SturWE AQGNS R1168WE 7 1 Regression line y=0.51x + 1.34 R2=0.28 Figure 13. Amplification of acceleration at the top (accelerometer #7) vs. PGA on the foundation (accelerometer #1). 4.2. Comparisons with unstrengthened specimen and with steel tie-bar reinforcement
In order to develop a deeper understanding of the effectiveness of the proposed strengthening solution with steel reinforced grout, the seismic performance of the retrofitted specimen has been compared to that exhibited without reinforcement and with tie-bars. More specifically, the following five configurations have been considered (Figure 14):
(a) undamaged (unreinforced, before crack development),
(b) damaged (façade detached from the side walls, before collapse),
(c) rocking (after out-of-plane overturning of the façade, behaving as a rigid body under rocking motion),
(d) reinforced with steel tie-bars, (e) repaired/retrofitted with SRG.
In the following sections, the comparisons among these configurations are made in terms of seismic capacity (Section 4.2.1.), vertical and horizontal bending (Section 4.2.2.), and dynamic properties (Section 4.2.3.).
(b) (c) (d) (e)
(a)
Figure 14. Specimen configurations: (a) undamaged, (b) damaged (cracked without front wall separation), (c) rocking (detached façade), (d) strengthened with steel tie-bars, and (e) retrofitted with SRG.
4.2.1. Seismic capacity
The comparison in terms of seismic capacity among the unreinforced specimen and different strengthening solutions (namely, steel tie-bars and SRG) is shown in Figure 15, having the recorded PGA on the y-axis, and either the vertical bending (V, Figure 15(a)) or the horizontal bending (H,
Figure 15(b)) on the x-axis. The out-of-plane overturning of the unreinforced wall occurred under CalitWE signal with a PGA of 0.291g. Apart from the last test (in which overturning occurred), the maximum relative displacement was nearly 5mm for PGA=0.277g. The same record was applied to the retrofitted specimen up to a PGA of 0.424g, and lower relative displacements were measured. R1168WE signal applied with PGA=0.82g on the wall with the steel tie-bars induced a severe damage, though not a proper failure (as described in section 2.1). A much higher PGA (1.507g) caused the failure of the specimen retrofitted with SRG, which showed smaller relative displacements at similar input intensity values. The comparison in terms of horizontal bending shows that both the unreinforced wall and that retrofitted with and SRG displayed a strong increase in the relative displacement only at failure, while in the specimen strengthened with tie-bars large displacements occurred also well before failure, due to the development of the vertical crack in the middle of the façade. In conclusion, assuming the PGA as a reliable indicator of the input intensity (Figure 12(a)), the improvement of the seismic capacity provided by the reinforcement with steel-tie bars and with SRG was, in the present case, in the order of 3 and 5 times, respectively.
5 10 15 20 0 0.2 0.4 0.6 0.8 1 1.2 1.4 1.6 P G A [ g ] | V| [mm] 5 10 15 20 0 0.2 0.4 0.6 0.8 1 1.2 1.4 1.6 P G A [ g ] | H| [mm] CalitWE Unstr. CalitWE SRG R1168WE Tie-bars R1168WE SRG Failure Out-of-plane Overturning Unstrengthened (solid) Unstrengthened (damaged) Strengthened with tie rods Strengthened with SRG
(a) (b)
Unstrengthened (solid) Unstrengthened (damaged) Strengthened with tie rods Strengthened with SRG
6 8 1 2 6 8 7 6 8 1 2 6 8 7
Figure 15. Comparison between different reinforcement solutions (unreinforced, steel tie-bars, and SRG) in terms of seismic capacity: (a) PGA vs. vertical bending (V) and (b) horizontal bending (H).
4.2.2. Out-of-plane bending responses
The seismic responses of the different specimen configurations are represented in Figures 16 and 17. The former shows the time histories recorded on the retrofitted wall compared to those acquired on the unreinforced one, before (Figures 16(a-c)) and after (Figures 16(d-f)) cracking. Under BagnirWE record with SF=0.5 (PGA=0.083g, Figure 16(a)), the response of the undamaged and of the retrofitted specimens are similar, especially in terms of vertical bending (Figure 16(c)), while the SRG entails smaller horizontal bending (Figure 16(b)), due to the increased stiffness provided by the horizontal reinforcement strips bonded to the façade. Differently, after damage developed on the unreinforced specimen, much larger relative displacements took place, as shown by the records under CalitWE SF=1.50. The occurrence of cracks, separating the side walls from the façade (which rotated around a base hinge, without overturning), is clearly shown by the displacements associated to vertical bending (V, Figure 16(e)). Furthermore, the loss of lateral connection at the corners led
to impacts during motion, which were responsible for significant horizontal bending during inwards movements, as proven by the negative peaks (up to 1.5mm) of the H time history (Figure 16(f)).
Conversely, in the retrofitted specimen, not only smaller relative displacements, but also a faster damping of oscillations was found (Figure 16(e)).
The comparison between rocking and SRG configurations is shown in Figures 17(a-c). Apart from the huge difference between V time histories (Figure 17(b)), which was the obvious consequence
of the rocking motion of the unreinforced wall, both the residual displacements (Figure 17(b)) and the bending (Figure 17(c)) were extremely smaller in the retrofitted specimen. In Figures 17(d-f) the response of the specimen retrofitted with SRG is compared to that with steel tie-bars. Despite the significant increase in the seismic capacity, already discussed in the previous section, the wall with tie-bars showed larger relative displacement peaks and larger residual displacements than that with SRG (Figures 17(e-f)). The different damage was a result of the distributed effect of the horizontal SRG strips, of the presence of the bi-directional slate-stainless steel net on both the internal and external surfaces of the wall, and of the filling of existing cracks (including the vertical cracks at the corners) which partially limited the impacts during motion (Figure 17(f)).
-2 0 2 4 6 V [ m m ] 0 5 10 15 20 -2 -1 0 1 2 t [s] H [ m m ] -0.3 -0.2 -0.1 0 0.1 0.2 0.3 a [ g ] 0 10 20 30 40 50 60 t [s] BagnirWE SF=0.50 Undamaged (PGA=0.090g) SRG (PGA=0.082g) [TH 14] (a) (b) (c) (d) (e) (f) CalitWE SF=1.50 Damaged (PGA=0.218g) 0 SRG (PGA=0.248g) [TH 41] 6 8 1 2 6 8 7 6 8 1 2 6 8 7 6 8 1 2 6 8 7 6 8 1 2 6 8 7
Figure 16. Comparison between (a,b,c) undamaged and SRG specimen configurations under BagnirWE with SF=0.50, and (d,e,f) damaged and SRG specimen configurations under CalitWE with SF=1.50: (a,d) time histories of earthquake
base acceleration, (b,e) vertical bending (V), and (c,f) horizontal bending (H).
-0.8 -0.4 0 0.4 0.8 a [ g ] 0 5 10 15 20 25 t [s] 0 5 10 15 -10 -5 0 5 10 t [s] H [ m m ] -4 -2 0 2 4 6 V [ m m ] R1168WE SF=0.50 Rocking (PGA=0.283g) SRG (PGA=0.293g) [TH 18] (a) (b) (c) (d) (e) (f) SturWE SF=1.50 Tie-bars (PGA=0.540g) SRG (PGA=0.704g) [TH 43] 0
Unstrengthened (solid) Unstrengthened (damaged) Strengthened with tie rods Strengthened with SRG
Unstrengthened (solid) Unstrengthened (damaged) Strengthened with tie rods Strengthened with SRG
6 8 1 2 6 8 7 6 8 1 2 6 8 7 6 8 1 2 6 8 7 6 8 1 2 6 8 7
Figure 17. Comparison between (a,b,c) rocking and SRG specimen configurations under R1168WE with SF=0.50, and (d,e,f) tie-bars and SRG specimen configurations under SturWE with SF=1.50: (a,d) time histories of earthquake base
4.2.3. Dynamic properties
The dynamic properties of the five specimen configurations are illustrated in Figure 18 for some sample tests, while the variation along the whole study is shown in Figure 19. For each test, the fundamental frequency was derived from the transfer function (Txy), which represents the filtering
effect of the structure expressed through the comparison of the output signal (y) and the input signal (x). Differently from other dynamic identification techniques, such as, for instance, the Discrete Fourier Transform (DFT), the Power Spectral Density (PSD), and the Frequency Domain Decomposition (FDD), the transfer function provides information on the dynamic properties of the structure independently from the frequency content of the input and provides good results for non-stationary input signals. In the present work, the acceleration time histories recorded by accelerometers #1 and #7 were assumed as input and output signals, respectively. Txy(f) is defined
as the ratio between the cross power spectral density of x and y and the power spectral density of x. It is a complex function, and its modulus is depicted on the y-axis of the graphs.
Before the beginning of the test series, the fundamental frequencies of the undamaged and retrofitted specimens detected under a white-noise input with 0.05g PGA were 13.6Hz and 16.2Hz, respectively (Figure 18(a)) and correspond to the values obtained from a relatively simple numerical model with shell finite elements [26]. Such increase (from 13.6Hz to 16.2Hz) mainly depended on the steel connectors placed across the vertical joints at the corners, which limited their outwards deformation, and to the horizontal SRG strips bonded to the façade, which constrained its bending deflection. The unreinforced specimen steadily accumulated damage, decreasing its fundamental frequency to 6.6Hz (Figures 18(b) and 19). A comparable sequence of seismic tests caused a much smaller frequency reduction of the retrofitted wall, as it is evident from Figure 18(b), which reveals a peak at 14.8Hz. The wall also exhibited a smaller peak at about 8Hz, which was already visible (though less pronounced) under the preliminary monitoring under white noise, and is related to a modal shape involving the out-of-plane bending of the side walls [26]. The out-of-plane rocking motion of the front wall after its complete detachment has fundamental frequency of about 1Hz (Figure 18(c), [23]), but it should be considered that such an inverted pendulum behaviour is strongly non-linear (i.e., its frequency depends on the amplitude of the oscillations), and, therefore, the results provided by the transfer function are less reliable than for the other configurations. The comparison with the retrofitted specimen is made under a white noise after the SF=1.0 series, and, in this case, the frequency of the wall reinforced with SRG was 14.6Hz. Finally, as indicated by Figure 18(d), the fundamental frequency after the installation of the tie-bars was 7.8Hz and decreased to 5-6Hz after 9 tests (Figure 19). The specimen retrofitted with SRG showed a slower accumulation of damage and its frequency declined to 10-11Hz only during the most severe tests (Figure 19 and Table A).
For the dynamic identification under stationary inputs (white noise, Figures 18(a) and 18(c)), the windowing technique was used to allow for a more reliable identification of the fundamental frequency. Windowing consists in analysing several portions with a certain duration (the width of the window), e.g. 30s, of the input and output signals, starting from different time instants (e.g., 0s, 10s, 20s, and so on). Then, the average transfer function is computed, which is smoother than those of each portion. Windowing cannot be applied to non-stationary signals, such as earthquake records. The fundamental frequencies derived from accelerometers were validated against those provided by other two independent measurement systems, such as a velocimeter placed on top of the wall for HVSR assessment [27] and the abovementioned 3D motion capture system through Operational Modal Analysis (OMA). This latter, also gave information on three-dimensional modal shapes [26,30], which could not be provided by the accelerometers and the wire transducers placed in out-of-plane direction on the façade.
0 5 10 15 20 25 30 0 5 10 15 |T x y (f)| [-] |T x y (f)| [-] 0 5 10 15 20 25 30 0 5 10 15 |T x y (f)| [-] Tie-bars (PGA=0.583g) SRG (PGA=0.543g) [TH 30] Damaged (PGA=0.164g) SRG (PGA=0.167g) [TH 26] CalitWE SF=1.00 R1168WE SF=1.00 Undamaged SRG
White Noise at test beginning
White Noise after SF=1.00 series Rocking SRG f=13.6Hz f=16.2Hz f=6.6Hz f=14.8Hz (a) (c) (b) (d) f=14.6Hz f=7.8Hz f=14.3Hz Unstrengthened (solid) Unstrengthened (damaged) Strengthened with tie rods Strengthened with SRG
f=1.1Hz Unstrengthened (solid) Unstrengthened (damaged) Strengthened with tie rods Strengthened with SRG
f [Hz] f [Hz]
Figure 18. Modulus of the transfer function of the specimen configurations: comparison between SRG and (a) undamaged, (b) damaged, (c) rocking, and (d) tie-bars (rivedi i grafici, metti quelli con il windowing).
0 5 10 15 20 f [Hz ] Collapse (out-of-plane overturning)
Unstrengthened (solid) Unstrengthened (damaged) Strengthened with tie rods Strengthened with SRG
Unstrengthened (solid) Unstrengthened (damaged) Strengthened with tie rods Strengthened with SRG
Installation of steel tie-bars
Retrofitting with SRG
Unreinforced
Reinforced with tie-bars Reinforced with SRG
Figure 19. Variation of the predominant frequency during test sequence for all specimen configurations.
5. CONCLUSIONS
A shake table investigation was carried out on a natural scale masonry specimen retrofitted with Steel Reinforced Grout (SRG). Tests were carried out under natural accelerograms with increasing intensity up to failure, to investigate the effectiveness of the proposed strengthening solution for improving the out-of-plane seismic capacity of masonry walls. The following results were achieved: Externally bonded reinforcement with SRG provides a significant improvement of the
out-of-plane seismic capacity of masonry walls and may be an effective alternative to traditional strengthening devices. In the present case, the maximum Peak Ground Acceleration was 0.29g for the unreinforced wall (failure by overturning), 0.82g for the wall reinforced with steel tie-bars (extremely severe damage without collapse), and 1.51g for the wall retrofitted with SRG (damage without collapse).
SRG connectors provide an effective connection between the transverse walls and the façade, preventing its out-of-plane overturning. The specimen under investigation exhibited a box-type behaviour, and the tridimensional response of its façade was represented as a combination of vertical and horizontal bending. In the former the wall behaved as a vertical cantilever fixed at the base, while in the latter the façade bent in a horizontal plane due to the constrains provided by the side walls and the steel connectors at the corners.
Reinforcement textiles applied to the front wall of a masonry building significantly improve its bending strength, and, in combination with well-anchored connectors, provide a
distributed retaining effect, which avoids the local damage due to the punching effect of the end-plates of traditional tie-bars.
SRG reinforcement entails a limited modification of the initial dynamic properties of the masonry structure and limit damage development induced by earthquake loading.
The retrofitting system with SRG can be designed following the recommendations developed for FRP, provided that the possible occurrence of failure modes within the mortar thickness of the reinforcement (which are not expected for epoxy resins) is also considered. For design purposes, it should be also taken into account that, as mortar matrix may exhibit cracks, the durability of the textile towards the aggression of external environment needs to be ensured (e.g., by using galvanized steel cords). Furthermore, a proper installation procedure that includes a suitable preparation/consolidation of the substrate, a correct mix design of the mortar, and adequate curing conditions, is fundamental to achieve a sufficient adhesion of the reinforcement.
The proposed retrofitting system appears promising for safeguarding the cultural heritage, as it ensures the mechanical effectiveness, is time and cost efficient, and, thanks to the use of inorganic matrices, allows for the fulfillment of preservation requirements for applications to historic substrates. Moreover, thanks to the small thickness, it can be installed within the existing layer of plaster, and, therefore, can be integrated in the maintenance/cleaning works of the façades, allowing for the preservation of the appearance and of the architectural value of the construction.
ACKNOWLEDGEMENTS
This work has been carried out under the research project ReLUIS-DPC 2014-2016, Thematic Area “Innovative materials for interventions in seismic areas”.
REFERENCES
1. Giuffrè A. A mechanical model for statics and dynamics of historical masonry buildings. Protection of the
architectural heritage against earthquakes, Petrini V, Save M (eds.). CISM Courses and Lectures no. 359.
Springer-Verlag: Wien, 1996; 71-152.
2. Costa AA, Arêde A, Campos-Costa A, Penna A, Costa A. Out-of-plane behaviour of a full scale stone masonry façade. Part 2: shaking table tests. Earthquake Engineering and Structural Dynamics 2013; 42 (14): 2097-2111. DOI: 10.1002/eqe.2314.
3. de Felice G. Out-of-plane seismic capacity of masonry depending on wall section morphology. International
Journal of Architectural Heritage 2011; 5 (4-5): 1-17. DOI:10.1080/15583058.2010.530339.
4. D’Ayala D, Speranza E. Definition of collapse mechanisms and seismic vulnerability of historic masonry buildings. Earthquake Spectra 2003; 19 (3): 479-509. DOI: 10.1193/1.1599896.
5. Moon L, Dizhur D, Griffith M, Ingham JM. Performance of unreinforced clay brick masonry buildings during the 22nd February 2011 Christchurch earthquake. Journal of the Structural Engineering Society of New Zealand 2011; 24 (2): 59-84.
6. Lagomarsino S. Damage assessment of churches after L'Aquila earthquake (2009). Bulletin of Earthquake
Engineering 2012; 10 (1): 73-92. DOI: 10.1007/s10518-011-9307-x.
7. Sorrentino L, Liberatore L, Decanini LD, Liberatore D. The performance of churches in the 2012 Emilia earthquakes. Bulletin of Earthquake Engineering 2013; 12 (5): 2299-2331. DOI: 10.1007/s10518-013-9519-3. 8. Tomaževič M, Lutman M, Weiss P. Seismic upgrading of old brick-masonry urban houses: tying of walls with
steel ties. Earthquake Spectra 1996; 12 (3): 599-622. DOI: 10.1193/1.1585898.
9. Tumialan G, Galati N, Nanni A. Fibre-Reinforced Polymer Strengthening of Unreinforced Masonry Walls Subject to Out-of-Plane Loads. ACI Structural Journal 2003; 100 (3): 321-329. DOI: 10.14359/12607.
10. Willis CR, Yang Q, Seracino R, Griffith MC. Damaged masonry walls in two-way bending retrofitted with vertical FRP strips. Construction and Building Materials 2009; 23 (4): 1591-1604. DOI: 10.1016/j.conbuildmat.2007.09.007.
11. Papanicolaou CG, Triantafillou TC, Papathanasiou M, Karlos K. Textile-reinforced mortar (TRM) versus FRP as strengthening material of URM walls: out-of-plane cyclic loading. Materials and Structures 2008; 41 (1): 143-157. DOI: 10.1617/s11527-007-9226-0.
12. Valluzzi MR, Modena C, de Felice G. Current practice and open issues in strengthening historical buildings with composites. Materials and Structures 2014; 47 (12): 1971-1985. DOI: 10.1617/s11527-014-0359-7.
13. Ascione L, de Felice G, De Santis S. A qualification method for externally bonded Fibre Reinforced Cementitious Matrix (FRCM) systems. DOI: 10.1016/j.compositesb.2015.03.079.
14. ACI 459.4R-13: Guide to design and construction of externally bonded fabric-reinforced cementitious matrix (FRCM) systems for repair and strengthening concrete and masonry structures. American Concrete Institute: Farmington Hills, MI, 2013.
15. De Santis S, de Felice G. Tensile behaviour of mortar-based composites for externally bonded reinforcement systems. Composites Part B: Engineering 2015; 68: 401-413. DOI: 10.1016/j.compositesb.2014.09.011.
16. Malena M, de Felice G. Debonding of composites on a curved masonry substrate: experimental results and analytical formulation. Composite Structures 2014; 112: 194-206. DOI: 10.1016/j.compstruct.2014.02.004. 17. de Felice G, De Santis S, Garmendia L, Ghiassi B, Larrinaga P, Lourenço PB, Oliveira DV, Paolacci F,
Papanicolaou CG. Mortar-based systems for externally bonded strengthening of masonry. Materials and
Structures 2014; 47 (12): 2021-2037. DOI: 10.1617/s11527-014-0360-1.
18. Maalej M, Lin VWJ, Nguyen MP, Quek ST. Engineered cementitious composites for effective strengthening of unreinforced masonry walls. Engineering Structures 2010; 32 (8): 2432-2439. DOI: 10.1016/j.engstruct.2010.04.017.
19. Babaeidarabad S, Caso F, Nanni A. Out-of-Plane Behavior of URM Walls Strengthened with Fabric-Reinforced Cementitious Matrix Composite. Journal of Composites for Construction 2014; 18 (4): 04013057. DOI: 10.1061/(ASCE)CC.1943-5614.0000457.
20. Paganoni S, D'Ayala D. Testing and design procedure for corner connections of masonry heritage buildings strengthened by metallic grouted anchors. Engineering Structures 2014; 70: 278-293. DOI: 10.1016/j.engstruct.2014.03.014.
21. Mendes N, Lourenço PB, Campos-Costa A. Shaking table testing of an existing masonry building: assessment and improvement of the seismic performance. Earthquake Engineering and Structural Dynamics 2014; 43 (2): 247-266. DOI: 10.1002/eqe.2342.
22. Borri A, Castori G, Corradi M. Shear behavior of masonry panels strengthened by high strength steel cords.
Construction and Building Materials 2011; 25 (2): 494-503. DOI: 10.1016/j.conbuildmat.2010.05.014.
23. AlShawa O, de Felice G, Mauro A, Sorrentino L. Out-of-plane seismic behaviour of rocking masonry walls.
Earthquake Engineering and Structural Dynamics 2011; 41 (5): 949-968. DOI: 10.1002/eqe.1168.
24. CNR-DT 200 R1/2012: Guide for the design and construction of externally bonded FRP systems for strengthening existing structures. CNR, Italian Research Council: Rome, Italy, 2012 (In Italian).
25. De Santis S, Casadei P, de Felice G. Tests on the bond performance of mortar-based strengthening systems on masonry substrates. Proceedings of IMC 2014, 9th International Masonry Conference, Guimarães, Portugal 2014, Paper No 1438.
26. De Canio G, de Felice G, De Santis S, Giocoli A, Mongelli M, Paolacci F, Roselli I. Passive 3D motion optical data in shaking table tests of a SRG-reinforced masonry wall. Submitted for publication.
27. De Canio G., Mongelli M., Roselli I. 3D Motion Capture Application to Seismic Tests at ENEA Casaccia Research Center: 3DVision System and DySCo Virtual Lab. WIT Transactions on The Built Environment 2013;
134: 803-814. DOI: 10.2495/SAFE130711.
28. CEN, European Committee for Standardization. EN 1998-1 Eurocode 8: Design Provisions for Earthquake Resistance of Structures, Part 1.1: General rules, seismic actions and rules for buildings, 2004.
29. Priestley MJN. Seismic behaviour of unreinforced masonry walls. Bulletin of the New Zealand National Society of
Earthquake Engineering 1985; 18 (2): 191-205.
30. De Canio G., Andersen P., Roselli I., Mongelli M., Esposito E. Displacement Based Approach for a Robust Operational Modal Analysis. Proceedings of the Society for Experimental Mechanics Series, 29th IMAC, A
Conference on Structural Dynamics, Jacksonville, Florida, USA 2011, Paper No 191.
APPENDIX
Table A. Test results: main properties of earthquake base excitation and of the response of the specimen.
TH Record SF
Input measures Response measures
PGA PGV VSI |MIV| max |A7| f max V min V max H min H max |3| max |4|
- [g] [mm/s] [mm] [mm/s] [g] [Hz] [mm] [mm] [mm] [mm] [N/mm2] [N/mm2] 1 CalitWE 0.10 0.027 12.0 0.30 27.4 0.059 16.7 0.073 -0.449 0.069 -0.435 2.2 1.5 2 BagnirWE 0.10 0.026 9.0 0.20 20.6 0.057 16.7 0.144 -0.202 0.174 -0.287 1.7 1.8 3 MrnWE 0.10 0.044 17.8 0.30 33.5 0.061 16.0 0.433 -0.020 0.052 -0.392 2.2 1.0 4 SturWE 0.10 0.044 16.3 0.33 28.9 0.096 16.2 0.290 -0.109 0.299 -0.273 2.0 1.8 5 AQGNS 0.10 0.051 23.8 0.49 36.3 0.094 16.2 0.210 -0.253 0.315 -0.181 1.5 1.4 6 R1168WE 0.10 0.060 26.2 0.40 54.1 0.105 15.6 0.175 -0.261 0.255 -0.283 1.9 2.0 7 CalitWE 0.30 0.054 48.6 1.13 77.0 0.113 15.5 0.568 -0.140 0.531 -0.193 2.1 1.4 8 BagnirWE 0.30 0.054 36.0 0.93 72.4 0.098 15.8 0.466 -0.161 0.094 -0.407 1.5 1.4 9 MrnWE 0.30 0.093 61.4 0.93 115.5 0.139 15.8 0.427 -0.269 0.468 -0.120 2.0 1.9 10 SturWE 0.30 0.133 44.5 1.18 85.3 0.18 16.0 0.541 -0.448 0.251 -0.457 1.4 1.6 11 AQGNS 0.30 0.156 69.9 1.34 158.0 0.275 16.2 0.631 -0.275 0.356 -0.222 2.2 2.5 12 R1168WE 0.30 0.176 74.4 1.04 139.7 0.246 16.1 0.281 -0.852 0.549 -0.372 1.9 3.8 13 CalitWE 0.50 0.083 49.9 1.30 148.9 0.125 15.7 0.397 -0.455 0.559 -0.196 2.0 2.4 14 BagnirWE 0.50 0.082 38.9 0.76 142.4 0.126 15.7 0.452 -0.196 0.112 -0.485 1.5 2.7 15 MrnWE 0.50 0.148 91.8 1.28 192.8 0.219 15.2 0.203 -0.744 0.328 -0.401 1.5 2.7 16 SturWE 0.50 0.223 87.6 1.99 169.4 0.278 15.5 0.400 -0.446 0.548 -0.345 1.6 3.2
![Figure 3. Damage pattern induced by the shale table test series prior the installation of SRG reinforcement [23]: (a) vertical crack at the corner separating the façade from the side walls, (b) vertical crack in the middle of the front wall,](https://thumb-eu.123doks.com/thumbv2/123dokorg/5587147.67190/5.892.107.785.83.453/figure-damage-installation-reinforcement-vertical-separating-façade-vertical.webp)