CRITICAL REVIEW
Mechanical characterization and properties of laser-based powder
bed
–fused lattice structures: a review
Leonardo Riva1&Paola Serena Ginestra1&Elisabetta Ceretti1
Received: 8 October 2020 / Accepted: 11 January 2021 # The Author(s) 2021
Abstract
The increasing demand for a wider access to additive manufacturing technologies is driving the production of metal lattice structure with powder bed fusion techniques, especially laser-based powder bed fusion. Lattice structures are porous structures formed by a controlled repetition in space of a designed base unit cell. The tailored porosity, the low weight, and the tunable mechanical properties make the lattice structures suitable for applications in fields like aerospace, automotive, and biomedicine. Due to their wide-spectrum applications, the mechanical characterization of lattice structures is mostly carried out under com-pression tests, but recently, tensile, bending, and fatigue tests have been carried out demonstrating the increasing interest in these structures developed by academy and industry. Although their physical and mechanical properties have been extensively studied in recent years, there still are no specific standards for their characterization. In the absence of definite standards, this work aims to collect the parameters used by recent researches for the mechanical characterization of metal lattice structures. By doing so, it provides a comparison guide within tests already carried out, allowing the choice of optimal parameters to researchers before testing lattice samples. For every mechanical test, a detailed review of the process design, test parameters, and output is given, suggesting that a specific standard would enhance the collaboration between all the stakeholders and enable an acceleration of the translation process.
Keywords Additive manufacturing . Laser-based powder bed fusion . Compression test . Fatigue test . Bending test . Tensile test
1 Introduction
Additive manufacturing (AM), commonly known as 3D printing, has faced an extraordinary growth during the last years [1–3]. AM is defined by ASTM F2792 as “the process of joining materials to make objects from 3D model data, usually layer upon layer, as opposed to subtractive manufacturing methodologies” [4]. Briefly, a CAD model of the parts is divided in cross-sectional layers by a slicer software and uploaded into a printer that proceeds to build the object adding the material only where it is needed following the cross-section sequence [5]. AM was originally used for rapid prototyping pur-poses, but in the last few years, the quality and perfor-mances of the produced samples made it spread globally.
This expansion is intended to continue in the next years; in fact, if the value of the AM market in 2016 was around 7 billion dollars, it is estimated to reach about 27 billion in 2022 [6]. Polymers are the most used ma-terial in AM, but in the last few years, metals have had the biggest growth rate. Among the technologies able to 3D print metals, laser-based powder bed fusion (PBF-LB) is one of the most used. PBF-LB is a powder bed fusion system in which a laser beam is used to locally melt metallic powder. More specifically, a PBF-LB sys-tem consists in a roller, two platforms, and a laser [5]. The roller pushes a thin layer of metallic powder on the building platform; then, the laser melts the powder fol-lowing a filling strategy of the cross section of the de-signed object [7]. Once the layer has been completely melted and solidified, the building platform moves down, the feeding platform rises, and the roller spreads another layer of powder (Fig. 1). The laser melts the second layer of powder that will adhere to the lower layer. Once the process is completed, the unmelted powder is typically collected with a vacuum cleaner to be reused.
* Leonardo Riva [email protected]
1 Department of Industrial and Mechanical Engineering, University of
Brescia, Via Branze 38, 25125 Brescia, Italy
https://doi.org/10.1007/s00170-021-06631-4
PBF-LB allows the fabrication of almost fully dense me-tallic parts with the advantage of a high degree of preci-sion and freedom of design [8, 9]. In fact, it is possible to produce porous structures not obtainable with the tra-ditional technologies [10]. These structures, called lattice, are composed of struts and nodes, where nodes are the meeting points of the struts’ end. Lattices can be either stochastic or made by the repetition in different direc-tions of a unit cell with a defined geometry [11]. Stochastic lattice structures have no fully predictable me-chanical properties due to the random distribution and orientation of their struts and nodes, limiting their actual use. Unit cell lattice structures, instead, are the most studied due to their repeatable mechanical properties that can match the properties of bulk parts but with signifi-cant lower weight. Furthermore, they have demonstrated good energy absorption, as well as good thermal and acoustic insulation [12]. Lattice structures can be classi-fied based on their deformation behavior, typically divid-ed into two different deformation mechanisms: bending-dominated and stretch-bending-dominated. Bending-bending-dominated structures have lower mechanical strength and higher en-ergy absorption properties while stretch-dominated struc-tures have opposite characteristics [13]. Moreover, it is possible to predict the deformation behavior of the struc-ture based on the geometry of the cell. Metal lattice structures have several possible applications, but the aerospace, automotive, and biomechanical fields are the main ones for lattice design and evaluation. The aero-space and automotive research is always looking for light-weight components with optimal mechanical prop-erties to reduce fuel consumption and carbon emissions while maintaining the structural integrity and safety of the part [14]. Mines et al. [15] and Chantarapanich et al. [16] studied the mechanical properties of sandwich lattice panels as impact absorbers and load carrier. Bici et al. [17] investigated a novel wing leading edge that serves both as an impact absorber and as an anti-ice
system. Miller et al. [18] patented a new system to pro-tect a flight recorder. Büşra et al. [19], after topology optimizing a suspension arm, infilled it with lattice obtaining both strength improvement and weight reduc-tion. On the other hand, in the biomedical field, the lat-tice structures are of particular interest for the production of bone scaffolds [20, 21]. Dr. Joseph became the first surgeon to use a lattice spinal implant during a surgical operation [22]. Many other researchers investigated the feasibility and mechanical properties of porous femoral, hip, and knee implants. Limmahakhun et al. [23] studied a graded femoral stem that controls the micromotions in an acceptable range for bone ingrowth with a flexural stiffness similar to the human bone. Hazlehurst et al. [24] developed a femoral stem 48% lighter and 60% more flexible than a traditional one. España et al. [25] built an implant with a Young modulus matching the cortical bone, reducing the stress shielding effect, and increasing the in vivo life. Moreover, Wang et al. [26] designed a hip prosthesis able to increase the stability of the bone-implant interfaces. Arabnejad et al. [27] devel-oped a systematic approach to design hip implants with a considerable decrease of resorption secondary to stress shielding. Murr et al. [28] demonstrated a biocompatible, customized knee implant with comparable bone stiffness to the natural tissue. Furthermore, Wathule et al. [29] observed no cytotoxicity and good bone ingrowth on a lattice tantalum implant in an in vivo experiment on a rat femur.
For both the application fields mentioned above, the most studied material is the Ti-6Al-4V alloy due to its high mechan-ical properties and excellent biocompatibility; however, many other materials such as 316L stainless steel, CoCr, and Al-10Si-Mg have been studied.
Lattice structures have been deeply tested to charac-terize and validate their mechanical performances. Considering the overarching context of application, the compression test is the most used to characterize these structures, but in the last few years, tensile, fatigue, and bending tests have been carried out to broaden the knowledge of lattice mechanical response. The compres-sion test is usually carried out following the ISO 13314 (related to compression tests for porous and cellular metals) that, although it is not specific for additively manufactured samples [30], provides good indications on which parameters to use during the test. For other characterization tests, there is not a standard for porous or cellular samples. In the absence of a specific interna-tional standard regarding the mechanical characterization of these structures, this review aims to point out which methodologies, instrumentations, and parameters are the most used by the researchers around the world to provide a possible useful guideline for further developments in
design, evaluation, and applications of PBF-LB metal lattices. The review is intended to report the focal points of the PBF-LB process involving the design, material, and process parameters of the PBF-LB technology lead-ing to the mechanical test parameters and outputs collect-ed by several studies with different purposes and appli-cation objectives. Although many 3D technologies enable the production of metal lattice structures, the authors de-cided to focus on PBF-LB due to a several number of papers that report mechanical test data on PBF-LB lattice samples.
2 Production process
In this section, the fundamental aspects for the production of lattice structures will be illustrated, in particular, cell geome-tries, materials used, and printing parameters applied for the PBF-LB process.
2.1 Cell geometry
Cellular structures are available in nature to optimize energy consumption, such as honeycombs, bones, and wood. These structures, despite their light weight and high porosity, have a great load capacity and high functionality [31]. Many manufacturing techniques as investment casting, deformation forming, and metal wire approaches were used to produce
these structures, but the processes were complex and with several drawbacks [32]. Only the recent development of 3D printing made the production of these structures, called lattice, really possible. Lattice structures consist of a base unit cell with a defined geometry repeated periodically in space [33]. Lattices can be categorized in different ways, 2D or 3D, ran-dom or periodic, open or closed [31], homogeneous or hetero-geneous [34], but the most particular ones are strut-based or triply periodic minimal surfaces (TPMS). Within the strut-based lattice, the unit cell is composed of a group of crossbars (s) interconnected with each other in points called nodes (n). The most significant lattice structures are shown in Fig. 2
where the most used strut-based lattice structures are the body-centered cubic (BCC), the face-centered cubic (FCC), and the diamond lattices.
The number of struts (s) and nodes (n) of the unit cell is crucial to predict its deformation mechanism. In fact, they can influence the degree of connectivity and freedom of the unit cell that can be quantified with the Maxwell number (M) (Eq.1):
M ¼ s−3n þ 6 ð1Þ
where M is the Maxwell number, s is the number of struts, and n is the number of nodes inside the unit cell. If M < 0, the structure is under-stiff, the struts are unable to equilibrate the external forces, moments are transferred to the nodes, and the deformation behavior is bending-dominated. If M ≥ 0, the structure is over/ just stiff, the moments are not transferred to the nodes, and the deformation behavior is stretch-dominated [36].
dominated structures are characterized by higher modulus and yield strength [37]. The higher the number of the struts and nodes, the higher the Maxwell number and the higher will be the mechanical strength and cell stiffness. Although the Maxwell number is a good method to predict the deformation behavior of the structure, it is not always a reliable coefficient since the strut configuration and alignment cannot improve the cell stiffness but increase the Maxwell number [36]. The unit cells of strut-based lattice structures cannot exceed 5 mm size due to manufactur-ability problems of overhanging struts [38]; however, the major-ity of the application requires smaller sizes.
As cited above, the other type of lattice structures is the triply periodic minimal surfaces, porous structures with zero mean curvature of the surface [39]. TPMS are generated by algorithms [31] and can be represented by mathematical equa-tions. The main TPMS structures are the gyroid and the dia-mond represented by these equations (Eqs.2and3) [39]: Gyroid : F x; y; zð Þ ¼ cos x * sin y þ cos y * sinz
þ cos z * sin x þ a ð2Þ
Diamond : F x; y; zð Þ ¼ sin x * sin y * sin z þ sin x * cos y * cos z þ cos x * sin y * cos z
þ cos x * cos y * sin z þ a ð3Þ Anyhow, the most used TPMS structure is the gyroid (Fig.3), without straight lines [41] but a spherical core and smooth struts, being self-supporting [38]. Contrary to the strut-based structures, TPMS structures have an inferior limit
on the unit cell size to allow the powder removal from the voids [38].
Regarding the general behavior of lattice structures, the deformation process usually is composed of three regions: elastic, yielding, and post-yielding where the stress reaches a maximum before dropping to a plateau related to the densifi-cation of the material [42]. The mechanical behavior is influ-enced by many factors including the printing process and the microstructure [42], but the material, topology, and relative density of the sample are the main aspects that control the structural properties [43]. Generally, if the relative density decreases, the stiffness and the strength decrease as well [44]. In particular, this relationship can be linear in the case of a stretching-dominated structure or in the form of a power law for a bending-dominated structure [45]. Typically, the relative density increases with the decrease of the unit cell size while the stiffness and strength decrease when the unit cell size increases [38]. For these reasons, the excessive reduction of the strut size can have an unexpected effect on the mechan-ical properties.
The design of a lattice structure is a two-step process: de-sign of the unit cell and dede-sign of the pattern. There are three ways to design a unit cell: a primitive-based method, based on a Boolean operation of geometric primitives; an implicit surface-based method, based on equations that describe the surface of the unit cell in space; and topology optimization, based on algorithms that optimize the distribution of the material.
On the other hand, there are three methods for the pattern design: direct patterning, where the unit cell is repeated along the three dimensions (the most common technique); confor-mal patterning, where the unit cells are positioned in order to match a specific shape; or a topological optimization [32].
Lattice structures can be designed with conventional CAD systems with limits related to the cell repetition in large scale to obtain the structure. Alternatives are MATLAB® [11] or specialized tools. However, the printer-supporting software is typically equipped with an integrated library of the unit cell geometries, for example, the 3DXpert modules of the 3D sys-tems©printers.
2.2 Materials
The most common materials used for the fabrication of lattice structures are Ti-6Al-4V, 316L stainless steel, CoCr, Al-Si alloys, and Ni alloys.
Ti-6Al-4V is the most used type of titanium around the world and holds alone almost half of the global titanium mar-ket [46]. It is an excellent material to be processed by PBF-LB, because in a liquid state, it is very reactive to elements like oxygen and nitrogen and the controlled atmosphere inside the printers limits this reaction [47]. However, the fast heating and cooling rates can generate thermal expansions and residual
stresses in the fabricated titanium parts. To obtain a more stable melting [48] and a lower porosity that can reduce the anisotropy [49], a correct set of parameters should be chosen. Ti-6Al-4V has high strength, corrosion resistance, and bio-compatibility combined with low density and thermal conduc-tivity making it suitable for application in fields like aerospace and biomedicine; however, it is used also in automobile, en-ergy, marine, and chemical industries [46,50]. Concept Laser developed a topology-optimized titanium bracket connector with a weight reduction of more than 30% that has been installed on the Airbus A350 XWB [51]. Bugatti, in collabo-ration with Fraunhofer IAPT and Bionic Production AG, built the volumetrically largest functional component, consisting in a brake caliper meeting the requirements for a sport car pro-duction [52].
The 316L stainless steel is one of the most used materials due to its high welding performance, good durability, and anticorrosion properties [53]. It also has good PBF-LB pro-cessability [54]; nevertheless, it still presents some processing challenges. For example, the energy density must be between a certain range in order to avoid pore formation and vaporiza-tion of alloying elements that affect the mechanical properties [55]. 316L is an austenitic steel with an elevated resistance to creep and oxidation up to 900 °C [56]. 316L is also biocom-patible, which is used to produce plates, screw, and nails and also temporary low-cost cemented implants [57]. Fraunhofer ILT built a helicopter part with a 50% weight reduction due to the internal 316L lattice structures [32]. Wang et al. [58] printed a customized guide to precisely tighten screws in backbone surgeries.
Just like titanium and stainless steel, cobalt-chromium al-loys have been extensively used in biomedical [59], automo-tive, and aerospace fields [60]. CoCr alloys are widely used for the fabrication of dental devices due to corrosion resis-tance, ductility, and strength suitable for this purpose [61]. The high hardness and melting point make this material diffi-cult to process in dental laboratories, so the PBF-LB process became a good technology to process CoCr. Lastly, CoCr does not present any allergic or carcinogenic hazard in com-parison with other metals like nickel and beryllium [62]. Averyanova et al. [63] stated that PBF-LB is a suitable tech-nique to build dental crowns and bridges with good geomet-rical accuracy and adequate mechanical properties. Revilla Leon et al. [64] printed and implanted a CoCr maxilla frame-work on an edentulous patient.
Aluminum alloys are difficult to process via PBF-LB due to poor powder fluidity, laser reflectivity, and oxidation [65]. The PBF-LB process induces a non-equilibrium solidification that increases the solid solution limit of the alloy in the matrix, making it harder to obtain the desired mechanical properties [66]. Nevertheless, aluminum alloys have low density and high strength, making this material the most used structural material with iron and steel [66]. Moreover, when processed,
some alloys can present a better corrosion resistance than the wrought [67]. The majority of the alloys used in PBF-LB are based on commercial grade alloys [66]. The most studied aluminum alloys for PBF-LB are Al-Si alloys, in particular, Al-Si10-Mg [68], a near eutectic alloy mostly used for aero-space and automotive applications [69]. For example, Bugatti installed a PBF-LB Al-Si10-Mg bracket with an integrated cooling system on the Chiron to reduce the heat transmission [70]. Ho et al. [71], instead, produced airfoil heat sinks with different fins’ shapes.
Nickel-based alloys are another group of materials suitable for PBF-LB. They can reach a relative density near to 100% and often present a UTS higher than the cast. Nickel alloys have high corrosion resistance, high fatigue resistance, good weldability [72], and a good surface finish with a roughness below 10 μm. It has been observed that different scanning strategies can generate different grain structures and that mi-crostructural anomalies result from localized shrinkages and stresses, so the proper process parameters must be chosen [73]. The most studied family is Inconel, super alloys used in high-temperature application [47]. For example, Soller et al. [74] developed an Inconel 718 injector for liquid rocket engines, while Caiazzo et al. [75], with the same material, studied the feasibility of producing a turbine blade.
2.3 PBF-LB
—printers and parameters
Laser-based powder bed fusion is an additive manufacturing process for the production of objects through layers of metal powder locally melted following the cross sections of the ob-ject obtained from a CAD model. Initially used as a rapid prototyping technique, it evolved quickly to a manufacturing process due to the possibility of producing complex geome-tries, not achievable with the conventional and traditional technologies [76], and almost fully dense parts with no need of further post-processing [38]. The success of the production process is influenced by the parameter set involving laser power, scanning speed, hatch spacing, and layer thickness [30]. The process parameters are linked by the following equa-tion (Eq.4) [77]:
E ¼ P
v * h * l ð4Þ
where E is the energy density (J/mm3), P is the laser power (W), v is the scanning speed (mm/s), h is the hatch spacing (mm), and l is the layer thickness (mm). Generally, an increase of the energy density results in a decreased porosity [78,79], thus enhancing the mechanical properties.
A typical gap between the CAD model and the as-built structure is related to the actual diameter of the strut that often results larger than the designed one [45]. This outcome is due to the presence of not fully melted powder particles attached to
the strut. The dimension of the struts is influenced by the process parameters that determine the size of the melt pool but even more by the inclination of the strut in the designed structure [80]. In fact, inclined struts lean on loose powder with a lower thermal conductivity, and consequently, the struts orthogonal to the building direction are the most affect-ed ones [80]. Nonetheless, the top-facing surfaces of the struts are also affected by this phenomenon, but in a less critical way [41]. Another factor influencing the strut size is the staircase effect, typical of the layer-by-layer fabrication processes [30]. These phenomena are crucial for the success of a lattice struc-ture printing and therefore must be taken into account during the design phase.
The majority of the printers used in the scientific papers included in this review are developed from four companies that held almost the 60% of the total amount of available printers. The most used printers and related companies are listed in Table1.
The process parameters used to fabricate lattice structures differ widely from a paper to another, even considering the same material. This, in addition to the great variety of cell geometries and dimensions and structure porosity and orien-tation, makes the comparison of different studies ambitious.
3 Mechanical characterization
In this section, the testing parameters and outputs of the me-chanical characterization of lattice structures will be analyzed. The most significant data have been reported in the following tables. The tables have been designed in order to correlate the material, the cell geometry of the samples, and the character-ization parameters to allow a comprehensive comparison be-tween the analyzed researches. Moreover, the tables contain details about any type of further design configurations and treatments applied that may have a direct influence on the mechanical performances. Moreover, the test parameters and the main outputs of the mechanical tests have been reported in
order to allow a direct comparison between the test design and the relative outputs, in the absence of a dedicated standard to unify the testing of the lattice mechanical performances. Finally, the most significant curves are graphically reported in order to show the main trends characterizing the behavior of lattice structures subjected to compression, tensile, bending, and fatigue tests.
3.1 Compression tests
The compression test is the most used one to characterize lattice structures due to the majority of their applications where the structures are subjected to this type of load. For example, in the biomedical industry, the compression perfor-mance of implants, together with the fatigue life and biocom-patibility, is the key factor for selecting the right material. The reference standard, although not specific for additive manufacturing specimens, is the ISO 13314—compression test for porous and cellular metals [30]. This standard is spe-cific for a sample with a porosity higher than 50%. The cross section of the specimen can be either cylindrical or rectangular although the cylindrical one is recommended. The dimensions of the specimen, diameter and height in the case of cylindrical samples and length, width, and height in the case of a rectan-gular geometry, should be set at least 10 times the average pore size and over 10 mm in length. The ratio between the height and the diameter, or the edge length, should be between 1 and 2. The crosshead speed of the test should be kept con-stant, and it should be set to obtain an initial strain rate be-tween 10−3and 10−2s−1.
The data collected from the reviewed papers are shown in the tables below according to the materials used. Table 2
shows the material, geometry, process design, and compres-sion parameters for titanium samples.
Table3shows the material, geometry, process design, and compression parameters for steel samples.
Table4shows the material, geometry, process design, and compression parameters for CoCr samples.
Table5shows the material, geometry, process design, and compression parameters for aluminum and Inconel samples.
The reported works have different purposes and demon-strate different results. Several researches compare the me-chanical properties and deformation behavior of different cell geometries subjected to the same loads. For example, Kohnen et al. [81] found that the face-centered cubic geometry with vertical struts (FCCZ) has higher strength and elastic modulus than the hollow spherical geometry, making it suitable for structural components. On the other hand, Choy discovered that honeycomb cells have better mechanical performances than cubic cells, with higher space efficiency [82, 83]. Furthermore, Leary concluded that the face-and-body-centered geometry with vertical struts (FBCCZ) has the highest absolute values of strength and modulus [84] while
Table 1 Companies and printers most cited in the reviewed works
Company Printers Ref.
3D systems ProX 200 ProX 300 ProX 320 [8,111] [122] [90,97,100,102,103,106,125] SLM solution SLM 250 HL SLM 280 HL [82,83,85,95,99,101,117] [81,121] EOS M 270 M 280 M 290 [91] [88,104,128] [111,128] Renishaw AM 250 AM 400 [98,116,120] [13,115]
Table 2 D ata co lle cte d fr om the compr es sion te sts o f ti tani u m sa m pl es Re f. Ma te ria l Ce ll Proc ess d es ign T es t p ar amete rs O ut put Va lues [ 82 ] T i- 6Al-4V Cu bic Hone yc omb Gr ad ed Cell orientations 10 0 k N lo ad cell Strain rate 0.05/mi n Qua si-el ast ic g ra die n t (GP a) Elastic gradient (GPa) Fir st m ax im um co m p re ssive st re ngth (M P a) En er gy ab so rp tio n (5 0% st ra in ) (M J/ m 3 ) 2. 5– 14 GPa 0. 5– 14 GPa 64 –69 2 M Pa 19 –20 3 M J/m 3 [ 83 ] T i- 6Al-4V Cu bic Hone yc omb Strut siz es Cell orientations Str ain ra te 0.0 5 pe r m inut e F irs t ma ximu m comp re ssiv e st re ng th (M Pa ) En er gy ab so rp tio n (5 0% st ra in ) (M J/ m 3) 14 –24 4 M Pa 3. 9 4– 77 .52 M J/m 3 [ 89 ] C P-Ti grade 1 Gyroid Cell si zes Compress ion d irections 50 k N loa d cell Strain rate 10 − 3 s − 1 E( M P a) Yield str en g th (MP a) 1 465 –26 80 MPa 45 –57 M P a [ 90 ] T i- 6Al-4V Diam ond Sa mple or ie nta tion s HI P (92 0 °C, 1 000 b ar , 2 h ) 30 k N loa d cell Co ns tan t dis p la ce me nt ra te 0 .9 m m/m in Qua si-el ast ic g ra die n t (GP a) Firs t m ax imu m st re ss (M Pa) En er gy ab so rp tio n (3 0% st ra in ) (M J/ m 3 ) 3. 2– 5.4 G Pa 91 .2 –13 3.9 M Pa 5. 4– 27. 4 M J/m 3 [ 91 ] T i-6Al-4V Pi llar texti le He at tre at me nt (650 °C , 2 h) cells si zes 20 0 k N lo ad cell Constant speed 0 .5 mm/min Comp ressiv e p eak st ress (M Pa) Comp ressiv e coll ap se st ress (M Pa) 13 0– 310 M P a 18 –80 M P a [ 93 ] C ommerci all y p ure porous titanium (C PPTi) B C C C ell siz es Compress ion d irections 10 0 0 kN lo ad ce ll Lo adi n g rat e 0 .5 mm/ min Co m p re ss ion loa d (at 4 0 % ) (N) 49 –8 048 N [ 95 ] H om e-ma de Ti –tan talu m p o w de r C ustom -ma de Prin ting p ara m eter s 5 0 k N loa d cell Constant speed 0 .6 mm/min Elastic const ant (GPa) Yield str en g th (MP a) 1. 3 6– 6. 82 GPa 25 –42 0 M Pa [ 97 ] T i-6Al-4V Gyroid Cell si zes Shee t size s P roce ss p ar am et er s 50 k N loa d cell (+ 1 00 k N ) Dis p la ce me nt ra te 1 m m/mi n Ap pa re nt E (GPa ) Yield str en g th (MP a) Ulti mat e compressi ve st rength (MPa) 3– 16 .9 GPa 42 .1 –23 6 M Pa 50 .9 –34 5 M Pa [ 99 ] T i- 6Al-4V Se lf -de si gne d H IP (1 0 0 0 °C, 150 M P a, 1 h ) C om pre ss ion ra te 0 .12 5 mm/m in C omp re ssiv e y iel d str ength (M P a) 1 0 0– 143 M P a [ 10 1 ] T i- 6Al-4V BCC H ea t tr ea tme n t (1 050 °C ,v ac uum ,2 h ) 1 5 kN lo ad ce ll Dis p lacement rate 10 μ m/ s= st rain rate 10 − 3s − 1 Gra p h ica lly re po rte d [ 10 3 ] T i- 6Al-4V Diam ond He at tre at me nt Et ched 30 k N loa d cell Con sta nt st ra in ra te 0. 9 mm/ min Qua si-el ast ic g ra die n t (GP a) Yield str ess (M P a) Ma xim u m stre ss (MP a) 4. 3– 6.5 G Pa 79 .1 –11 8.9 M Pa 88 .6 –14 6.8 M Pa [ 10 4 ] T i- 6Al-4V Diam ond Vo lum e fr ac ti ons To pol ogic al opt imiz at ion He at tre at me nt (650 °C , 3 h) 10 0 k N lo ad cell Constant speed 2 mm/mi n E( M P a) Comp ressiv e p eak st ress (M Pa) 34 –1 403 M P a 2– 78 M P a [ 10 6 ] T i-6Al-4V Primi tive I-WP Gyroid Diam ond Sh ee t size s 10 0 k N lo ad cell De fo rm ati o n rate 1 0 − 2 s − 1 =1 .2 m m /m in Qua si-el ast ic g ra die n t (GP a) Yield str ess (M P a) 3. 2– 6.4 G Pa 92 –27 6 M Pa [ 10 7 ] T ita ni um Octa he dr on Ra nd om Heat tr eatm en t (1 4 0 0 °C, 3 h ) Ra ndo miz at ion Spe ed 1 mm/ min S tre n g th (MPa) Stiffness (GPa) 36 .7 –56 .4 MPa 2– 6. 5 G Pa [ 10 8 ] T i- 6Al-4V Re gu lar Ir re gul ar Ra nd om Heat tr eatm en t Ra ndo miz at ion Void si zes Strut siz es Dis p la ce me nt ra te 2 m m/mi n E (GPa ) Of fset co m p re ssive str en g th (MP a) 1– 16 GPa 70 –40 0 M Pa
the FCCZ geometry has the best specific strength and modu-lus compared to other samples [85]. Furthermore, the BBC geometry has been reported to have higher equivalent strength and specific strength than crossing rod unit cell [86], while crossing rod presents higher ultimate and yield strength than circular unit cell [87]. Topological optimization leads usually to cell geometries that often result in improved mechanical performances [88]. For example, Cao et al. [13] introduced a shape parameter in the cross section of the strut that resulted in an increase of the compressive modulus and of the initial yield strength by 79% and 55%, respectively. Some non-isotropic geometries, characterized by struts placed only in certain di-rections, have been studied to evaluate the effect of different orientations of print of both the whole specimen and the cell. Yan et al. [12] found that gyroid structures with struts at 0 and 90° in relation to the building direction offer better mechanical properties than the traditional ones with the struts oriented at 45°. On the other hand, Ataee et al. [89] did not find any influence of the sample orientation on the compression prop-erties of gyroid scaffolds. Besides, Cutolo et al. [90] reported that the load direction in relation to the unit cell orientation has a great effect on the properties of diamond structures, finding an optimal orientation to obtain the strongest samples. Rather than the geometry, some researchers focus on the effect of changing the porosity and volume fraction of the cell by vary-ing the strut dimensions and cell sizes. For example, Campanelli et al. [91] and Amani et al. [92] both found that an increase in volume fraction, or relative density, results in increased mechanical properties. Similar results were achieved by Mager et al. [93] and Ibrahim et al. [94] that recorded a decrease in the compression load and the effective modulus with the increase of the cell size. The printing param-eters influence the mechanical properties of lattice structures. Sing et al. [95] and Zhong et al. [96] found that an increase of laser power results in increased mechanical properties. Differently, Kelly [97] did not find great changes on the me-chanical properties with refined and optimized parameters. The PBF-LB process can lead to complications such as unde-sired porosities, defect formation, and residual stresses. Heat treatment and chemical etching have been studied to reduce these issues. Many scientists [98–101] found that a heat treat-ment reduces the strength of the samples and increases the ductility. On the other hand, Van Hooreweder et al. [102] reported that chemical etching has no influence on mechanical properties while, in another paper, Van Hooreweder et al. [103] found that the different densities of the samples have a strong influence on the mechanical properties making the study of the heat treatment and chemical etching effects hard. Several analyzed works in the biomedical field aimed to ob-tain structures with properties similar to the natural bones reaching good results [7,104–106]. For example, cellular ran-domization techniques have been tested to study their effect on bone ingrowth and mechanical properties. Mullen et al.
Tabl e 2 (continu ed) Re f. Ma te ria l Ce ll Proc ess d es ign T es t p ar amete rs O ut put Va lues [ 10 9 ] T i- 6Al-4V Rh omb ic dod ec ah ed ro n Gr ad ed Heat tr eatm en t (6 0 0– 85 0 °C, 2– 4 h ; fu rna ce cool ing; 70 0– 900 °C, 2 h ) Strain rate 10 − 3s − 1 Initial collaps e st rengt h (MPa) Ne ar ly pl ate au str es s (M Pa ) Densificati o n strain (%) 40 M P a circ a 3 5 M Pa ci rc a 65% [ 11 0 ] T i-6Al-4V Gyroid Primi tive Gr ad ed 1 0 0 k N load ce ll Strain rate 2 mm/min E( M P a) Yield str en g th (MP a) Pe ak str en g th (MP a) En er gy ab so rp tio n (M J/ m 3) 1 188 –16 99 MPa 29 .8 –62 .1 MPa 33 .1 –77 .1 MPa 31 –54 M J/m 3 [ 12 7 ] T i- 6Al-4V Cu bic S tr ut si ze s Cell siz es Heat tr eatm en t Ul trasonic cleaning 10 0 k N lo ad cell Spee d 2 5 m m/min E( M P a) Stiffness (N/mm) 1 810 –25 98 MPa 56 –79 N/m m [ 12 8 ] T i-6Al-4V BCC FCC-BCC Dens ities He at tre at me nt (750 °C , 2 h) Co mp re ss io n rate 1 mm /m in Eq ui valent elas tic modulus (MPa) Ulti mat e compressi ve st rength (MPa) 25 –2 800 M P a 1. 6– 156 M P a
Table 3 D ata co lle cte d fr om the compr es sion te sts o f st eel sa mp les Re f. Ma ter ia l Cell Pro ces s d es ign T es t p ar amet ers O ut put Va lues [ 7 ] 316L Cubic -Initial strain rate 1 0 − 3 s − 1 E( G P a) Yi eld st reng th (M P a) 0.15 GPa 3.01 MPa [ 12 ] 316L Gyroid Cell orientations 20 kN load cell Constant speed 0 .4 mm/min E( M P a) Yi eld st reng th (M P a) 250 –300 MPa 14 –15.5 M P a [ 13 ] 316L Rhomb ic-dodecahedron Topologi cal optimization 3 0 k N load cell Const ant spe ed 0 .9 mm/min = str ain rate of 0.0005 s − 1 E( M P a) In itia l y ie ld str ength (MPa ) E n er gy abs o rp ti on (J ) Spe cif ic en er gy ab sor p tion (kJ/kg) 110 –1140 MPa 3– 25 MPa 40 –360 J 3– 11 kJ /kg [ 81 ] 14404 SS FCCZ Hollow spherical Heat treatment (900 °C, 1 h) 400 kN load cell Constant strain rate 10 − 3 s − 1 E( G P a) Spe cif ic en er gy ab sor p tion af te r 40% st ra in (J /g) 6.8 –11 GP a 12.1 –26 J/g [ 86 ] 316L CoC r Simple cubic Cros sing rod BCC -100 kN load cell St ra in ra te 10 − 3 s − 1 Cross-h ead se parati on rat e 1 m m/min Equ ivalent strength (MPa) Stiffness m odulus (GPa) 25 –175 MPa 8– 55 GPa [ 88 ] 316L FCC Vert ex cube Edge-centered cube Por o siti es Topological optimization 100 kN load cell Constant speed 1 mm/min E (MPa) 240 –3000 MPa [ 94 ] 316L Hexagon-honeycomb C ell sizes Interr upted load ing E ffective E (GPa) 1.6 –8.6 G Pa [ 96 ] 316L Tetrakaid ecahedron Diamond BCC P roc es s p ar am et er s Strut siz es Volume fr ac ti ons Deformation rate/speed o f loading 6 m m/ min E( M P a) Yi eld st reng th (M P a) 20 –1810 MPa 1.66 –81 MP a [ 112 ] 316L BCC Graded Comp: speed 1 m m/s G raphically reported [ 126 ] C L5 0WC powder 18 Ni Marage 300 Pill ar te xti le C el l size s 250 kN lo ad ce ll Constant speed 0 .5 mm/min Pe ak stress (MPa ) 9 7– 206 MPa [ 124 ] 316L BCC BCCz Cel l orie nta tions Di splac ement ra te 1 m m/min Y ie ld st reng th (M Pa) 0 .4 –1.4 M Pa
Table 4 Data collected from the compres sion tests o f C oCr samples Re f. Ma ter ial Cel l Pr oce ss d esig n T es t p ar amet er s O utput Va lue s [ 86 ] 316L CoCr Simple cubic Crossing rod BCC -100 kN load cell St ra in ra te 10 − 3s − 1 Cross-head separation rate 1 m m/min Equivalent strength (MPa) Stiffness m odulus (GPa) 25 –175 MPa 8– 55 GPa [ 87 ] C oCr (Pr axai r) Cir cul ar Crossing rod -S tr ai n rat e 1 0 − 3s − 1 E( G P a) Y ie lds tr en g th( M P a) Ult ima te co mpr ess ive str eng th (M P a) 33 –34 GPa 70 –110 MPa 235 –365 MPa [ 100 ] C oCrF75 (A), LaserForm D iamond HIP (1200 °C, 1000 bar, 4 h ) Et che d Layer thickn ess Constant dis p lacement rate o f 0.9 mm/ min. Quas i-elastic gradient (GPa) Offse t stress (0 .2%) (MPa ) Fir st m ax im um st res s (M Pa) 1.37 –2.34 GPa 22.42 –41.62 MPa 35.6 –62.8 M Pa [ 102 ] C oCr F 7 5 Diamond Etched Sample dime nsion s 30 kN load cell Constant strain rata 0.9 mm/min Quas i-e la stic gr adi ent (G Pa ) Yield stress (0.2%) (MPa) M ax im u ss tr es s( M P a) 2.2 –3.4 G Pa 53 –74 MPa 76 –116.3 M Pa [ 105 ] C oCr (ASTM F75) Pillar octahedral Strut sizes Gr ade d Heat treatment (12 00 °C , 2 h) 300 kN Load cell Loa d ing rate 2 mm/min E( G P a) Yield strength (0.2%) (MP a) Ult ima te co mpr ess ive str eng th (M P a) 2.3 –3.14 GPa 36 –130 MPa 113 –5523 MPa Table 5 Da ta co lle cte d fr om the compr essi on test s o f o the r me tal s sample s R ef. M at er ial C ell P roc es s d es ig n T es t p ar am et er s O ut put Va lu es [ 84 ] A l-Si12-Mg BCC FCC BCCZ FCCZ FBCCZ – St ra in ra te 10 − 3 s − 1 E( M P a) S trength (MPa) V o lumetr ic en er gy ab sor p tion u p to co mpr ess ive str engt h (MJ /m 3 ) 130 –950 MP a 4– 20 MPa 0.03 –0.14 MJ/m 3 [ 92 ] A l-Si10-Mg FCC S truts sizes 5 k N load cell Spe ed 0 .0 01 mm/s E( G P a) Yield strength (MPa) U ltimat e compre ssi ve str ength (MPa ) 0.5 –1.77 GPa 3.2 –7.5 M Pa 5.3 –13.3 M Pa [ 98 ] A l-Si10-Mg BCC Graded Heat treatment (520 °C , 1 h; quench; 160 °C, 6 h) 50 k N load ce ll Displacement rate 0.03 mm/s E( G P a) E n er gy ab sor p tion (MJ/ m 3 ) 0.64 GP a 5 .7 –6.3 M J/m 3 [ 111 ] A l-Si 12 F2BCC Gr ade d 50 k N load ce ll St ra in ra te 0.00 5 m m /s E× 1 0 − 2(G Pa ) E n er gy ab sor p tion (MJ/ m 3) 0.5 –0.7 2.6 –3.2 M J/m 3 [ 85 ] Inc o n el 6 25 B C C FCC BCCZ FCCZ C ell si ze s S tr ai n rat e 1 0 − 3 s − 1 E( M P a) Yield strength (MPa) 25 –23 0 M P a 0.5 –18 MPa
[107] found that a certain level of randomization can improve the mechanical properties reducing the fault planes typical of cellular structures while Raghavendra et al. [108] reported lower values of offset compressive strength and Young mod-ulus for fully random structures. Finally, graded lattice struc-tures have been reported to have better energy absorption capacities [109–111] and higher rate of densification [112].
Examples of resulting compression curves are shown in Fig.4. The curves show different shapes based on the defor-mation mechanism that governs the cell. Bending-dominated structures show an elastic region reaching a linear plateau followed by a sudden rise of stress and force values due to densification (Fig.4a). The stretch-dominated structures pres-ent an elastic region culminating in a peak and followed by a wavy post-yielding plateau prior to densification (Fig.4b, c) [113]. Figure4ashows the compression curves of 316L BCC samples with different graded patterns. The general trend is the same for all curves with some small differences. In partic-ular, adding a gradient to the structure increases the relative density resulting in a shorter plateau and in an increased com-pression force. In fact, the gradient increasing pattern results in higher deformation force and energy. Figure4bshows the compression curves of Ti-6Al-4V primitive samples with
different porosities (ϕ). As shown, both the yield stress and the plateau stress increase as the porosity decreases. Also, by decreasing the porosity, the plateau becomes shorter and wav-ier. This waviness is generated by the development of shear lines and built-up stresses. Finally, Fig.4cshows the compres-sion curves of Ti-6Al-4V vertically oriented cubic cell sam-ples with different strut sizes. Smaller strut sizes lead to higher porosity resulting in a lower yield and plateau stress. By de-creasing the porosity, the samples become more brittle resulting in deeper peaks and valleys shortening the plateau region followed by densification.
In conclusion, the most used load cells ranged from 5 to 400 kN, an indication that the mechanical properties of lattice structures can vary depending on the material, geometry, cell size, and density. The speed of the moving crossbar is kept generally very low (mm/min), leading to a low strain rate as suggested by the ISO 13314 standard. The low strain rate is also suggested to allow the image acquisition to efficiently capture the deformation mechanisms. The most reported, and thus significant, outputs are the compressive Young mod-ulus, the quasi-elastic gradient, and the yield stress. Moreover, the energy absorption is also often crucial due to the applica-tion of lattice structures as impact absorber.
Fig. 4 Compression curves ofa 316L BCC samples with different graded patterns [112].b Ti-6Al-4V primitive samples with different levels of porosity
Table 6 Data collected from the tensile tests of titanium samples
Ref. Material Cell Process design Test parameters Output Values
[97] Ti-6Al-4V Gyroid Cell sizes
Sheet sizes Process parameters
50 kN load cell (+100 kN) Displacement rate 1 mm/min
Apparent tensile E (GPa) Ultimate tensile strength (MPa) 1.9–17.6 GPa 23.9–121.1 MPa
[101] Ti-6Al-4V BCC Heat treatment (1050 °C,
vacuum, 2 h) 15 kN load cell Displacement rate 10μm/s= strain rate 10−3s−1 Graphically reported [107] Titanium Octahedron Random Heat treatment (1400 °C, 3 h)
Two levels of randomization
Speed 1 mm/min Tensile strength (MPa) 30.7–49.5 MPa
[108] Ti-6Al-4V Simple cubic?
Regular Irregular Random Heat treatment Randomization Void sizes Strut sizes
Displacement rate 2 mm/min E (GPa) Ultimate tensile
strength (MPa)
5–45 GPa
50–275 MPa
[116] Ti-6Al-4V BCC Cell sizes
Sample dimensions Heat treatment (600 °C, 3 h)
Strain rate 0.01 mm/s E (GPa)
Ultimate tensile strength (MPa)
7–20 GPa
55–189 MPa
[118] Ti-6Al-4V Diamond HIP (920 °C, 1000 bar, 2 h)
Surface treatment (SILC cleaning)
Displacement rate 1 mm/min Tensile E (GPa) Tensile yield strength
(MPa) Ultimate tensile strength (MPa) 10.4–14.1 GPa 146.6–152 MPa 194.9–195.5 MPa [119] CP-Ti grade 2
Custom made Sample dimensions
Sample orientations
Constant strain rate 10−3s−1 E (GPa)
Yield stress (MPa) Ultimate tensile
strength (MPa)
1.5–3.7 GPa 96.2–133.3 MPa 129.8–143.6 MPa
[120] Ti-6Al-4V Cubic Heat treatment
Eurocoating
Crosshead speed: 1 mm/min E (GPa)
Yield strength (MPa)
12.8 GPa 65 MPa
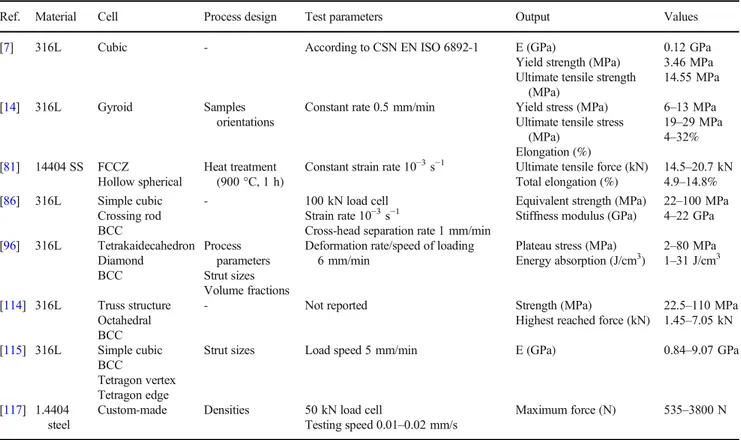
Table 7 Data collected from the tensile tests of steel samples
Ref. Material Cell Process design Test parameters Output Values
[7] 316L Cubic - According to CSN EN ISO 6892-1 E (GPa)
Yield strength (MPa) Ultimate tensile strength
(MPa) 0.12 GPa 3.46 MPa 14.55 MPa [14] 316L Gyroid Samples orientations
Constant rate 0.5 mm/min Yield stress (MPa)
Ultimate tensile stress (MPa) Elongation (%) 6–13 MPa 19–29 MPa 4–32% [81] 14404 SS FCCZ Hollow spherical Heat treatment (900 °C, 1 h)
Constant strain rate 10−3s−1 Ultimate tensile force (kN)
Total elongation (%) 14.5–20.7 kN 4.9–14.8% [86] 316L Simple cubic Crossing rod BCC - 100 kN load cell Strain rate 10−3s−1
Cross-head separation rate 1 mm/min
Equivalent strength (MPa) Stiffness modulus (GPa)
22–100 MPa 4–22 GPa [96] 316L Tetrakaidecahedron Diamond BCC Process parameters Strut sizes Volume fractions
Deformation rate/speed of loading 6 mm/min
Plateau stress (MPa)
Energy absorption (J/cm3) 2–80 MPa 1–31 J/cm3 [114] 316L Truss structure Octahedral BCC
- Not reported Strength (MPa)
Highest reached force (kN)
22.5–110 MPa 1.45–7.05 kN [115] 316L Simple cubic BCC Tetragon vertex Tetragon edge
Strut sizes Load speed 5 mm/min E (GPa) 0.84–9.07 GPa
[117] 1.4404
steel
Custom-made Densities 50 kN load cell
3.2 Tensile test
To date, international standards for tensile tests of porous or cellular structures are yet to be developed. Although some of the test parameters like the low crossbar speed can be set by taking the compression test as an example, other parameters still remain undefined. For example, the size, the geometry, and the minimum number of unit cell per side of the specimen are chosen arbitrarily without any reliable criteria. Moreover, the transition between the lattice section and the extremities of the samples that act as gripping points is not defined. For these reasons, an international standard regarding the tensile test of porous and cellular structures can lead to more uniform and reliable information. The most reported output of the tensile test is the tensile Young modulus together with the yield stress and ultimate tensile strength. The analyzed data are reported in different tables divided by the target material: Table6 for titanium, Table7for steel, and Table8for other metals.
Table6shows the material, geometry, process design, ten-sile parameters, and results for titanium samples.
Table7shows the material, geometry, process design, ten-sile parameters, and results for steel samples.
Table8shows the material, geometry, process design, ten-sile parameters, and results for other metals samples.
One of the main focuses of the evaluated works is the comparison of the performance of different geometries sub-jected to the tensile test. For example, Kohen et al. [81] re-ported, as in the case of compression, higher maximum tensile strength in the FCCZ geometry than in the hollow spherical geometry. Liverani et al. [86] compared the BCC, the crossing rod, and the simple cubic geometries, and the crossing rod geometry showed the highest specific strength and stiffness under tension. Again, Kessler et al. [114] reported a higher tensile strength in the truss structure geometry than in the octahedral or BCC geometries. Zhong et al. [96] studied the tensile properties of samples with different geometries and the same volume fraction; the tetrahedral geometry showed a higher ultimate tensile strength than the diamond and BCC geometries. Finally, Hajinys et al. [115] compared the tensile properties of different geometries with three different strut sizes, and the tetragon vertex unit cell with a strut diameter of 0.7 mm resulted in the stiffest combination. The influence of the cell’s parameters is also investigated by several authors. For example, Maskery et al. [116] tested BCC samples with two different cell dimensions and reported that the smallest cell size can maximize the stiffness of the sample. Kelly et al. [97] instead studied gyroid samples with different wall and cell sizes and noted that these two variables have a direct
Table 8 Data collected from the tensile tests of other metal samples
Ref. Material Cell Process design Test parameters Output Values
[87] CoCr (Praxair) Circular
Crossing rod
- Not reported E (GPa)
Yield strength (MPa) Ultimate tensile strength (MPa)
21–27 GPa
75–110 MPa
80–150 MPa
[121] Al-Si10-Mg Triangular prism
Square prism Hexagonal prism
Cell sizes 250 kN load cell
Deformation rate 1 mm/min
Tensile effective E (GPa) 3.4–9.8 GPa
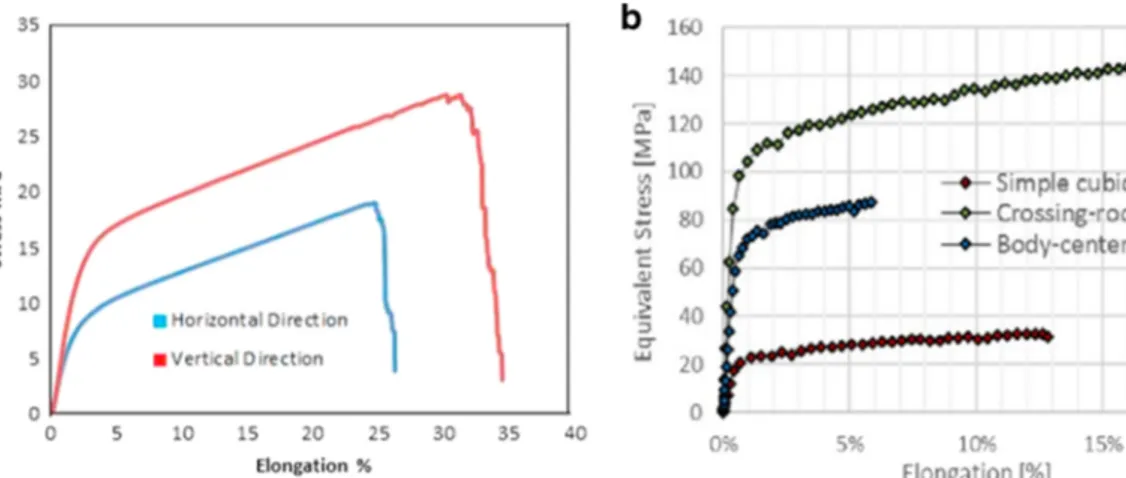
Fig. 5 Tensile curves of 316L samples witha gyroid unit cell and
different building orientations in relation to the building platform. The horizontal direction has the axis parallel to the building platform; the
vertical direction has the axis perpendicular to the building platform
and interdependent impact on the mechanical properties, de-termining the overall porosity of the sample. Similar results were reported by Lober et al. [117] who underlined how the maximum load tolerated by the structure has an exponential dependence from the density. Furthermore, a few works stud-ied the effect of post-processing on the tensile mechanical performances of the lattices. Brenne et al. [101] noted that heat-treated samples bear higher maximum stresses and are able to sustain higher loads, while Kelly et al. [118] found that a surface treatment, such as SILC cleaning, can slightly im-prove the Young modulus of a Ti-6Al-4V diamond lattice. Other researches focused on the sample’s building orientation. For example, Alsalla et al. [14] and Barbas et al. [119] found that vertically built samples have better mechanical tensile properties than horizontal ones. Furthermore, few studies in-vestigated the effect of cell’s randomization reaching contrast-ing results. Muller et al. [107] found that a certain level of randomization improves the mechanical properties while Raghavendra et al. [108] reported regular structures having higher values of strength. Other works tested lattice structures to compare their properties with the natural bone [7,87] or to validate the related FEM simulation [120,121].
Two significant examples of tensile stress-strain curves resulting from testing lattice structures are shown in Fig.5. The presence of a concave elastic region can be a sign of good consolidation and absence of defects [14]. Figure5ashows the tensile curves of 316L gyroid samples with two building ori-entations in relationship to the building platform. The axis of the sample with the horizontal orientation is parallel to the building platform while the axis of the sample with the vertical orientation is perpendicular to the building platform. Both curves represent the same trend with no sign of brittle failure. However, the vertical-oriented sample has enhanced mechan-ical properties with higher yield strength, ultimate tensile strength, and elongation. Figure5bshows the tensile curves of 316L samples with different unit cell geometries. Again, the curves show the same trend with an elastic region followed by a plastic elongation, a sign of a ductile behavior. The crossing-rod geometry seems to show better properties in terms of both strength and elongation. On the other hand, the BCC is stronger than the simple cubic but with lower elongation.
3.3 Bending test
Although not the most studied property, flexural strength is important because in many applications, parts are subjected to this type of load, for example, components for the automotive industry, smart materials, and tissue engineering fields. Bending tests are typically performed in a three-point config-uration with a lower span length between 60 and 80 mm and cylindrically shaped supports. The geometry of the sample is usually rectangular but with a wider range of chosen Tabl
e 9 Data collected from the bending tests Ref . Ma ter ial Ce ll Pr oces s d esign T es t p ar amet er s O utput Va lue s [ 7 ] 316L Cubic -Accordi n g to C S N E N IS O 7 438 E (G P a) Yield strength (MPa) 0.2 G P a 3.82 MPa [ 8 ] A l-Si12 Circular (2D) Tri angular (2D) Hexagon al (2D) -5 0 k N lo ad cel l Span lengt h 7 0 m m Loading rate 1 mm /m in E( G P a) Streng th (MP a) Load at brea k (k N ) 4.3 –5G P a 145 –175 MPa 15.5 –19 kN [ 93 ] C ommerciall y pure porous titani um (CPPTi) BCC C el l si ze s Load di re ct ions 1000 kN load cell Loading rate 0 .5 mm/min Flexu ra l load at tensile strength (N) Extension (mm) 87 –1063 N 1.48 –10 mm [ 94 ] 316L Doub le honeycomb – Interrup ted loading E ffe ct ive E (GPa) 5 .6 GPa [ 101 ] T i-6A l-4V B C C H eat treatment (10 5 0 °C, vacuum, 2 h 15 kN lo ad ce ll Displacement rate 1 0 μ m/s = st rain rate 10 − 3s − 1 Roll diame ter 1 6 m m Upper d is tance 3 5 m m Low er d is tance 7 0 m m Gra p hically re po rted [ 122 ] 17-4 P H (630 SS ) B CC Octet truss Heat treatment (49 0 °C , 4 h) C leaning Graded Low er d is tance 6 0 m m Ini ti al sti ffness (kN/ m m ) M axl o ad( k N ) De fl ec ti on at max lo ad (mm) 9.7 –14.1 k N/ m m 9.7 –14.1 k N 0.98 –1.74 mm [ 123 ] 316L BC C C arbo n fiber skin Displacement rate 4 .2 × 1 0 − 6m /s P eak load (kN) In it ial st iffn es s (k N /mm ) 1.1 k N 1.77 k N /mm [ 124 ] 316L BC C C arbo n fiber skin Displacement rate d a 0 .25 mm/min Low er d is tance 8 0 m m Dia m eter 10 mm L o ad p eak (N ) Platea u load (N) 110 0 N 800 N
dimensions. It is also possible to find a thin layer of full bulk material, called“skin,” on the upper and lower faces of the sample. These types of multilayered structures are often stud-ied for aerospace applications and their blast absorbing capa-bilities. Similarly, to the other type of tests, the displacement rate is kept low. The most reported outputs are the flexural Young modulus, the peak load, and the flexural strength. The data are shown in Table9.
Rashid et al. [8] found that the triangular geometry has both higher flexural strength and modulus compared to the circular and hexagonal geometries. Kang et al. [122] reported that the multilattice model with a relative density of 0.2 showed the highest stiffness and strength. Mager et al. [93] registered a
decrease in the loading force and an increase in the bending extension for bigger cell sizes. Moreover, heat treatment can lead to higher ductility for a Ti-6Al-4V BCC sample with 0.5-mm skin as reported by Brenne et al. [101]. Ibrahim et al. [94] performed the flexural test on a double honeycomb lattice structures finding an effective modulus similar to the one ob-tained from the compression test, suggesting an isotropic be-havior of the structure. Finally, Shen et al. [123,124] studied the skin-core adhesion resistance of multilayered structures under flexural loads.
Two examples of stress-strain curves resulting from lattice structure bending tests are shown in Fig.6. As shown, the stress either reaches a peak followed by a drop almost to 0
Fig. 6 Bending curves ofa Al-Si12 samples with different cell geometries [8] andb 316L BCC sample with carbon skin [124]
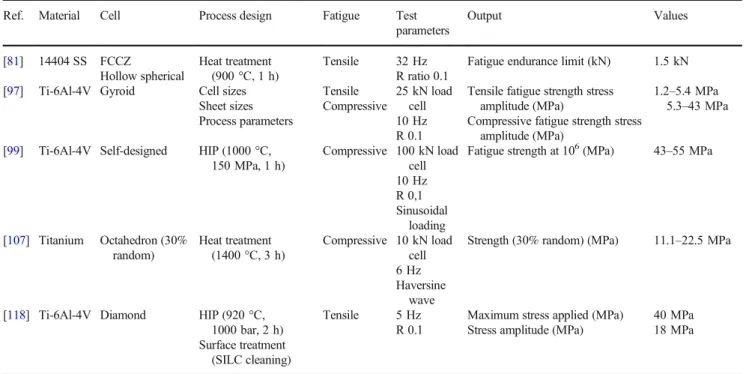
Table 10 Data collected from the fatigue tests
Ref. Material Cell Process design Fatigue Test
parameters Output Values [81] 14404 SS FCCZ Hollow spherical Heat treatment (900 °C, 1 h) Tensile 32 Hz R ratio 0.1
Fatigue endurance limit (kN) 1.5 kN
[97] Ti-6Al-4V Gyroid Cell sizes
Sheet sizes Process parameters Tensile Compressive 25 kN load cell 10 Hz R 0.1
Tensile fatigue strength stress amplitude (MPa)
Compressive fatigue strength stress amplitude (MPa)
1.2–5.4 MPa
5.3–43 MPa
[99] Ti-6Al-4V Self-designed HIP (1000 °C,
150 MPa, 1 h) Compressive 100 kN load cell 10 Hz R 0,1 Sinusoidal loading
Fatigue strength at 106(MPa) 43–55 MPa
[107] Titanium Octahedron (30% random) Heat treatment (1400 °C, 3 h) Compressive 10 kN load cell 6 Hz Haversine wave
Strength (30% random) (MPa) 11.1–22.5 MPa
[118] Ti-6Al-4V Diamond HIP (920 °C,
1000 bar, 2 h) Surface treatment
(SILC cleaning)
Tensile 5 Hz
R 0.1
Maximum stress applied (MPa) Stress amplitude (MPa)
40 MPa 18 MPa
indicating a brittle fracture (Fig.6a) [8] or by a plateau follow-ed by a second increase due to localizfollow-ed compaction (Fig.6b) [124]. Figure5ashows the bending curves of Al-Si12 samples with different unit cell geometries. All geometries’ curves fail in a brittle way, and circular and triangular geometries drop almost to zero, while hexagonal samples fail more gradually. The triangular geometry shows the highest properties while the circular and hexagonal geometries are almost comparable. Figure6bshows the bending curve of a 316L BCC sample with 4 layers of carbon fiber–reinforced plastic (CFRP) as skin. The curve represents a more ductile behavior with an elastic region culminating in a peak, a drop, and an almost linear plateau. Despite the fact that no delamination of the carbon skin was observed after the application of the bending stress, it seems that the CFRP is not influencing the mechan-ical response of the BCCs.
3.4 Fatigue test
The fatigue tests can be carried out under any stress condition: traction, compression, and bending. The most commonly used is the fatigue test under compression because, as already stated
above, several applications are subjected to this type of load. Fatigue performances are very important in the biomedical and aerospace fields where the limits associated with a cyclic loading are very strict [113]. Usually, the shape and size of the specimen follow the same rules as the static tests. The process parameters are quite similar within the considered papers; for example, the load is sinusoidal, the R is 0.1, and the number of cycles reaches 106. The frequencies vary in a range between 5 and 32 Hz, with 10 and 15 Hz being the most frequent. The data are shown in Table10and Table11.
As in the cases of compression and traction, and also for the fatigue test, Khonen et al. [81] reported better performances for the FCCZ geometry compared to hol-low spherical geometry, failing to a higher load for the same number of cycles. Both Wu et al. [99] and Mullen et al. [107] noted an increase of the fatigue perfor-mances after heat treatment of Ti-6Al-4V self-design unit cell and gyroid unit cell, respectively. On the other hand, Kelly et al. [97, 118] reported an increased fa-tigue life of a gyroid unit cell after process parameter optimization while no effect was observed by the same authors for a diamond cell after surface treatment.
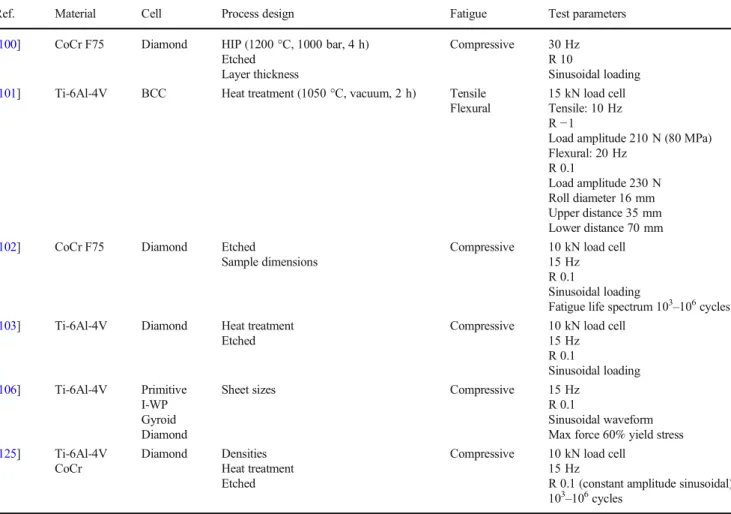
Table 11 Data collected from the fatigue tests that reported output only in graphical form
Ref. Material Cell Process design Fatigue Test parameters
[100] CoCr F75 Diamond HIP (1200 °C, 1000 bar, 4 h)
Etched Layer thickness
Compressive 30 Hz
R 10
Sinusoidal loading
[101] Ti-6Al-4V BCC Heat treatment (1050 °C, vacuum, 2 h) Tensile
Flexural
15 kN load cell Tensile: 10 Hz
R−1
Load amplitude 210 N (80 MPa) Flexural: 20 Hz R 0.1 Load amplitude 230 N Roll diameter 16 mm Upper distance 35 mm Lower distance 70 mm
[102] CoCr F75 Diamond Etched
Sample dimensions
Compressive 10 kN load cell
15 Hz R 0.1
Sinusoidal loading
Fatigue life spectrum 103–106cycles
[103] Ti-6Al-4V Diamond Heat treatment
Etched
Compressive 10 kN load cell
15 Hz R 0.1 Sinusoidal loading [106] Ti-6Al-4V Primitive I-WP Gyroid Diamond
Sheet sizes Compressive 15 Hz
R 0.1
Sinusoidal waveform Max force 60% yield stress
[125] Ti-6Al-4V
CoCr
Diamond Densities
Heat treatment Etched
Compressive 10 kN load cell
15 Hz
R 0.1 (constant amplitude sinusoidal)
Fatigue properties are not very suitable for a numerical and tabular representation, so many of the works reported the re-sults only in graphical form. Van Hooreweder et al. [102,103,
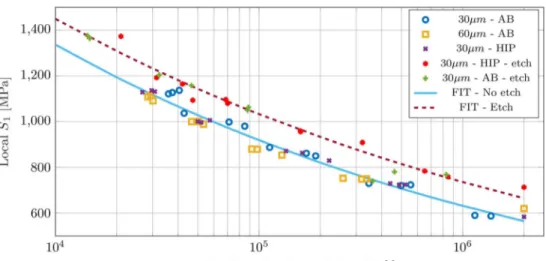
125] studied the fatigue properties (using a local method) of Ti-6Al-4V diamond unit cell samples subjected to hot isostatic pressing (HIP) followed by chemical etching. The study shows that the fatigue life is improved by the HIP treatment, but an even better result is achieved when chemical etching is added (Fig.7).
On the other hand, Cutolo et al. [100] reported an increase of the fatigue performances of chemically etched CoCr sam-ples on a local scale (Fig.8), while the HIP treatment seemed to be ineffective.
Brenne et al. [101] reported an improved fatigue life in Ti-6Al-4V samples after heat treatment with a significant in-crease in the number of cycles to failure at the same displace-ment amplitude (Fig.9).
Bobbert et al. [106] studied the influence of apparent den-sity of various triply periodic minimal surface geometries (Fig.10) on the fatigue properties of the samples. There are different trends as the apparent density increases. The perfor-mance of the primitive geometry increases as the apparent density increases, although this design results in the shortest fatigue life. The gyroid geometry shows a performance de-crease as the apparent density inde-creases, probably due to the geometry of the unit cell. The fatigue life of the I-WP geom-etry significantly increases with the increase of the apparent density, achieving high performances. Finally, the diamond geometry reaches the highest fatigue life with the lowest ap-parent density while for the other values, the results are comparable.
4 Conclusion
PBF-LB is an additive manufacturing powder bed fusion system for the production of lattice structures. Lattice structures have been intensively studied due to their low weight, good mechanical properties, and energy ab-sorption capabilities that make them suitable in fields such as aerospace, automotive, and biomedicine. Despite the increasing interest in these types of structures nowadays, the lack of a specified international standard regarding their characterizations forces the researchers to rely on literature or on their experience. The introduction of an international standard would be very useful not only to provide a common procedure that would allow
Fig. 8 Effect of heat and surface treatment on the fatigue performance of CoCr samples. AB are as-built samples, HIP are hot isostatically pressed samples, and etch are chemically etched samples. The values 30 and
60μm are the layer thicknesses
[100]
Fig. 7 Effect of heat and surface treatment on the fatigue performance of Ti-6Al-4V samples. AB are as-built samples with low (L) and high (H) relative density, HIP are hot isostatically pressed samples, and CE are
the comparison of results but also to certify the possible applications, without leaving the outcomes only to re-search purposes. This review merged a large number of data concerning the production and testing of lattice structures. It gives a wide perspective on all the variables that must be taken into consideration when dealing with these types of structures. Furthermore, it gathers the pa-rameters used by AM researchers to test lattice samples, providing a possible guideline to scientists and industries with different goals in the AM sector. The novelty of this review lays in the collection of a large number of data on the mechanical characterization of lattice
structures to understand the presence of methodologies used transversely by various researchers, the outputs that are most collected, and the target applications of the works focused on lattice structures. In addition, various information such as material, cell geometry, and process design have been collected in order to relate them to the test results. The main considerations are the following: – Many researchers followed the ISO 13314—compression
test for porous and cellular metals—for the compression test. Although it is not specific for additive manufacturing s a m p l e s , i t p r o v i d e s g o o d g u i d e l i n e s f o r t h e
Fig. 10 Effect of different apparent densities on the fatigue performance of triply periodic minimal surface Ti-6Al-4V samples. The squares in the graphs
mean the samples reached 106cycles without failing [106]
Fig. 9 Effect of heat treatment on the fatigue performance of
characterization of lattice structures (i.e., the geometry of the sample with related proportions and recommended strain rate).
– The geometry of the samples chosen for tensile and bend-ing varies arbitrarily: cyclic samples follow the shape of the quasi-static tests. In this case, the strain rate is kept low, probably inspired by the compression tests. – The most reported output for the quasi-static tests is the
Young modulus, the yield stress, and the ultimate stress, while for the fatigue test, the graphical representation is preferred and often the quantitative data are not reported. – Different variables have been taken into account for the production of lattice structures: geometry, dimensions, and post-production treatments. Therefore, several works stud-ied their influence on the mechanical properties of different samples. A complete knowledge of these factors is funda-mental to understanding the full potential of these structures. – It can be noted that an increase in sample density leads to an increase in the main mechanical properties. Further methods used to expand the range of obtainable values are heat treatment and grading of the sample, techniques that are quite effective on properties such as ductility and energy absorption.
The most common test parameters and outputs for every test used in the reviewed literature are listed in Table12.
This data can be considered a starting point for a future study aiming to develop a new standard method. The presented test parameters are all similar because they are inspired by the com-pression tests, but this strategy is not necessarily optimal for each type of test which can have a very different goal from the others. An additional point to focus on is the size and proportions of the samples, at the moment too different from each other and there-fore with a different effect on the final result.
To conclude, the authors highlight that the number of works focusing on the tensile, bending, and fatigue tests is relatively
low compared to the ones focusing on the compression tests. A bigger number of studies are therefore needed to put a more solid base to allow a necessary comparison between different studies. Moreover, the authors suggest a critical evaluation of the me-chanical test parameters to demonstrate their effectiveness and usefulness for the characterization of lattice structures and iden-tify any possible modification to make the parameters more func-tional based on the final application.
Code availability Not applicable.
Funding Open Access funding provided by Università degli Studi di Brescia.
Data availability Not applicable.
Declarations
Fundings This research did not receive any specific grant from funding
agencies in the public, commercial, or not-for-profit sectors.
Conflict of interest The authors declare no conflict of interest.
Availability of data and material Not applicable.
Code availability Not applicable.
Open Access This article is licensed under a Creative Commons
Attribution 4.0 International License, which permits use, sharing, adap-tation, distribution and reproduction in any medium or format, as long as you give appropriate credit to the original author(s) and the source, pro-vide a link to the Creative Commons licence, and indicate if changes were made. The images or other third party material in this article are included in the article's Creative Commons licence, unless indicated otherwise in a credit line to the material. If material is not included in the article's Creative Commons licence and your intended use is not permitted by statutory regulation or exceeds the permitted use, you will need to obtain permission directly from the copyright holder. To view a copy of this
licence, visithttp://creativecommons.org/licenses/by/4.0/.
Table 12 Most common parameters and outputs used in the reviewed literature
Sample Load cell Strain rate Outputs Frequency
R-ratio Wave form Compression Prismatic/cylindrical 30–100 kN 10−3s−1 0.5–2 mm/min Young’s modulus Quasi-elastic gradient Yield stress -Tensile Prismatic/cylindrical 50 kN 10−3s−1
0.1–2 mm/min Young’s modulusYield stress
Ultimate tensile strength
-Bending Prismatic 15–1000 kN 10−3s−1 0.25–1 mm/min Young’s modulus Peak load Flexural strength
-Fatigue Cylindrical/prismatic 10–25 kN - Fatigue strength
Graphical
10–15 Hz
0.1–10
![Fig. 1 Scheme of the laser-based powder bed fusion process [ 7 ]](https://thumb-eu.123doks.com/thumbv2/123dokorg/5569579.66582/2.892.80.436.77.307/fig-scheme-laser-based-powder-bed-fusion-process.webp)
![Fig. 2 Examples of lattice structure unit cells [ 35 ]](https://thumb-eu.123doks.com/thumbv2/123dokorg/5569579.66582/3.892.127.765.635.1045/fig-examples-lattice-structure-unit-cells.webp)
![Fig. 3 Geometry and characteristics of the gyroid unit cell [ 40 ]](https://thumb-eu.123doks.com/thumbv2/123dokorg/5569579.66582/4.892.80.437.701.1048/fig-geometry-characteristics-gyroid-unit-cell.webp)
![Fig. 4 Compression curves of a 316L BCC samples with different graded patterns [ 112 ]](https://thumb-eu.123doks.com/thumbv2/123dokorg/5569579.66582/11.892.127.767.545.1033/fig-compression-curves-bcc-samples-different-graded-patterns.webp)